Unified Analytics Reporting Data Tables
A list of the fields available for reporting on using Unified Analytics.
Unified Analytics uses transformed data tables for report metrics and data relationship mapping. Some of these data tables may have been adjusted to fit the custom tags of your organization.
Available Tables
The fields in the data model are configured during your migration or implementation and cannot be changed by Designers. Reach out to BigPanda support to add or change any data columns, for example to change timezones, concatenate tag fields, or whitelist specific fields from the Incident or Alert Tags.
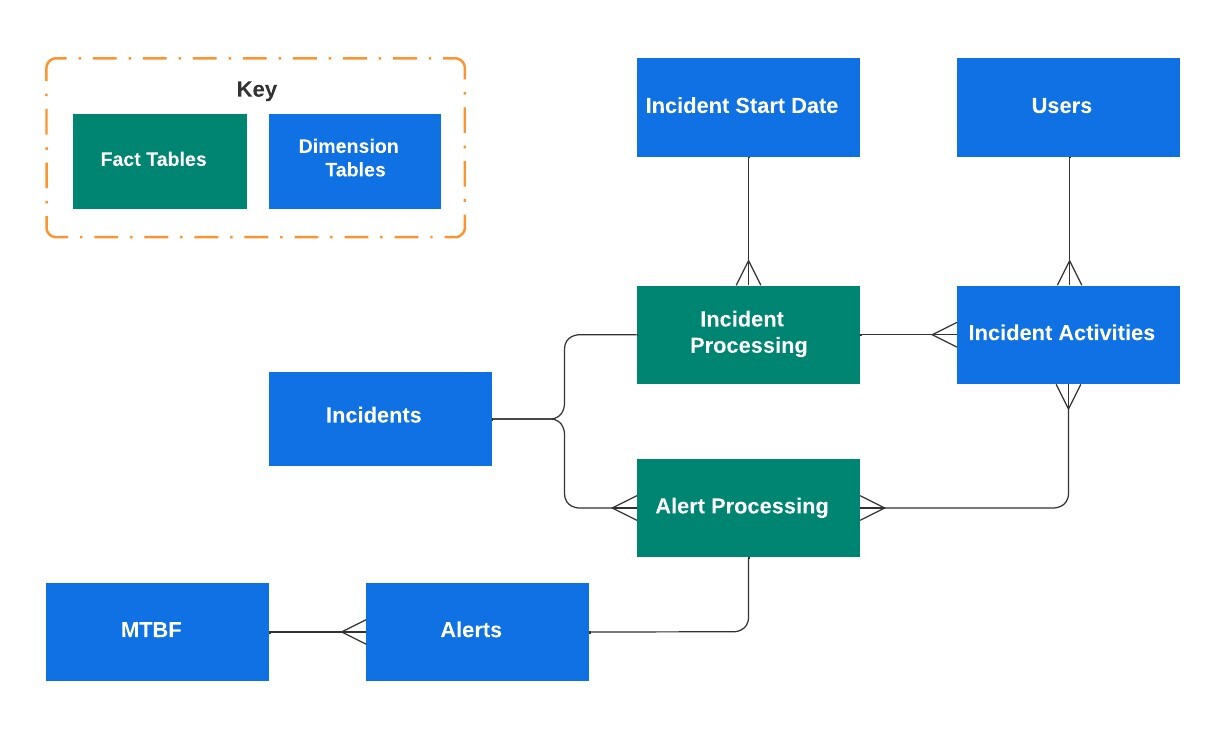
Table Relationships to BigPanda Events
- Alerts enter BigPanda (Entities)
- Alerts are enriched with metadata and enrichment tags (Alert Tags)
- Alerts are correlated into BigPanda Incidents (Incidents)
- Alerts are further enriched automatically and manually with Incident Tags (Incident Tags)
- The system and users take action on the incident, such as commenting, sharing, and entering or ending the flapping state (Incident Activities)
The Date table is provided in our data model to enable multiple time zone support and is based on Incident Start Date. Customers can request other data fields in their timezone as needed.
The Mean Time Between Failures table provides aggregated metrics on the frequency of alerts at the Host/Check level for ease of reporting in the Mean Time Between Failures widget. For details on TTx metrics (assign, detect, resolve) for individual incidents, refer to the Incident Metrics table instead.
To learn more about how BigPanda deduplicates, correlates, and enriches alerts into incidents, see the Manage Alert Correlation documentation.
To learn more about how BigPanda processes, enriches, and resolves incidents, see the Incidents in BigPanda documentation.
To learn more about using Reporting Tables in BigPanda, see the Unified Analytics documentation.
Reporting Data Tables
Incident Start Time (Dim)
The Date table is provided in our data model to enable multiple time zone support and is based on Incident Start Date.
| Column Name | Description | Data Type | Notes |
|---|---|---|---|
| datetime (utc) | The translated event time in UTC | Date/Time | |
| datetime (pst) | The translated event time in PST | Date/Time | |
| datetime (mst) | The translated event time in MST | Date/Time | |
| datetime (cst) | The translated event time in CST | Date/Time | |
| datetime (est) | The translated event time in EST | Date/Time | |
| datetime (india) | The translated event time in India time zone | Date/Time | |
| day of the week # (utc) | The numerical day of the week the system event occurred in UTC | Integer | 0=Sunday - 6=Saturday |
| day of the week # (pst) | The numerical day of the week the system event occurred in PST | Integer | 0=Sunday - 6=Saturday |
| day of the week # (mst) | The numerical day of the week the system event occurred in MST | Integer | 0=Sunday - 6=Saturday |
| day of the week # (cst) | The numerical day of the week the system event occurred in CST | Integer | 0=Sunday - 6=Saturday |
| day of the week # (est) | The numerical day of the week the system event occurred in EST | Integer | 0=Sunday - 6=Saturday |
| day of the week # (india) | The numerical day of the week the system event occurred in India timezone | Integer | 0=Sunday - 6=Saturday |
| Incident Start - Filter (utc) | The translated event time in UTC | Date/Time | This field should only be used in filters, not dashboard widgets |
| Incident Start - Filter (pst) | The translated event time in PST | Date/Time | This field should only be used in filters, not dashboard widgets |
| Incident Start - Filter (mst) | The translated event time in MST | Date/Time | This field should only be used in filters, not dashboard widgets |
| Incident Start - Filter (cst) | The translated event time in CST | Date/Time | This field should only be used in filters, not dashboard widgets |
| Incident Start - Filter (est) | The translated event time in EST | Date/Time | This field should only be used in filters, not dashboard widgets |
| Incident Start - Filter (india) | The translated event time in India time zone | Date/Time | This field should only be used in filters, not dashboard widgets |
Alerts (Dim)
Each alert is the aggregated group of each alert status update and changes in BigPanda. See Alerts for more information.
| Column Name | Description | Data Type | Notes |
|---|---|---|---|
| alert_id | The unique identifier of the alert | String | |
| source system (system code) | The monitor system that sent this alert | String | |
| alert start time (epoch) | The unix time the alert started | Integer | |
| alert last changed time (epoch) | The unix time for the last change made to an alert | Integer | |
| alert end time (epoch) | The unix time for the resolution of the alert | Integer | |
| alert status | The current status of the alert | String | Ok, Critical, or Warning |
| alert highest severity | The highest status the alert reported at any time | String | Can be used to find alerts that were critical at any point |
| alert start date/time (utc) | The date/time that the alert started | Date/Time | |
| alert end date/time (utc) | The date/time when the alert resolved | Date/Time | |
| source system | The monitor system that sent the alert (cleaned) | String | |
| primary_property_key | The tag name of the primary property | String | |
| secondary_property_key | The tag name of the secondary property | String | |
| BP Business Segment | A business portion or unit that drives unique action or functionality. | String | For example, a high-level Business Unit, Team, Group, or Organization. Default fields are: bp_v_business_segment bp_group bp_assignment_group assignment_group |
| BP Config Item | An aggregated field used to capture the relevant configuration item. | String | Default fields: host application bp_application service bp_service bp_v_config_item A custom field can also be set. |
| BP Business Category | A logical type of alert that can be connected to a meaningful function, service or a recurring topic. | String | This can be a function like application, infrastructure, service, etc. Or it can be a more technical alert category like latency, load, etc. Default fields are: bp_v_business_category bp_category alert_category |
| Alert dedup key | Field used to identify duplicate incoming alerts | String | |
| alert tag columns * | String value of alert tag, defined by column name | String | The alert tags that are listed in Unified Analytics reporting are dynamic and will depend on your organization’s enrichment tags. Each tag will have its own value column For example, you may see columns for host, app_tier, escalation_team, alert_category, etc. |
Alert Processing (Fact)
All tags of an alert with normalized fields.
| Column Name | Description | Data Type | Notes |
|---|---|---|---|
| alert_id | The unique identifier of the alert | String | |
| incident_id | The unique identifier of the incident | String | |
| alert status changes | The number of times the alert has changed status | Integer | Status count includes the initial status. Changes to the “ok” statuses are not counted (if an alert has an initial status of critical, then changes to warning, then to ok, then to critical, then to ok, the status count would be 3) |
| alert start minute | The unix time the alert started in minutes | Integer |
Incident Activities (Dim)
A single action a user performed in BigPanda.
| Column Name | Description | Data Type |
|---|---|---|
| a.activity_id | The unique identifier of the activity | String |
| a.incident_id | The unique identifier of the incident | String |
| a.creator_user_id | The id of the user that took the action in BigPanda | String |
| created_ time | The unix time the action was taken | Integer |
| activity start minute | The unix time the activity was initiated in BigPanda | Integer |
| activity environment | The name of the environment the activity took place in | String |
| activity comment | The comment that was included with the activity | String |
| share target | The name of the system the related incident was shared to | String |
| shared activity target (system code) | The BigPanda unique identifier of the system the related incident was shared to | String |
| flapping_state | Whether or not the related incident is flapping. True indicates that the incident is currently flapping. False indicates that the incident was flapping at one point, but isn’t currently. N/A indicates that the incident has never been flapping. | Boolean |
| activity type | The type of activity (cleaned) The following activity types are available: assigned become-flapping commented external-resolve manual-resolve merge shared snoozed split unassigned unsnoozed | String |
Users (Dim)
Users who perform actions on an incident.
| Column Name | Description | Data Type | Notes |
|---|---|---|---|
| user_id | The unique identifier of the user who performed the action | String | |
| name | The BigPanda UI name of the user who performed the action | String | |
| The email address of the user who performed the action | String | ||
| roles | The access roles assigned to the user who performed the action | String |
Incident Processing (Dim)
Pre-aggregated metric totals for Time to Assign / Detect / Resolve (TTA, TTD, and TTR)
| Column Name | Description | Data Type | Notes |
|---|---|---|---|
| incident_id | The unique identifier of the incident | String | |
| incident start minute | System field - can be ignored | Integer | |
| time to assign (mins) | Number of minutes to assign the incident | Integer | |
| time to engage (mins) | Number of minutes before action was taken on the incident | Integer | |
| time to resolve (mins) | Number of minutes to resolve the incident | Integer |
Incidents (Dim)
A single BigPanda incident
| Column Name | Definition | Data Type | Notes |
|---|---|---|---|
| time to assign (mins) | Number of minutes to assign the incident | Integer | |
| time to engage (mins) | Number of minutes before action was taken on the incident | Integer | |
| time to resolve (mins) | Number of minutes to resolve the incident | Integer | |
| first_action | The unix time the first action was taken on the incident | Integer | |
| incident start time (epoch) | The unix time the incident started | Integer | |
| Incident start date/time (UTC) | The date/time the incident started | Date/Time | |
| incident end time (epoch) | The unix time for the resolution of the incident | Integer | |
| Incident end date/time (UTC) | The date/time for the resolution of the incident | Date/Time | |
| incident last changed time (epoch) | The unix time for the last status change | Integer | |
| incident status | The current status of the incident | String | Ok, Critical, or Warning |
| incident highest severity | the highest status of the incident | String | Can be used to differentiate incidents that were critical at any point |
| manual_correlation | Did a BP user manually correlate the incident in BP UI | Boolean | |
| incident_hyperlink | URL with the org's "All incidents" environment and incident ID spliced | String | Can be used in Tables/Aggregated Tables to provide hyperlinks to the Incident |
| BP Incident Quality | BigPanda categorizes alert quality based on the amount of enrichment or context available. | Integer | High Quality Alerts - Contains all important data needed for a team to triage and resolve the alert, with focus on business context. Medium Quality Alerts - An alert that contains the minimum level of information and technical context to support operator action. These alerts lack some valuable elements such as business context, dependencies, or resolution steps. Low Quality Alerts - Alerts that lack key information or which were identified as irrelevant or misconfigured |
| BP Incident Closure | A classification field on the workflow status of an incident | String | Based on actions, incidents are categorized as: Shared - The incident was manually shared Auto Shared - The incident was AutoShared Auto Resolved - The incident was resolved externally Missed - The incident resolved itself without intervention No Action - The incident was resolved manually with no other action Resolved in BP - The incident was resolved within BigPanda Still Open - The incident is still open |
| BP Incident Resolution Bucket | Incidents are placed in resolution buckets depending upon the time to resolve. | String | Resolution buckets include the following: Still Open Under 5 min 5 - 30 min 30 - 60 min 1 - 4 hours 4 - 24 hours 1 - 7 days Over a week |
| BP Incident Actionable | An incident that contains high quality alerts enriched with both technical and business context. | Boolean | Unified Analytics uses the following criteria to determine if an incident is actionable: - Explicitly defined as actionable using bp_v_actionable tag - Enriched with business context (using the bp_v_business_segment tag) - Incident was acted upon - Not defined as noise (using the bp_v_alert_noise tag) |
| BP Incident Outlier | Incidents are set as an outlier if: Assign time is over a day Engage time is over a day Resolution time is over a week If an incident isn’t an outlier, the setting is Valid | Boolean | |
| Num of alerts | Number of unique alerts correlated with the incident. | Integer |
MTBF (Fact)
Mean Time Between Failures. Calculations to assist with querying the Alert Analysis Report. This table represents aggregated results of the data in the Incident Metrics table. See Unified Analytics Key Metrics for more information about MTBF.
| Column Name | Description | Data Type | Notes |
|---|---|---|---|
| MTBF host | The host (not normalized) | String | |
| MTBF check | The check (not normalized) | String | |
| tagsjoinkey | Field used to connect MTBF data to the alert | String | |
| MTBF Mean Time Between Failures (hrs) | The mean time between failures | Integer | |
| MTBF occurrences | The number of mean time between failures occurrences | Integer | |
| MTBF last seen | The date/time that the mean time between failures last seen | Date/Time |
Next Steps
Learn how to Manage Unified Analytics Reports
Find definitions of key metrics for Unified Analytics
Learn how to navigate the Analytics tab
Updated 7 months ago