ITSM Tools
The ITSM Tools Dashboard gives you a deep dive into how BigPanda is interacting with your ITSM tools including ticket automation, compression, and trending.
Dashboard duplication
This dashboard can be duplicated. See the Manage Unified Analytics documentation to learn how to create a new dashboard from a copy.
Key Features
Evaluate the effectiveness of automated ticketing for each ITSM tool
View ticket volume trending to spot escalating issues or concerns
Evaluate ticketing compression effectiveness through BigPanda
Identify which applications are creating the most tickets
Widgets
The following widgets are available in the ITSM Tools Dashboard:
Widget | Description |
|---|---|
Incidents Shared | The number of all outbound shares. The calculation for this widget is ([# of unique incident_id], [activity type]). |
% Incidents Shared | The percentage of incidents that resulted in an outbound ticket. The calculation for this widget is ([# of unique incident_id], [activity type]) / ([# of unique incident_id]). |
AutoShared Incidents | The number of outbound shares triggered by AutoShare rules. The calculation for this widget is ([# of unique incident_id], [activity type]). |
Manually Shared Incidents | The number of outbound shares created manually by a user in the UI. The calculation for this widget is ([# of unique incident_id], [activity type]). |
Share Reduction % | The ticket reduction percentage for incidents that were shared, and the quarter-over-quarter percentage change. The calculation for this widget is 1- ([# of unique incident_id] / [Total alert status changes]). |
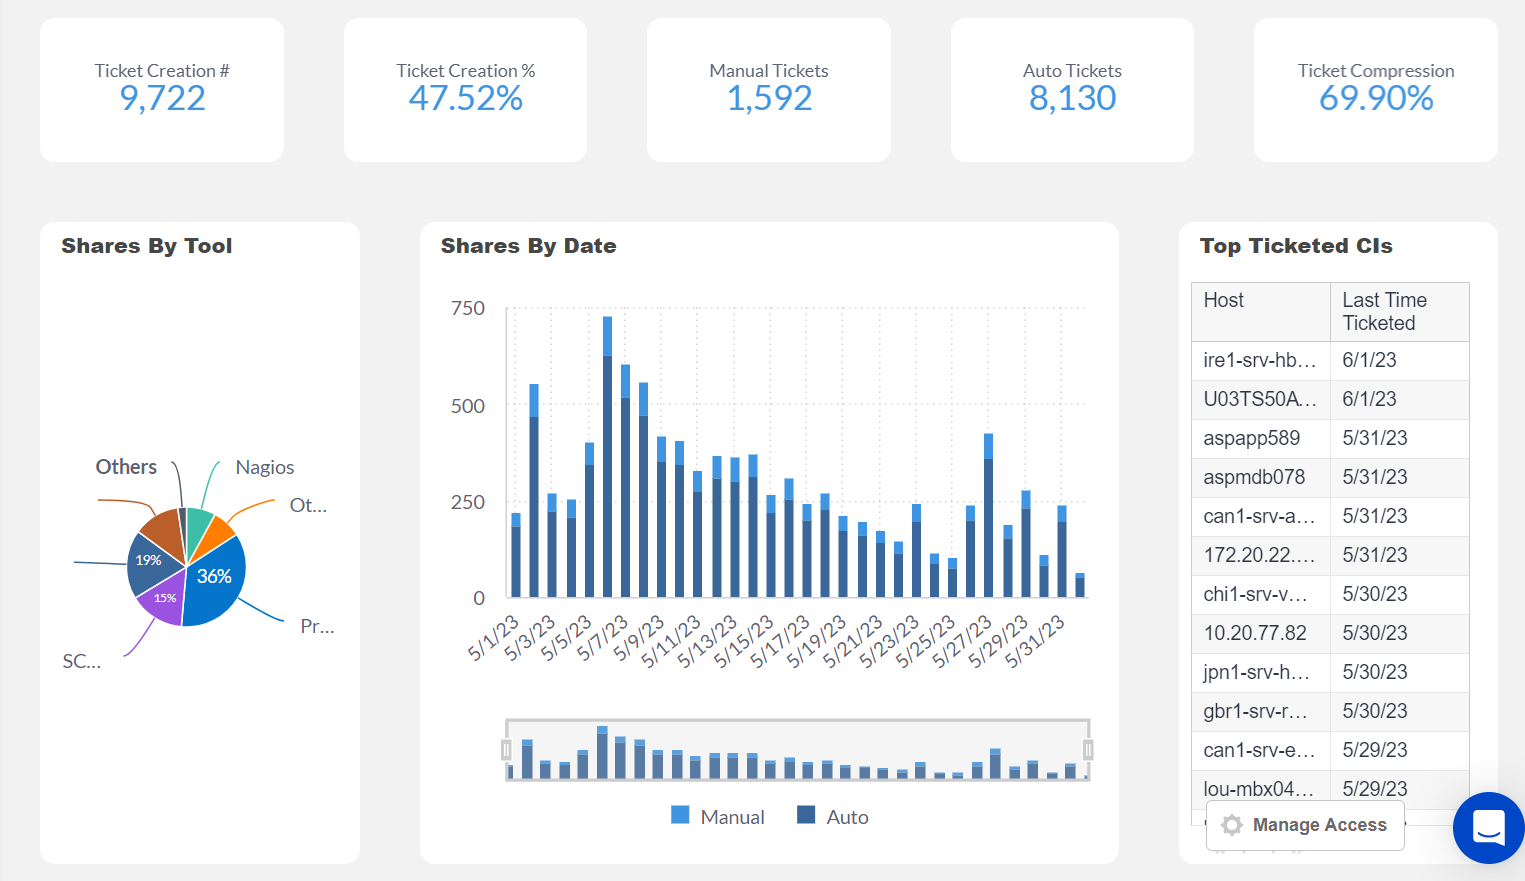
Shares by Tool | The percentage of outbound ticket shares sent to individual tool integrations. Selecting the Others category in the chart will expand into a new pie chart listing only tools with smaller percentages. |
Share Reduction | The number of incidents that were shared, broken out by week. The trendline tracks the overall alert compression percentage for incidents shared each week. |
Top Shared Hosts | Tickets that have the most updates to share tools, sorted by host system. |
Shares Over Time | The number of tickets shared to each tool per week. |
Next Steps
View Unified Analytics dashboards.
Learn how to Manage Unified Analytics.
Find definitions of Unified Analytics key metrics.
Dive into potential reporting fields in the Standard Data Model documentation.