Live Dashboards
The Dashboard tab provides real-time statistics on operational health and bandwidth in a visually simple format ideal for status tracking. Within the Dashboard tab, you can:
See overall service health at a glance.
Understand which services and applications are affected by current incidents.
Visualize important trends, and make sure the right team members are responding.
Focus your teams on the highest priorities by showing only the Environments for the most critical infrastructure and applications.
Each dashboard displays key operational data for selected environments. While a dashboard is open, the data is refreshed every minute.
The color coding and simple format of the Dashboards tab is designed for a NOC wall or extra monitor displays to make passive monitoring of key environments easy. To view live dashboards, click the Dashboards tab at the top of the screen
For information about creating live dashboards, see the Manage Live Dashboards documentation. See The Dashboards Tab page for navigation information.
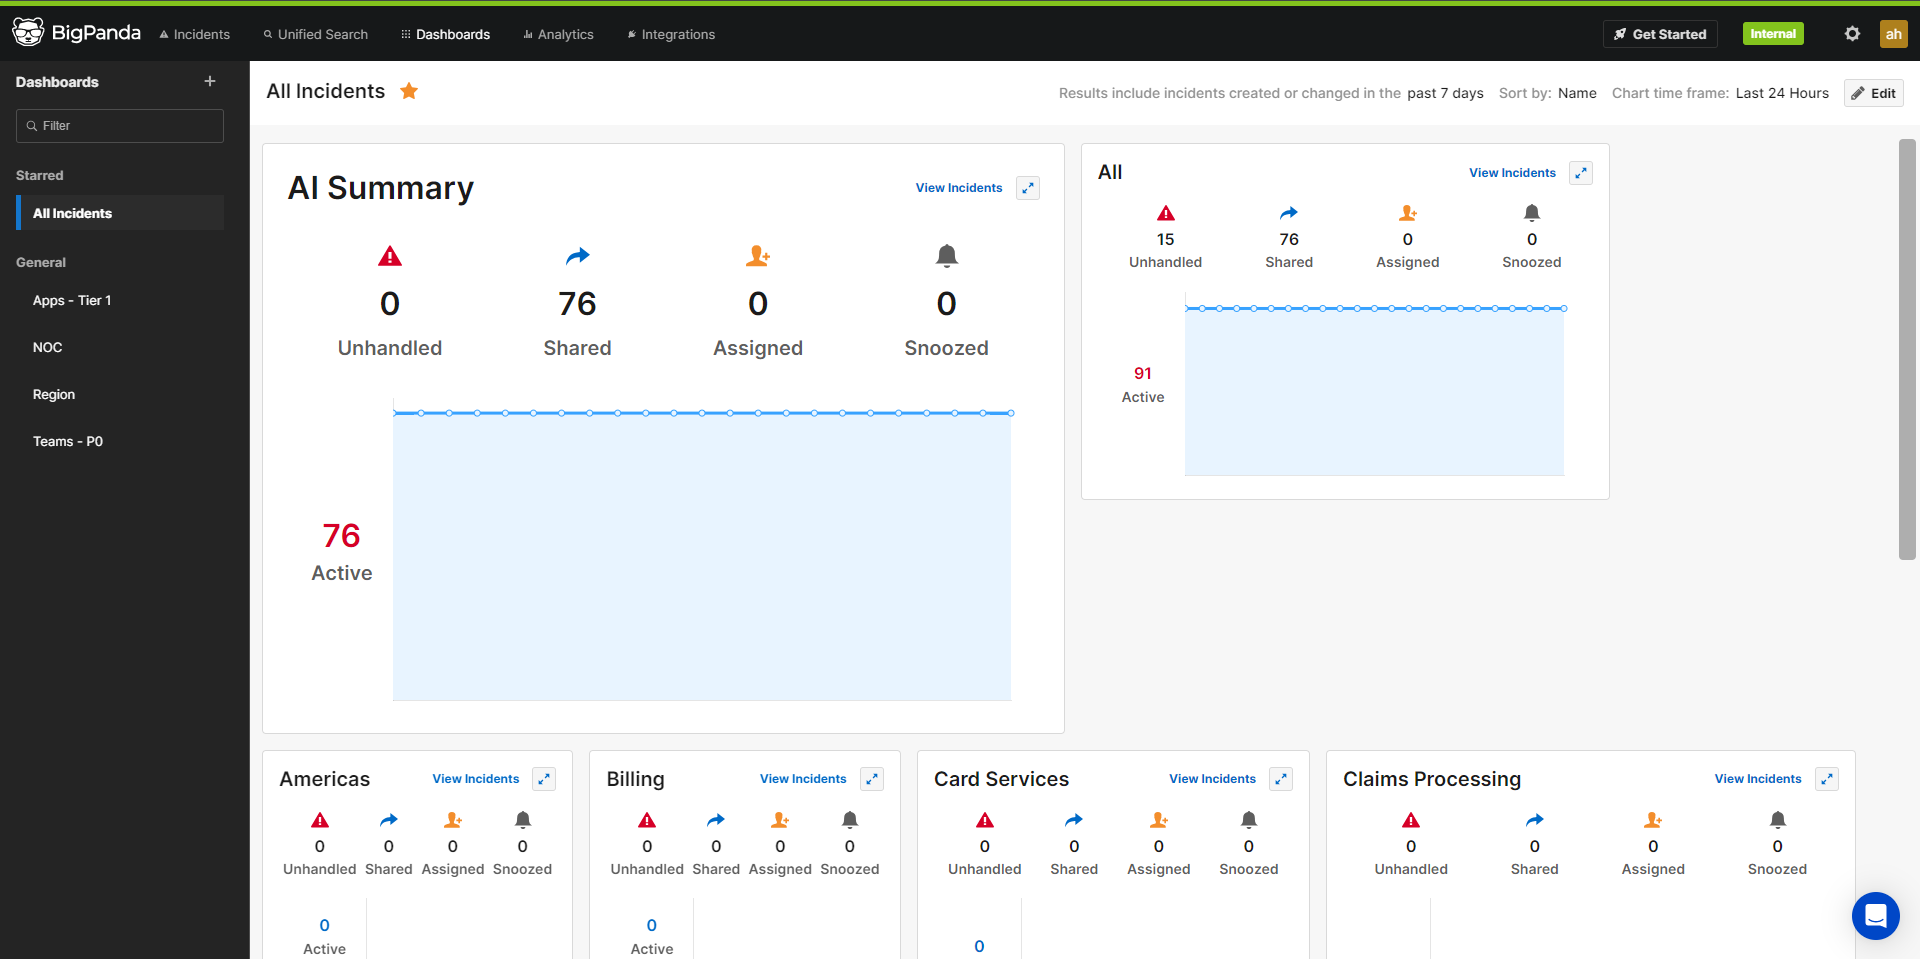
Live Dashboard Screen
Dashboard Widgets
Widgets are display options used in a dashboard. The following widget options are available:
Severity Widget
A widget that shows a breakdown of incidents in the selected environment according to different statuses: Critical, Warning, and Unknown.
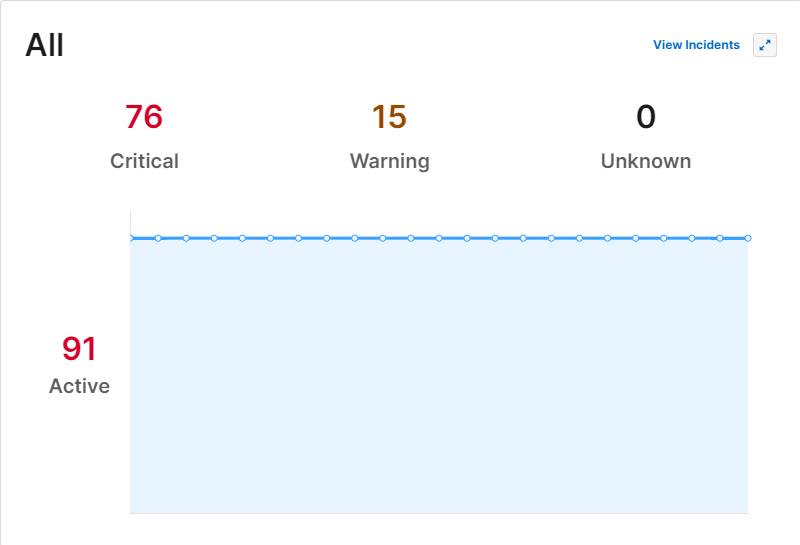
Severity Widget
Workflow Widget
A widget that shows a breakdown of incidents in a given environment based on their different lifecycle phases and activities: Unhandled, Shared, Assigned, and Snoozed.
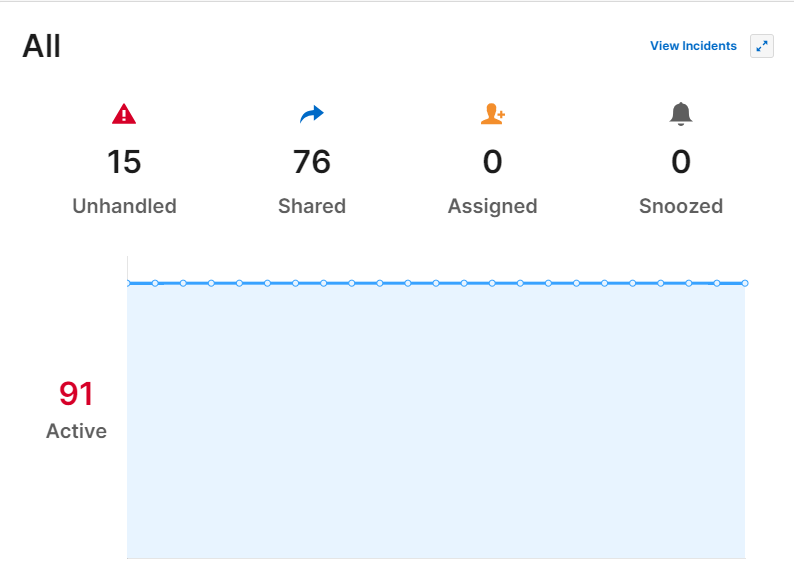
Workflow Widget
Both widget types show the total active incidents and an active incidents trend graph.
Resize Widgets
You can resize widgets to customize the look of your dashboard. To resize a widget, hover over the upper right corner of the widget and click the Resize widget icon. Select XSmall, Small, Medium, or Large from the list.
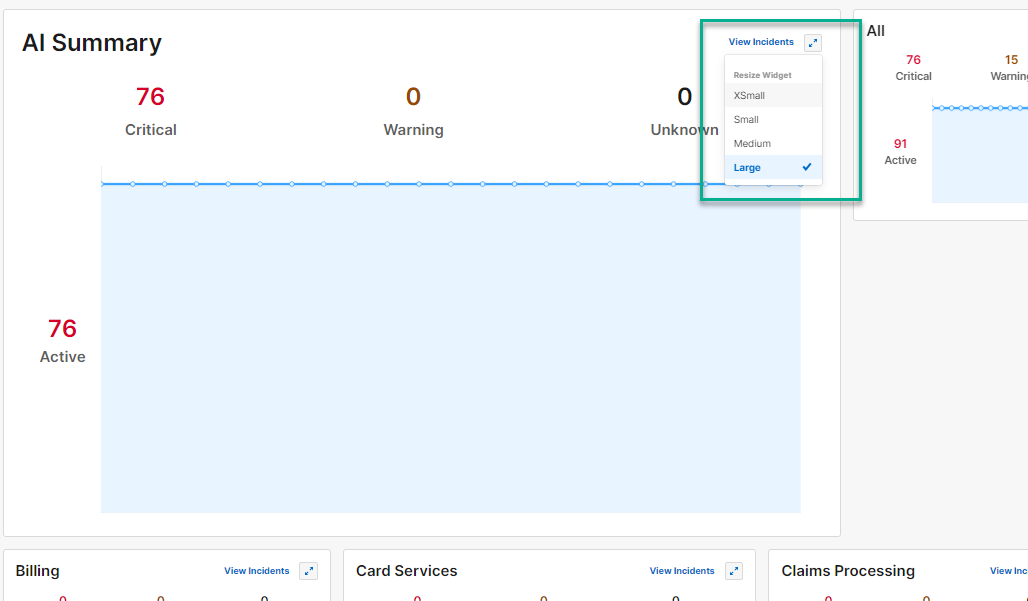
Resize a Widget
Widget resizing
Widget size changes made by dashboard admins persist for all users who view the dashboard.
Starred Dashboards
Users can further refine their organization and mark dashboards using a star. Click the star icon to the right of a dashboard name to mark it.
When at least one dashboard is marked with a star, a new starred category is added to the left side navigation.
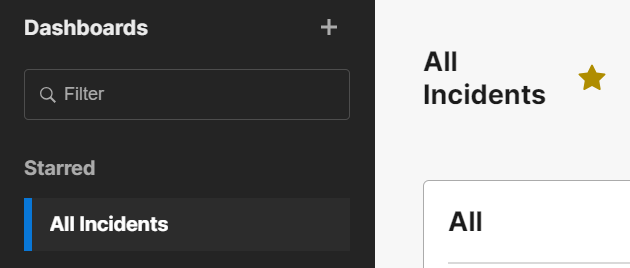
Starred Dashboards
Users can star Environments to make them easier to find during Dashboard creation. When building a new dashboard, the environments preview shows a star indication for the starred environments. When building a new dashboard, the environments preview shows a star indication for the starred environments:
Filter Dashboards
To filter the list of Dashboards, type a dashboard name into the Filter search bar.
Matching results will appear in real-time. Clearing the filter search bar will revert the list and show all dashboards.
Expand Dashboard Display
The dashboards in the BigPanda console are geared toward the big screens in NOCs, where engineers can view everything with incidents in the past 24 hours.
Hover over the left-side Dashboards panel and click the blue arrow to collapse the sidebar. This allows you to make the most of a large screen's real estate.
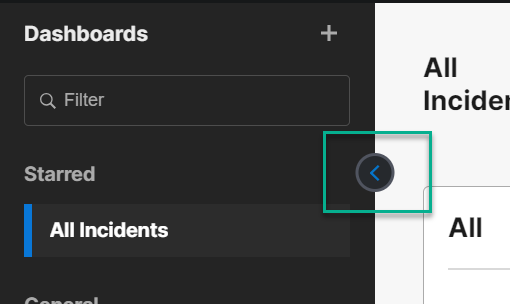
Expand Dashboard
Next Steps
Learn to Manage Live Dashboards
Find navigation information for the Dashboards Tab
Learn about Unified Analytics