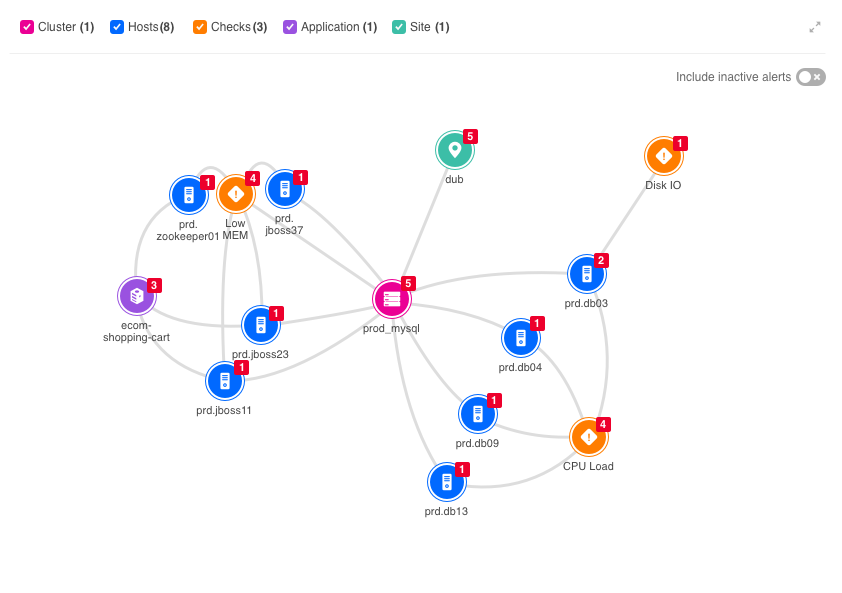
The Topology Tab

Use the Topology tab within the Incident Details Pane to see a visual display of the the links between alert tags.

The Topology tab displays a detailed Topology graph for the incident. The graph is a visual display of the links between the incident's alert tags, or nodes.

The Topology Tab

The Topology Tab

The Topology Graph

Each node on the topology graph represents an alert tag value. The tags present in the incident are labeled by type and displayed as icons in the Topology graph.

The numbers in the corners of the nodes indicate the frequency with which each unique tag and value appears in the incident. The more times a tag appears, the higher the likelihood that it’s a contributor to the root cause of the incident.

The lines connecting the nodes in the graph indicate that the linked nodes appear in the incident’s alerts together. Examining nodes with the most links can provide valuable insight into the possible root cause of the incident.

The Topology Graph

The Topology Graph

By default, BigPanda connects all the correlation tags into a circle. All the primary tags (ie: host) are connected to their associated correlation tags and the secondary tags (ie: check) are connected to their primary tags.

🚧

Customizing the Graph

Customizing the graph using the Topology UI API will override BigPanda's default configuration.

Topology Graph Icons

The default icons that comprise the Topology graph are permanent and pre-defined by BigPanda. Additional configurable fallback icons are provided to allow users to define their own custom nodes.

The following are the nine permanent icons provided by BigPanda to represent the Topology node tag types:

IconTypeAssociated Tags
server'server', 'servers', 'host', 'hosts', 'hostname', 'hostnames', 'host_name', 'host_names', 'device', 'devices', 'instance', 'instances', 'object', 'objects', 'node', 'nodes'
location'location', 'locations', 'datacenter', 'datacenters', 'dc', 'store', 'stores', 'site', 'site_code', 'store_id', 'region', 'regions', 'city', 'country', 'geo'
check'check', 'checks', 'trigger', 'triggers', 'alert_type', 'alert_name', 'health_rule', 'summary', 'monitor', 'health_rules', 'title', 'titles'
environment'environment', 'environments', 'env', 'envs', 'tier', 'tiers', 'stage'
application'application', 'applications', 'app', 'apps', 'service', 'services', 'business_service'
IP'ip_address', 'ipaddress', 'ipaddresses', 'ip_class_b', 'ip_class_c', 'ip'
router'router', 'routers', 'switch', 'switches', 'hub', 'repeater', 'bridge', 'gateway'
cluster'rack', 'cluster', 'clusters', 'tower', 'towers'
team'owner', 'owners', 'team', 'teams', 'group', 'groups', 'assignment_group', 'responsible_group'

Filter

The node filtering options at the top of the Topology tab allows you to show or hide the nodes in the graph according to their corresponding tag type. The numbers beside the nodes in the filter represent the frequency with which the node appears in the topology graph.

Topology Filters

Topology Filters