New Incident Console
Triage and investigate incidents more effectively with a more responsive, intuitive, and user-friendly incident feed.
The BigPanda Incident Console has been reimagined to deliver a more intuitive incident feed with improved usability and performance. You can now adjust the BigPanda Incident Feed to better fit your incident management workflow and surface more actionable insights.
In addition to improved load times and streamlined design, this update brings you dark mode, custom layouts, and select-all functionality.
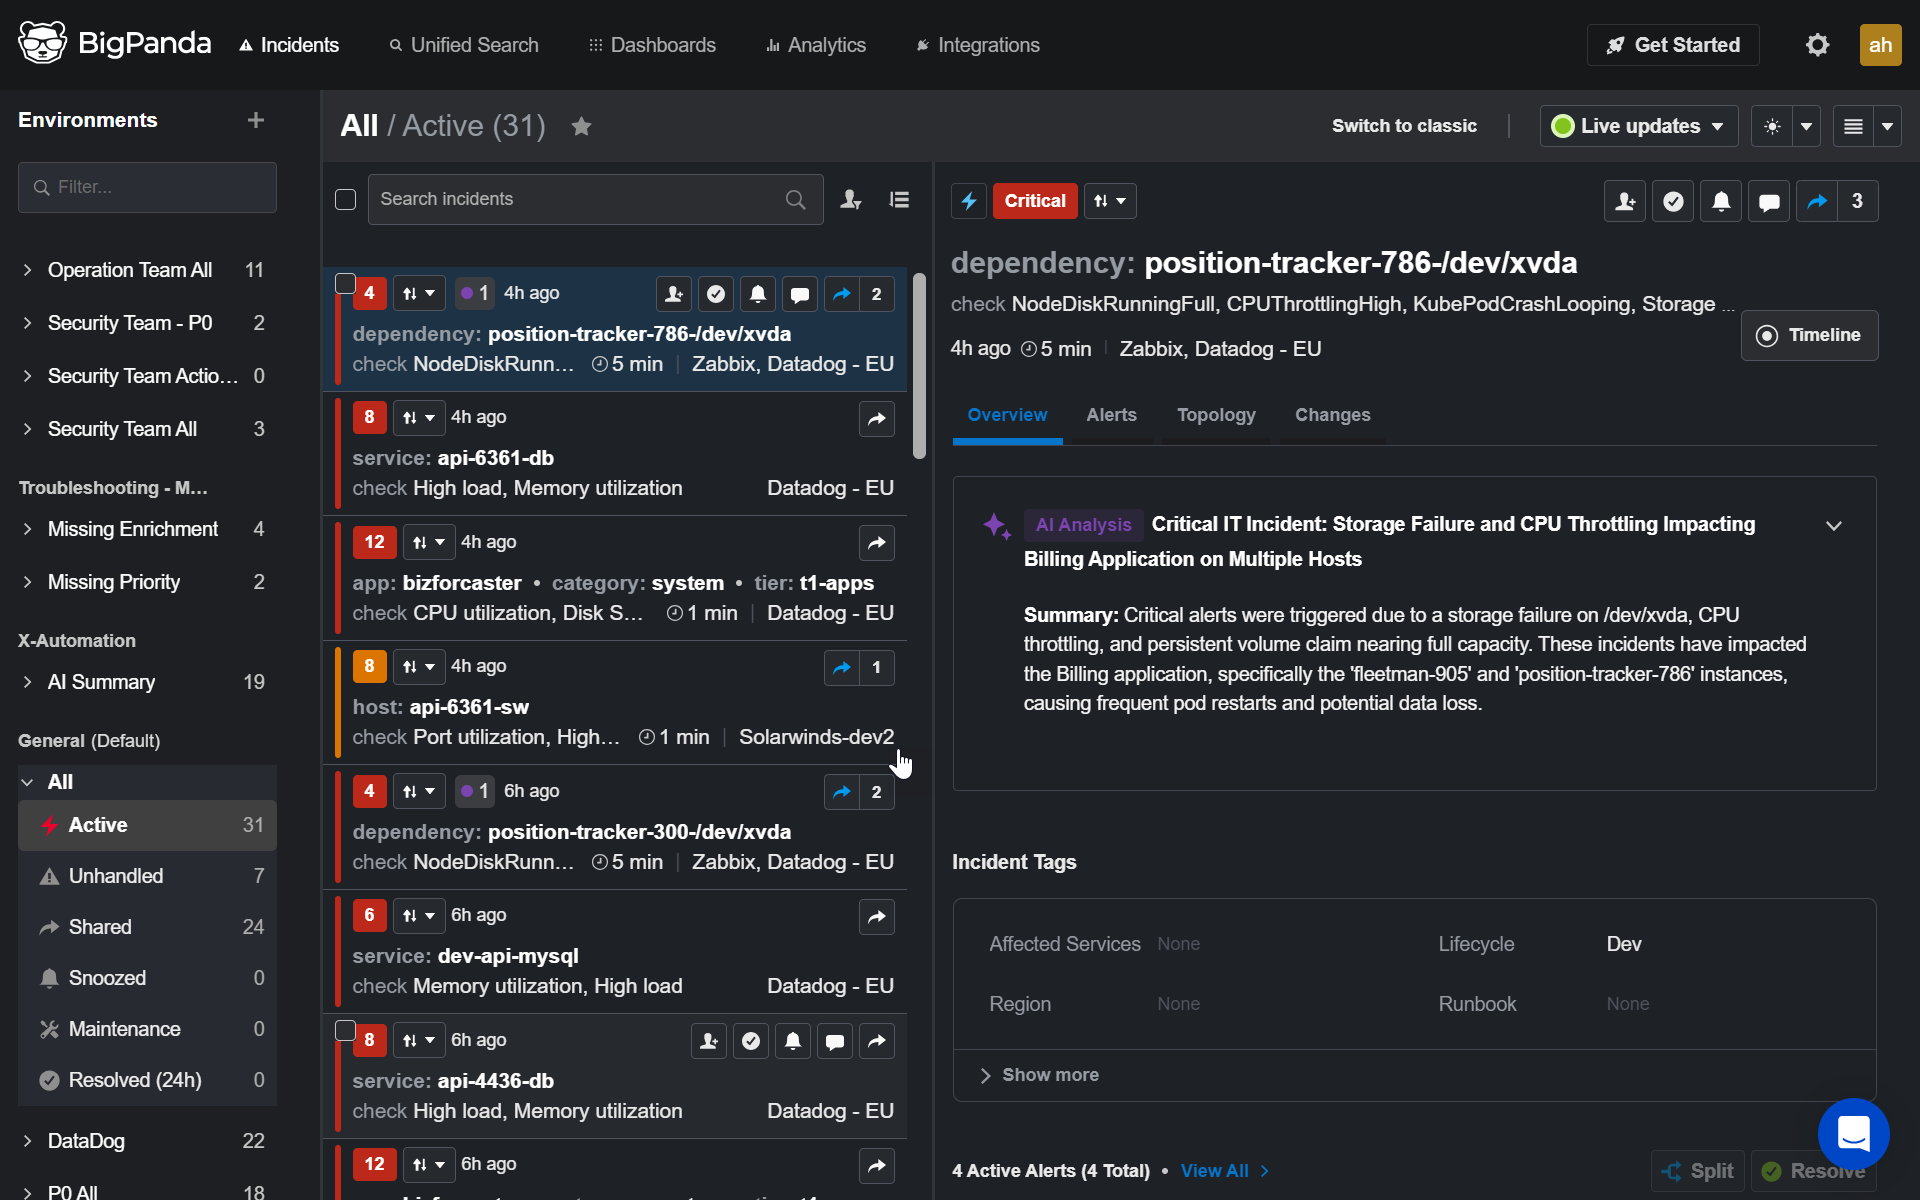
New Incident Console
What’s Changed
- Faster load times when opening the feed or moving between incidents
- Customizable view options:
- Dark/light themes
- Custom pane layouts
- Resizable sections
- Collapsible Environments navigation pane
- Activity log filtering
- Time zone customization
- Environment sorting
- Improved functionality:
- See Root Cause Changes (RCC) suspects on the incident ribbon.
- View the RCC Change Score
- Pagination
- View live/manual update mode status
- Select all incidents checkbox
- Create Environment button moved to top
- New flapping indicator

New Console Changed Functionality
Time to settle in
We know UI changes can take time to adjust to. You can toggle back to the classic incident console at any time with the Switch to classic link at the top of the pane.
If you later decide you want to return to the new console from the legacy feed, click the New feed experience link beneath the incident search bar.
Improved Functionality
The new incident console also includes all of the updates from the Incident Details Page Improvements. When viewing incidents in full-screen, you’ll find all the additional information of that update at your fingertips.
The new expanded Incident Details page makes triaging incidents easier with several performance and element updates. When expanding an incident to full screen to view details, several changes will be available:
- Export capabilities
- Improved Incident Timeline
- More complete activity tracking
- Infinite scrolling in the activity log
- Improved commenting in the activity log
- Activity log filtering
- New flapping indicator
View Root Cause Changes (RCC) Suspects
Root Cause Changes (RCC) compares your change data with active existing incidents in real-time. Changes that are suspected as a potential root cause are flagged and added to the incident.
In the new incident console, suspected root cause changes are marked on the incident ribbon with a purple dot.
Hover over the purple dot to see how many suspected changes are flagged in the incident. To view more details, click on the incident and navigate to the Changes tab in the incident pane.
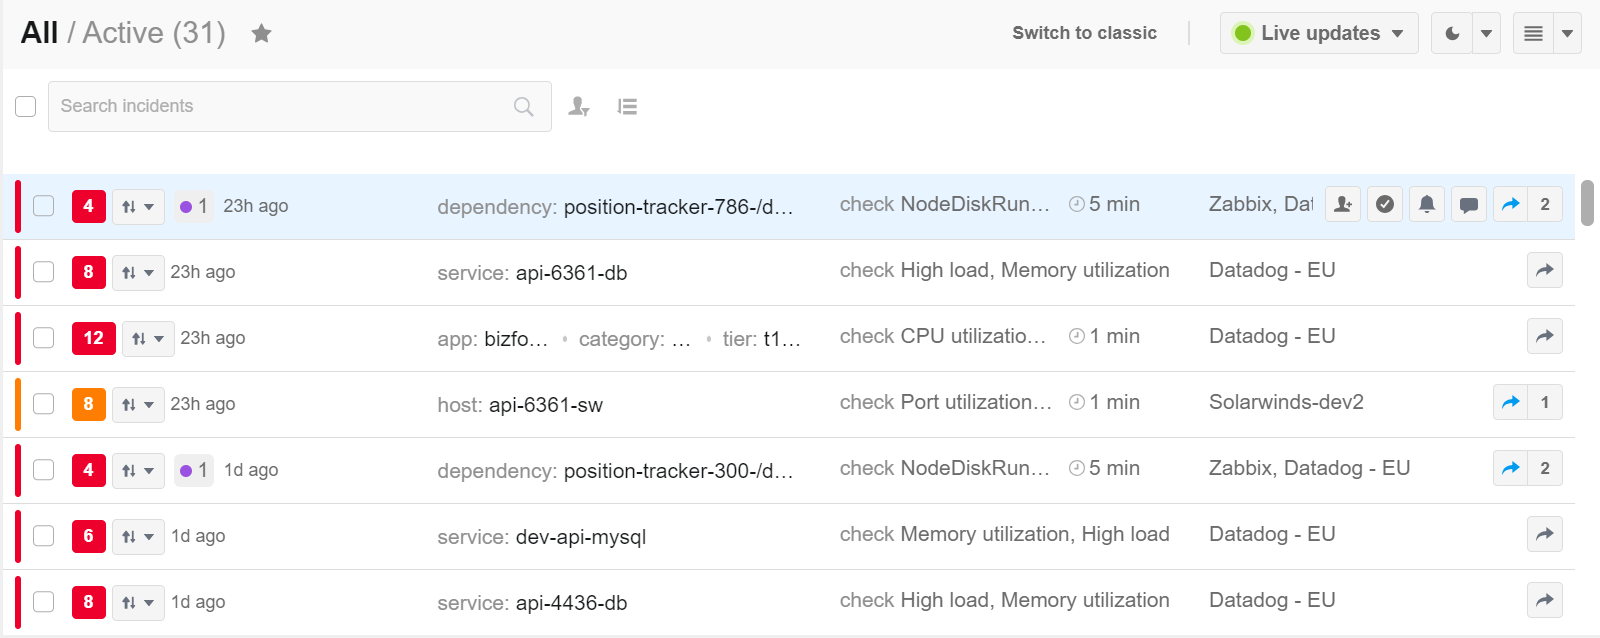
Suspected root cause changes flagged on the incident ribbon
Read our documentation on Root Cause Changes to learn more about how to use this feature.
View the Change Suspect Score
Root Cause Changes (RCC) runs calculations on key connections between incidents and changes. Each automatically generated match between an incident and a change is given a causation score based on these calculations, with a higher score indicating a more likely suspect.
Score calculation
Change suspect causation scores do not have an upper limit. Each suspect match point gets added to the score. Higher scores indicate a stronger match and can assist in determining the most likely suspect.
Scores only appear for matches that have met the threshold in your RCC configuration. To adjust your RCC configuration, contact BigPanda Support.
To set a baseline of your scores and monitor trends, see the Suspected Changes Analysis dashboard in Unified Analytics.
You can now see the score BigPanda assigned to change suspects right in the incident details pane.
Within the Overview tab, the score now appears in the Potential Root Cause Changes table in the Score column.

Suspect score in the Potential Root Cause Changes table
In the Changes tab, you can see the score when the Show potential RCC only option is toggled on.

Suspect score in the Changes tab
You can also view the suspect score at the top of the Change Details pane.
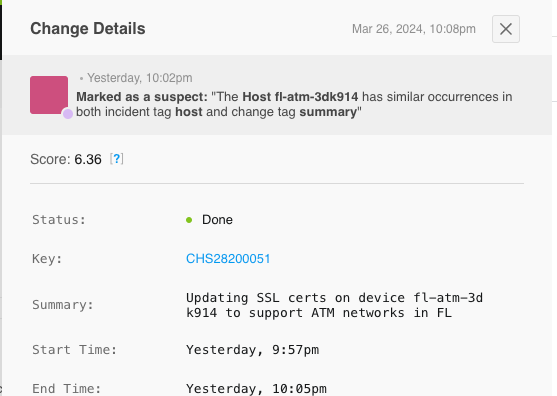
Suspect score in the Change Details pane
Manually marked suspects
Changes that were manually marked as suspect or not found to be a suspect will not have a score.
See the Root Cause Changes documentation for more information.
Live/Manual Update Toggle
To maximize performance, you can toggle your incident feed between Live and Manual Updates. Live Updates update the feed with new incidents, comments, and changed incident statuses automatically. Manual Updates will only update the incident feed when you refresh your browser page, or when reopening the page after closing.
At the top right of the incident console, you’ll see a button indicating whether or not the feed is getting live updates. Click this button to toggle between Live and Manual Updates. When the page is on the Live Updates setting with a green circle, new incidents will automatically appear in the incident feed as they arrive in the system. If the page is on the Manual Updates setting with a red circle, you’ll need to refresh the page to view new incidents.
Select Multiple Incidents
When you want to perform actions on multiple incidents at once, you can now select all incidents on a page with a single click. To select all incidents, click the selection box at the top of the incident feed next to the search bar.
This will select every incident on the current page and open the bulk actions options. You can prioritize, merge, assign, resolve, snooze, comment on or share multiple incidents at the same time.
Filter the Activity Log
You can now find relevant activities without scrolling through the entire history of the incident. Use the activity log filter to select specific event types to narrow the log, allowing you to find exactly what you need.
To filter the activity log, click the Activity dropdown, and select one or more event categories.
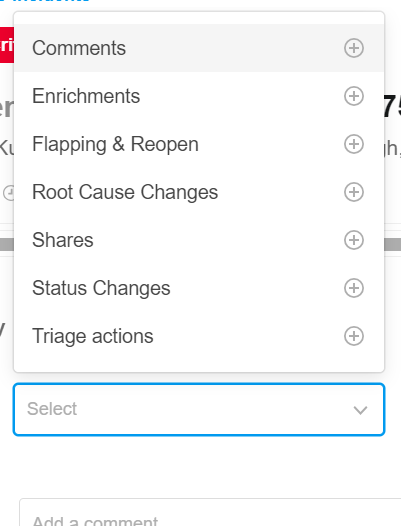
Activity Log Filter
Filter selection
Activity log filter selections are applied per user.
BigPanda will remember your activity log filter selection and apply it to all incidents until the filter has been cleared or a new selection is made.
The following event categories are available for filtering:
| Event Category | Event Types |
|---|---|
| Comments | User commented on an incident |
| Enrichment | AI update Manual or automatic tag update |
| Flapping & Reopen | Incident entered flapping state Incident reopened |
| Root Cause Changes | Change was marked as suspect |
| Shares | Incident was AutoShared Incident was manually shared |
| Status Changes | Alert payload-driven changes Incident was manually resolved Incident entered maintenance |
| Triage Actions | Priority was assigned or changed Incident was assigned Incident was snoozed Incident was merged with another incident Incident was split |
Flapping Indicator
It is now easier than ever to see at a glance when an incident has entered the flapping state.
This new flapping icon now appears in the incident feed, alerts table, activity feed, and in the incident timeline.
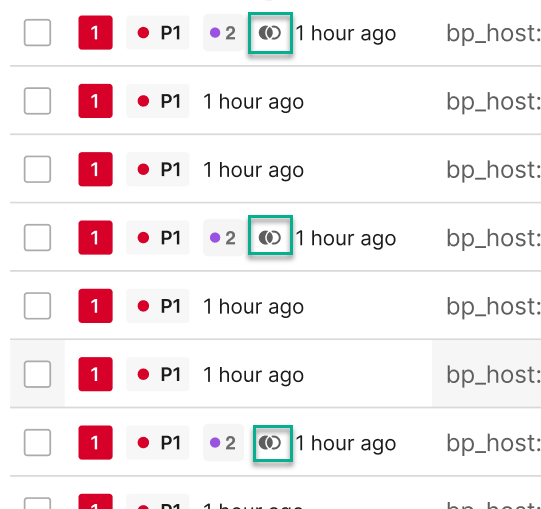
Flapping indicator in the Incident Feed
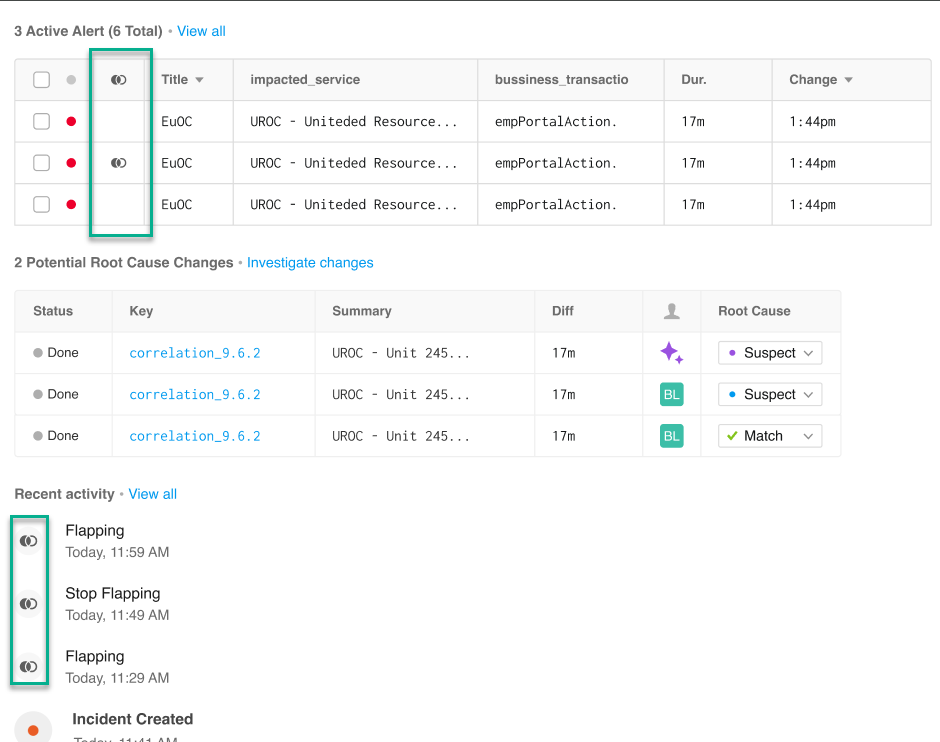
Flapping indicators in the Alerts table and Activity feed
Customize Your Incident View
You can now adjust the way you view incidents in BigPanda to better streamline your workflow and keep your focus on important incidents.

View Customization Options
Console settings are user-specific and will remain selected across BigPanda active sessions. After making view configuration changes, your selected view will apply each time you log back into BigPanda. Clearing your browser cache will clear your view selections.
Light/Dark Themes
To make parsing the complex data of incidents easier, you can choose a dark or light viewing theme. Dark theme uses brightness reduction colors to ease eye strain, while Light theme uses traditional contrast.
To change your view theme, navigate to the top right of the console and click Theme to choose between light or dark themes.
The incident console’s default is the light theme, but once you’ve changed the setting, BigPanda will remember your selection.
Custom Pane Layouts
You can customize how incidents appear on the screen by choosing a list, split, or table pane layout.
When the List layout is selected, the details pane appears to the right of the feed. The Split layout places the details pane below the incident feed. The table layout displays the incident feed without the details pane.
The default view is List, but once you’ve changed the setting, BigPanda will remember your selection.
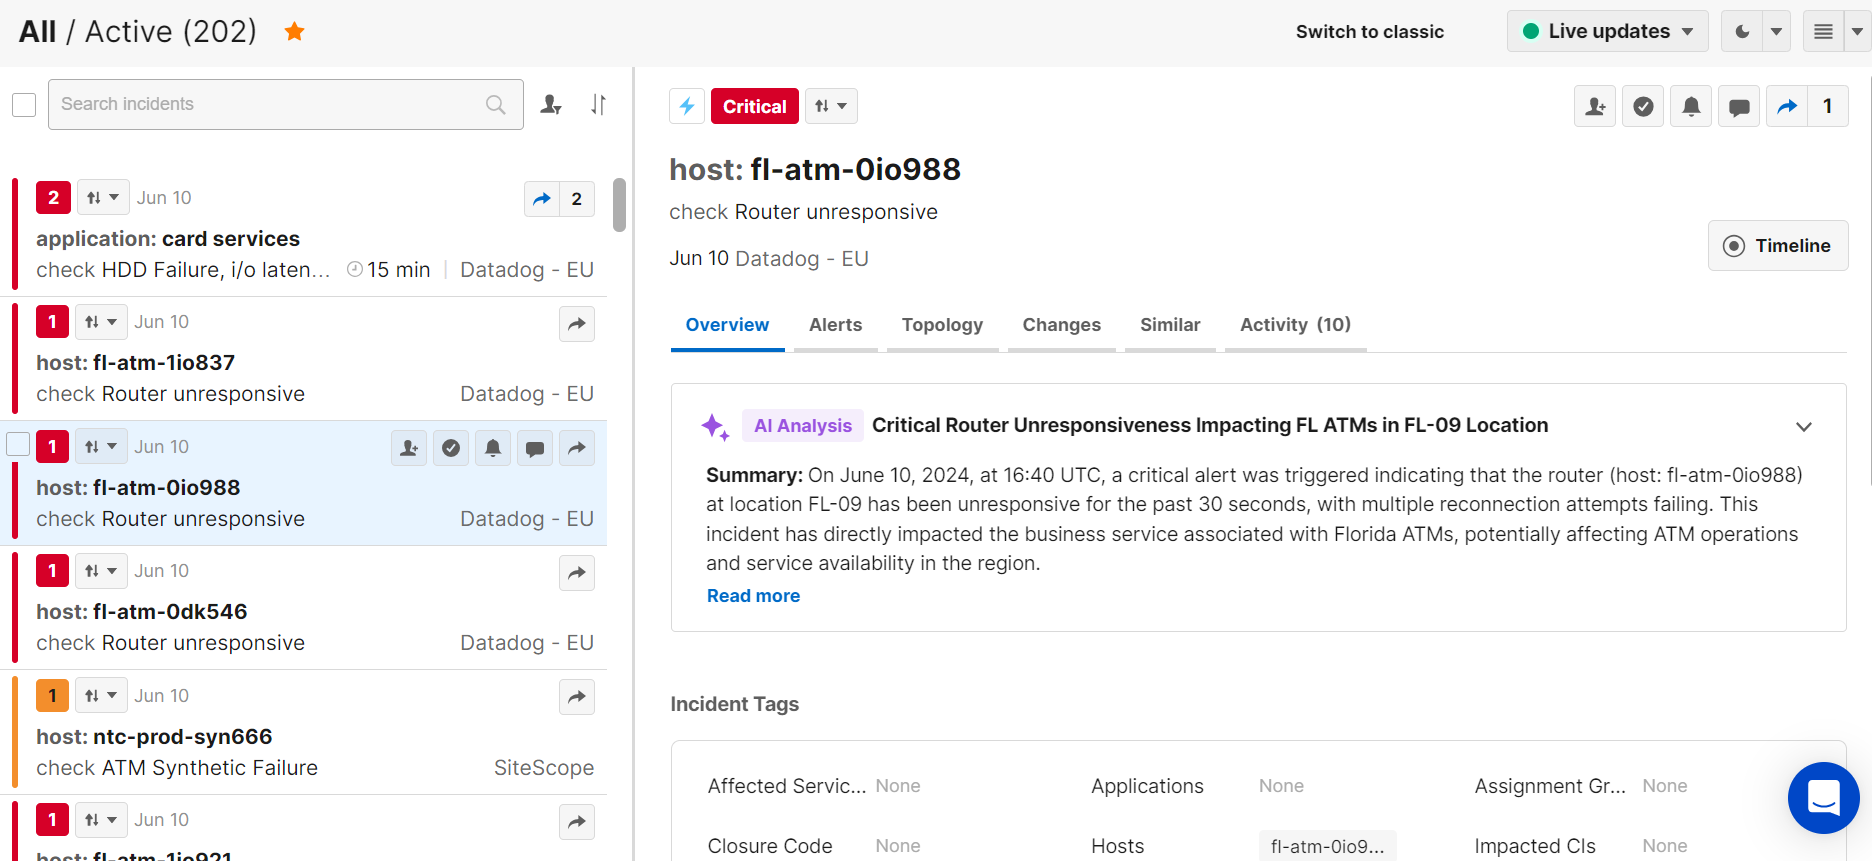
List Pane
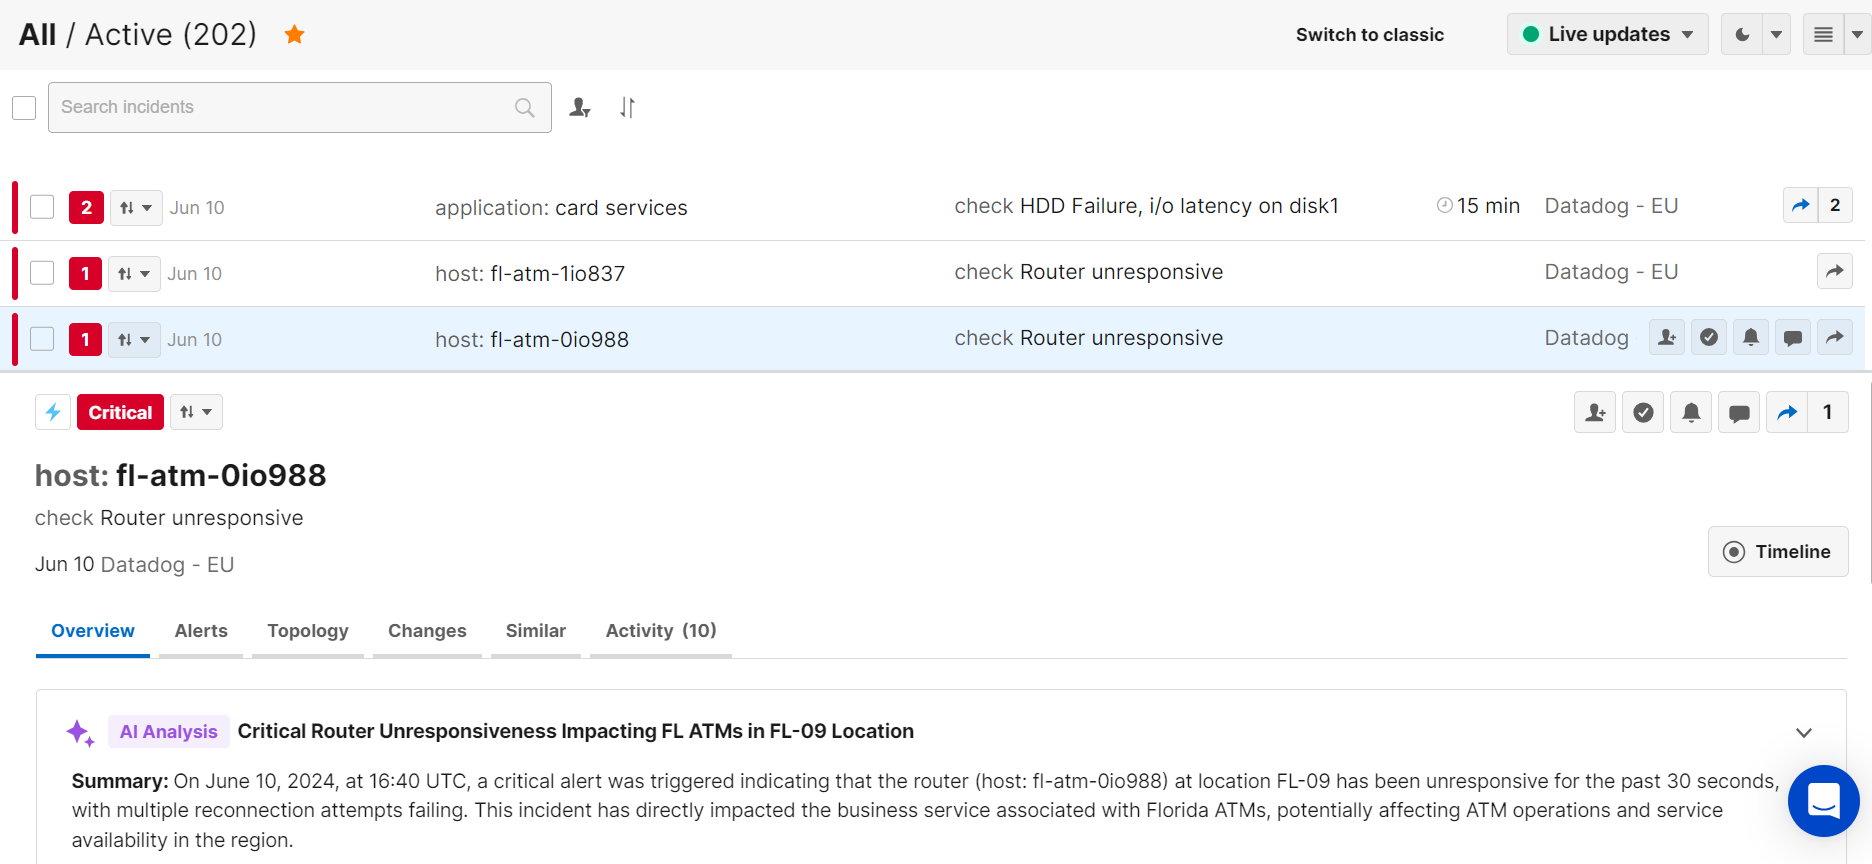
Split Pane
When the Table view is selected, the incident feed view appears without the details pane by default.
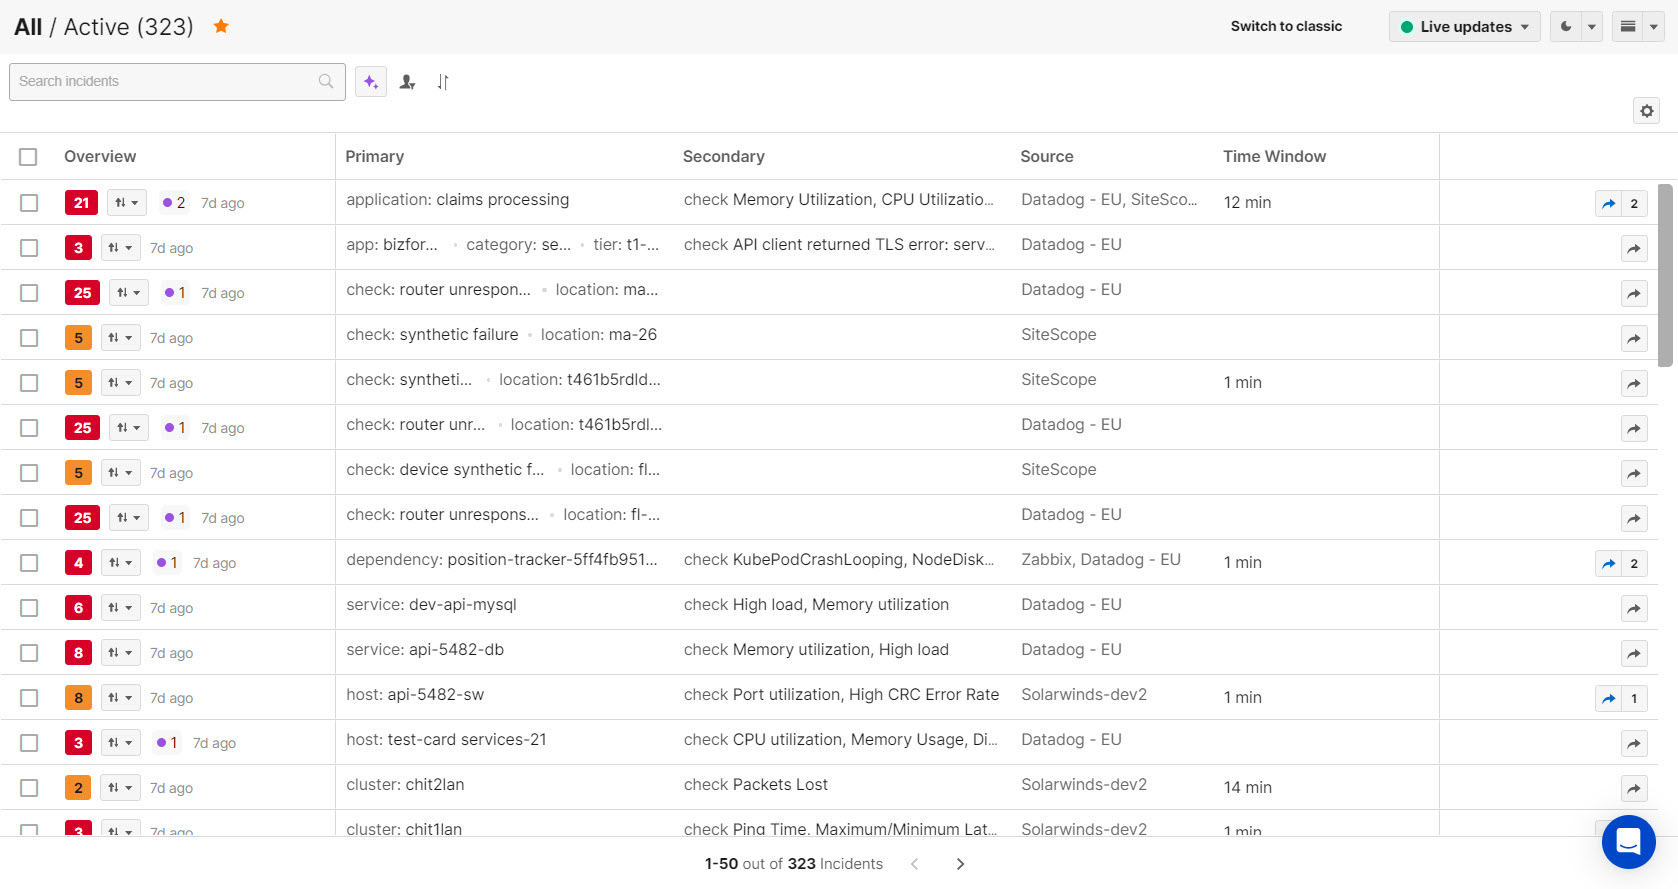
Table Option
To activate this view, click the layout button on the top right side of the console and select Table. When this layout is selected, the incident feed ribbon will fill the entire incident console. You can drag the edges of each column to adjust the size.
To view incident details, click an incident in the feed and the details will appear in a flyout pane on the right.
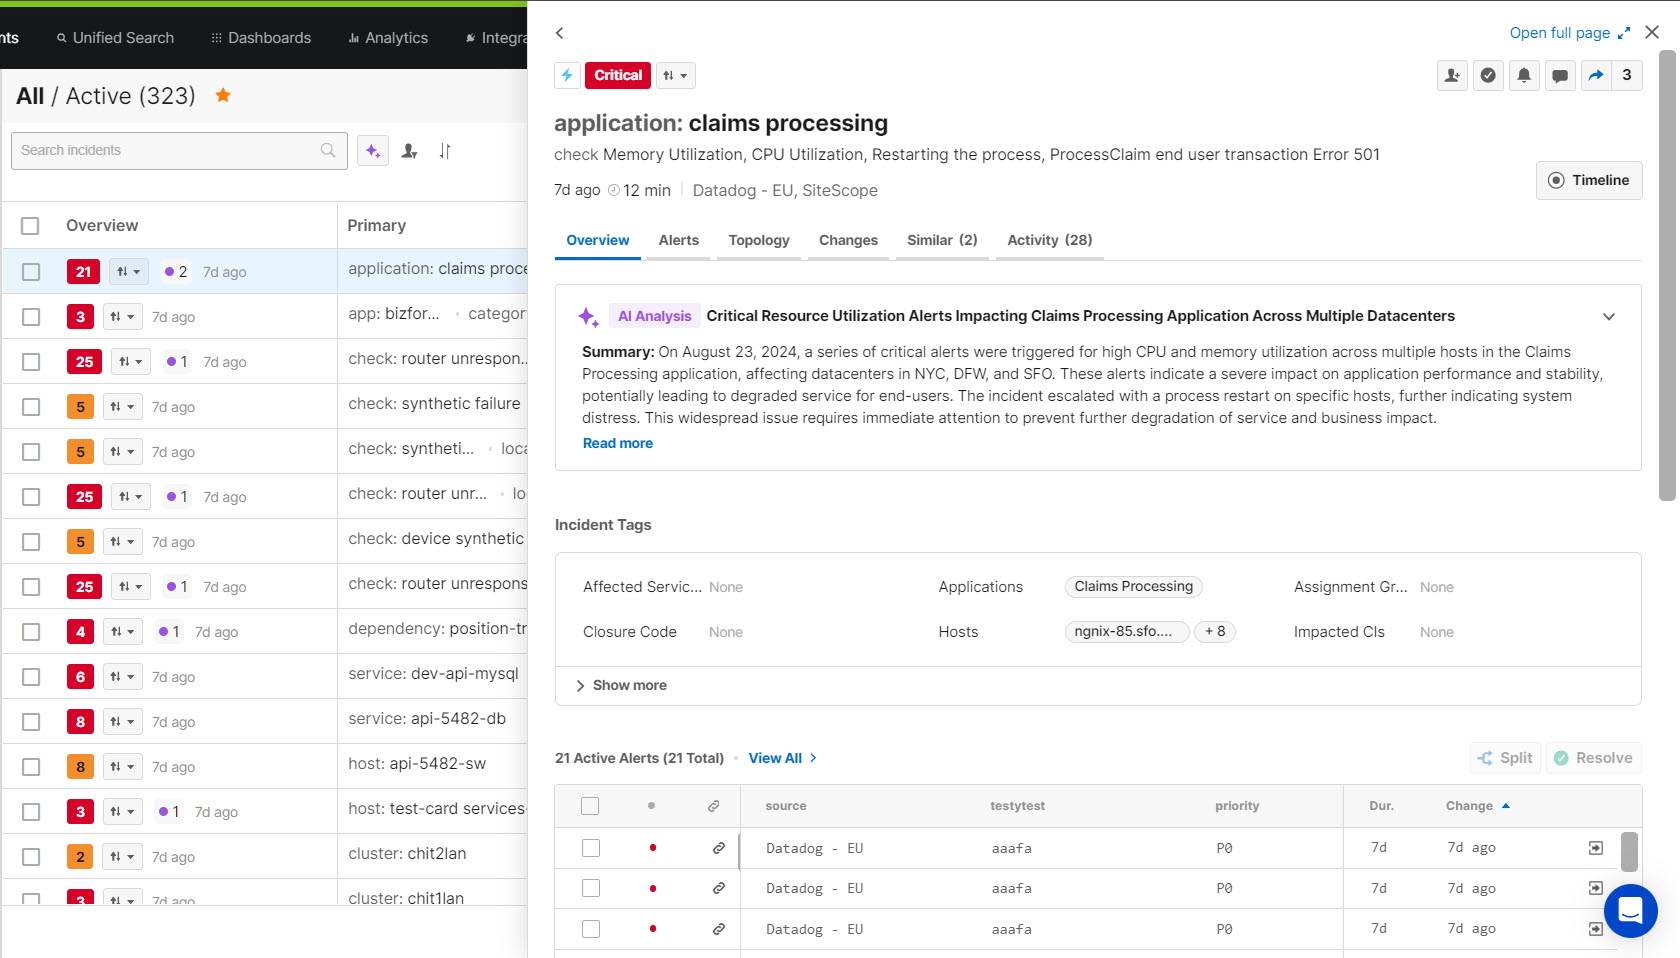
Details Pane
Incident feed view customization
With Incident Feed Views, you can customize the tags that appear when the Table layout is selected so that the information most relevant to you is always available at a glance.
Incident Feed Views are based on environments, so you can create separate views for different teams working in BigPanda. All users who have access to an environment will see the same customized table view.
See the Manage Incident Feed Views documentation for more information.
Resize Incident Panes and Environment Navigation
You can resize each pane in the Incidents Tab to your liking. To resize a pane, hover your cursor over the pane edge until it changes to a double sided arrow. Click and drag the pane edge to the desired size.
You can collapse the Environments navigation bar completely. To hide the Environments navigation bar from view, hover your mouse over the Environments pane until you see a blue arrow appear. Click the arrow, and the pane will disappear.
To restore the pane, hover your mouse at the far left side of the screen. When it appears, click the blue arrow.
Time Zone Customization
Limited Availability
Time Zone Customization is available in a limited release. If you are interested in enabling this functionality for your organization, contact your BigPanda account team.
You can adjust your time zone and date formatting within the BigPanda Personal Settings page. These settings only apply to your account.
When you hover over an incident or alert change time or date in the UI, a tooltip appears that displays the full date, time, and selected time zone.
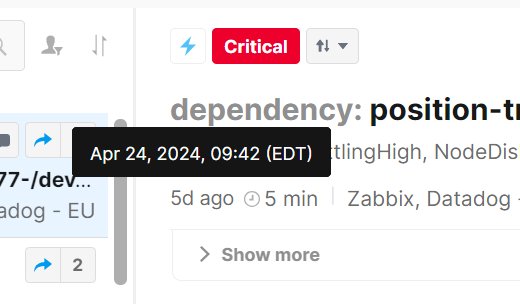
Time Zone Tooltip
Date and time customization
Date and time customization settings currently do not apply to the Audit Log and Unified Search screens.
See the Manage Your Account documentation for more information.
Sort Environments
You can sort the list of environments Alphabetically or by Creation date.
To sort the list, navigate to the upper right corner of the Environments pane and click the Sort button.
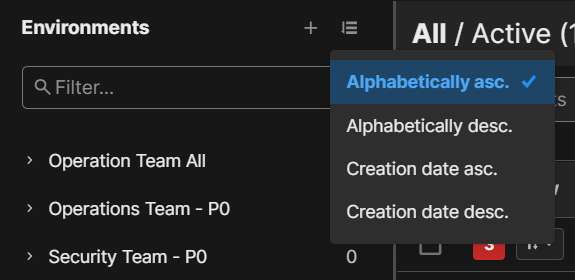
Sort Environments
Updated 8 days ago
