Alert Correlation Logic (ADR)
After merging events into alerts, BigPanda clusters highly-related alerts together into a single, high-level incident. Incidents drive noise suppression, improved visibility, and faster MTTR by identifying system issues that may be related.
For example, a connectivity problem may cause several checks on the same host to enter a critical state. Instead of viewing these checks separately, BigPanda clusters these alerts together so that you can see the full scope of an issue at a glance.
Correlation patterns set rules to define relationships between system elements, which are then used to dynamically cluster alerts into incidents.
Max correlation limit
BigPanda can correlate a maximum of 300 alerts into a single incident.
Tag processing limit
As an issue evolves, new tags or values may be added to an alert. Each alert can have up to 2000 tags. Once the limit is reached, additional tags will not be processed in the pipeline and downstream services.
Correlation Patterns
Correlation patterns define the relationships between alerts by using the following parameters:
Source Systems - the integrated monitoring systems for which the pattern applies. For example, show alerts that come from Nagios, Datadog, etc.
Tags - the properties that indicate when alerts are related. For example, correlate all alerts that come from the same cluster and have the same check.
Time window - The amount of time between when the alerts started. For example, network-related alerts may start within a short time from one another, while load issues may develop over a longer period of time.
Filter - (optional) The conditions that further refine which alerts this relationship applies to. For example, correlate only network-related alerts by data center.
The default correlation patterns are:
Correlating Tags | Time Window (minutes) | How it Works |
|---|---|---|
| 60 | Alerts from the same host are often related. Used by over 90% of BigPanda customers. |
| 30 | A sudden increase in alerts with a matching application and check may point to recurring or escalating issues. |
| 29 | Alerts from the same application may point to the root cause. |
| 25 | Service-level correlation provides wider coverage and can illustrate the impact of an issue downstream. |
Incident Title
If multiple correlation patterns match an incident, the pattern with the longest time window is the one that appears as the incident title.
Administrators are able to adjust correlation patterns to best fit the needs of your organization. The patterns you see in the correlation pattern window may be different.
Primary Alert Criteria
When multiple alerts are correlated into a single incident, a single alert is chosen as a primary alert. This alert is used in downstream automations and collaboration tools using Dynamic Variables, and it can be added as an incident tag. Every incident must have a primary alert.
Primary alert criteria is made up of selection criteria and filter conditions.
Selection criteria selects a single alert from all correlated alerts in the incident. Selection criteria will apply the first criteria, then the fallback. Only alerts that match all filter conditions will be selected as potential primary alerts.
For example: Latest start time AND Highest severity AND (filter)prod = test will first filter out any alerts that do not have the prod tag = test. Next, it will identify the alert with the latest start time. If there are multiple alerts with the same start time, it will then select the alert with the highest severity from that subset.
By default, the primary alert is the alert with the:
Highest severity
Earliest time correlated into the incident
Not in maintenance
Dynamic Clustering
The patterns in initial alerts may not always reflect the full scope of an ongoing issue. BigPanda continues to update and match correlation patterns even as the system issue evolves.
Matching patterns are evaluated in real time throughout the life of an incident. When a new alert is received, BigPanda evaluates it against any patterns for active incidents that are within the start time window. If the alert matches a pattern for an existing incident, it is added as a related alert, and any patterns that no longer match all of the related alerts are eliminated from the incident.
All active patterns can be viewed in the incident details.
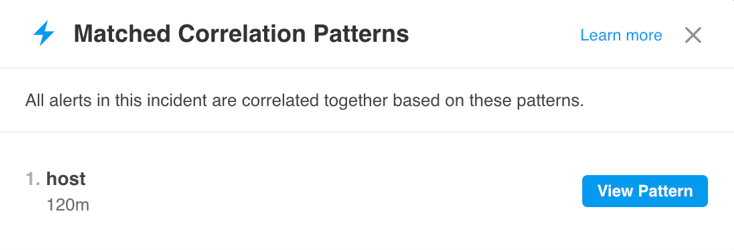
Matched Correlation Patterns List
If the alert doesn't match an existing incident, a new incident is created with that alert.
As new alerts are received, the process continues, and incidents become more well-defined. After the time windows of matching patterns have elapsed, no new alerts are added to the incident. The incident remains open based on the status of the alerts within it according to the Incident Life Cycle Logic.
Alert Correlation Steps
Once normalized and enriched, the alert begins the Alert Correlation process:
Check for Matching Alerts
First, BigPanda checks to see if the new event matches an existing alert in an incident. The system checks the event incident key to determine if the event is a match.
If the event properties match an alert in an active or recently resolved incident, the event is added to that incident as an alert.
If the new event status changes (For example, Warning to Critical), the tag values will be merged into the last event.
If it does not, the next check is performed.
Check for Matching Correlation Patterns
BigPanda checks to see if the event matches any active correlation patterns. If the event matches, it is added as an alert to an existing incident. By default, if more than one correlation pattern matches, the pattern with the largest correlation window is selected. The incident’s active correlation patterns are updated to include only patterns that apply to all active alerts.
If the event does not match an active correlation pattern, a new incident is created.
The order in which correlation patterns are matched can be adjusted in the Alert Correlation settings.
Correlation Patterns Are Updated
The incident’s active correlation pattern matches are updated to include only the patterns that apply to all active alerts. Any of the incident’s pattern matches that are no longer in the correlation window are deactivated.
Partial Match
It’s possible for an alert to be added to an incident even if it does not match some of the active matched patterns. When this happens, the patterns that do not match are deactivated. Deactivated patterns remain attached to the incident, but alerts are no longer correlated into the incident based on these matches.
The Incident Title is Updated
The incident title is updated based on the active matched pattern with the largest correlation window.
If the incident has only one alert, the title is generated based on the primary and secondary properties of the active alert.
If the incident has multiple active alerts, the title is generated based on the correlation tags of the pattern with the largest correlation window.
Incident titles can change as alerts join the incident and change status.
The Incident Status is Updated
The incident status is updated based on the status of the most severe active entity.
Incident Titles
Incident titles give you insight into the scope and impact of an incident. The titles are dynamically generated based on how the alerts are correlated and how many subjects are affected.
 |
Incident title
Descriptive incident titles provide insight into:
Incident impact: What part of the infrastructure is affected by the incident. For example, see whether an entire cluster is down or just a single host.
Correlation logic: Why the alerts are grouped together, which can help you investigate the problem.
Related alerts: A summary of the individual alerts that the incident contains.
How it Works
Incident titles are generated based on the following logic:
Main title—shows why the alerts are correlated into an incident. For example, if an incident correlates all CPU alerts on the database cluster, the main title is:
cluster: **database** · check: **CPU**Subtitle—summarizes the subjects that are part of the incident. For example, if the incident is correlated by a cluster, the subtitle lists alerting hosts in the cluster. If the incident is correlated by host, the subtitle lists alerting checks. The subtitle includes the following elements:
_Counter—_number of unique subjects that are affected.
_Type—_type of subjects (ie:
hostorcheck)._Time period—_amount of time during which the alerts were first triggered.
_Examples—_list of unique subjects. The subtitle shows as many examples as can fit, depending on the screen size.
Title for multiple correlation pattern matches
If multiple correlation patterns match an incident, the pattern with the longest time window is the one that appears as the incident title.
Examples of Incident Title
Checks Correlated by Host
In the example incident below, the main title indicates that all alerts belong to the api12.nyc.acme.com host. The subtitle indicates that 4 checks are alerting on the host and all of the checks were triggered within 1 minute of each other. Also, the subtitle lists a few examples of the checks.
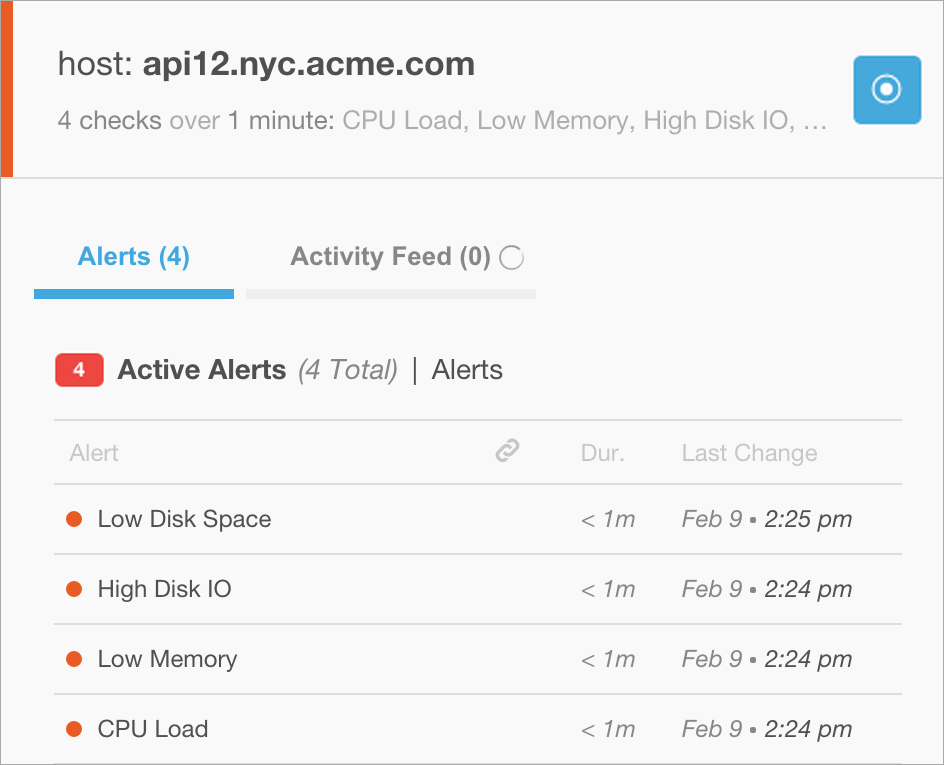 |
Correlated by Host example
Examples of Alert Correlation
Multi-Node MySQL Cluster Experiencing Loads
In the example, six different nodes in the same MySQL cluster began sending load-related alerts within 29 minutes of each other. Some of the nodes recovered momentarily before returning to a critical state, while others remained critical or in a warning state. BigPanda grouped more than 75 critical and recovery events into a single incident, and displays them together into a timeline that makes it easy to spot which alerts occurred first, and what nodes alerted later.
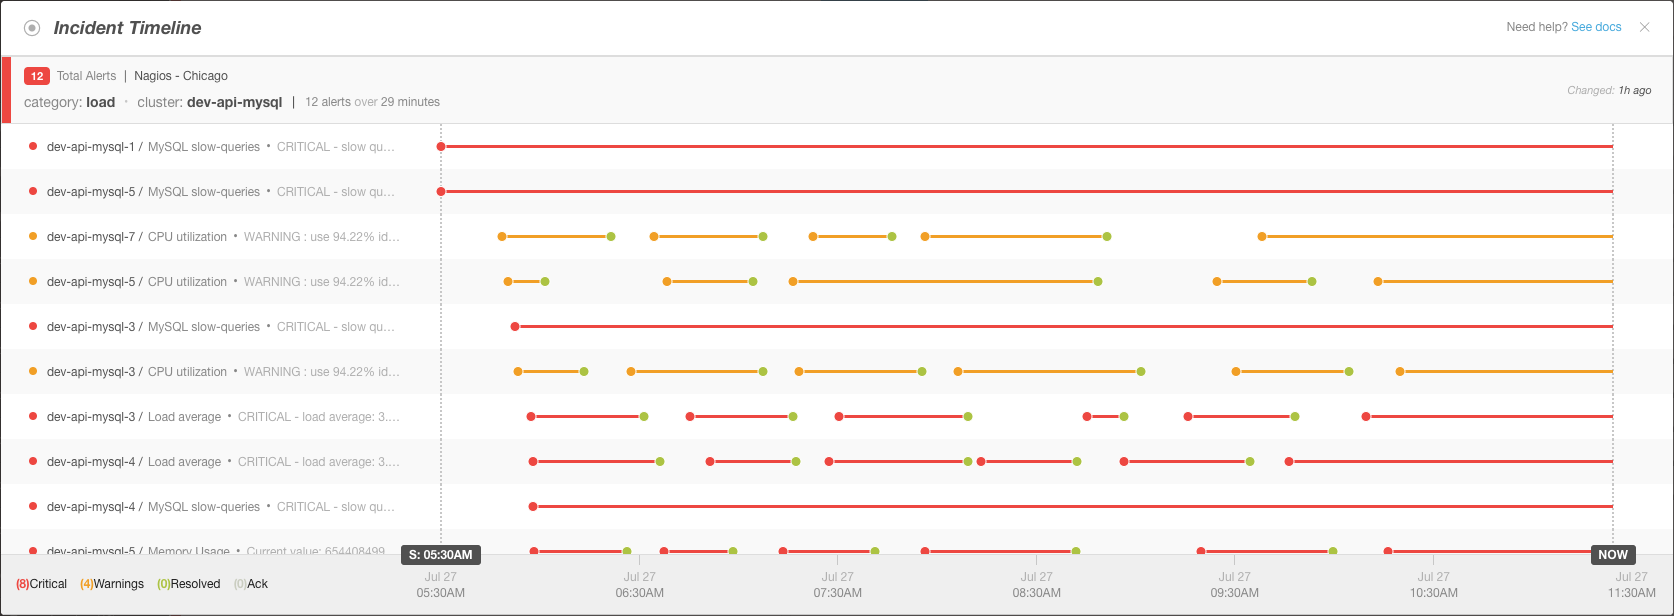 |
Multi-Node Correlation Timeline
Multiple Flapping Alerts For A Single Application
In this example, two different alerts came in for the same application. The alerts then proceeded to resolve and reopen in rapid succession. When an alert is changing states frequently, or flapping, it may generate numerous events that are not immediately actionable. BigPanda grouped each of these potential notifications into one ongoing incident to maximize visibility without overwhelming your team with duplicate notifications.
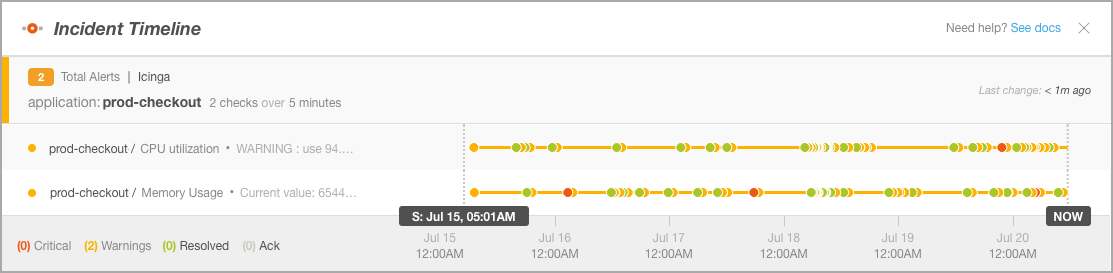 |
Flapping Incidents Timeline
To learn more about when incidents are resolved, reopened, or considered in a flapping state, see our Incident Life Cycle Logic documentation.
Next Steps
Learn more about Managing Alert Correlation
Dig more into Managing Incident Enrichment
Learn more about Incident Life Cycle Logic