Monitoring Sources
The Monitoring Sources Dashboard gives you a deep dive into how BigPanda is interacting with your monitoring tools including alert volumes, actionable alert percentages, and signal-to-noise ratio.
Dashboard duplication
This dashboard can be duplicated. See the Manage Unified Analytics documentation to learn how to create a new dashboard from a copy.
Key Features
Compare monitoring tools to highlight those with highest alert volumes
Identify tools that are sending a high number of unactionable alerts
Review which statuses are most commonly triggering alerts from each monitoring tool
Track signal-to-noise ratio trends over time
Widgets
The following widgets are available in the Monitoring Sources dashboard:
Alert count
Alerts are counted using the following calculation:
Count (Distinct Alert_ID)
Widget | Description |
|---|---|
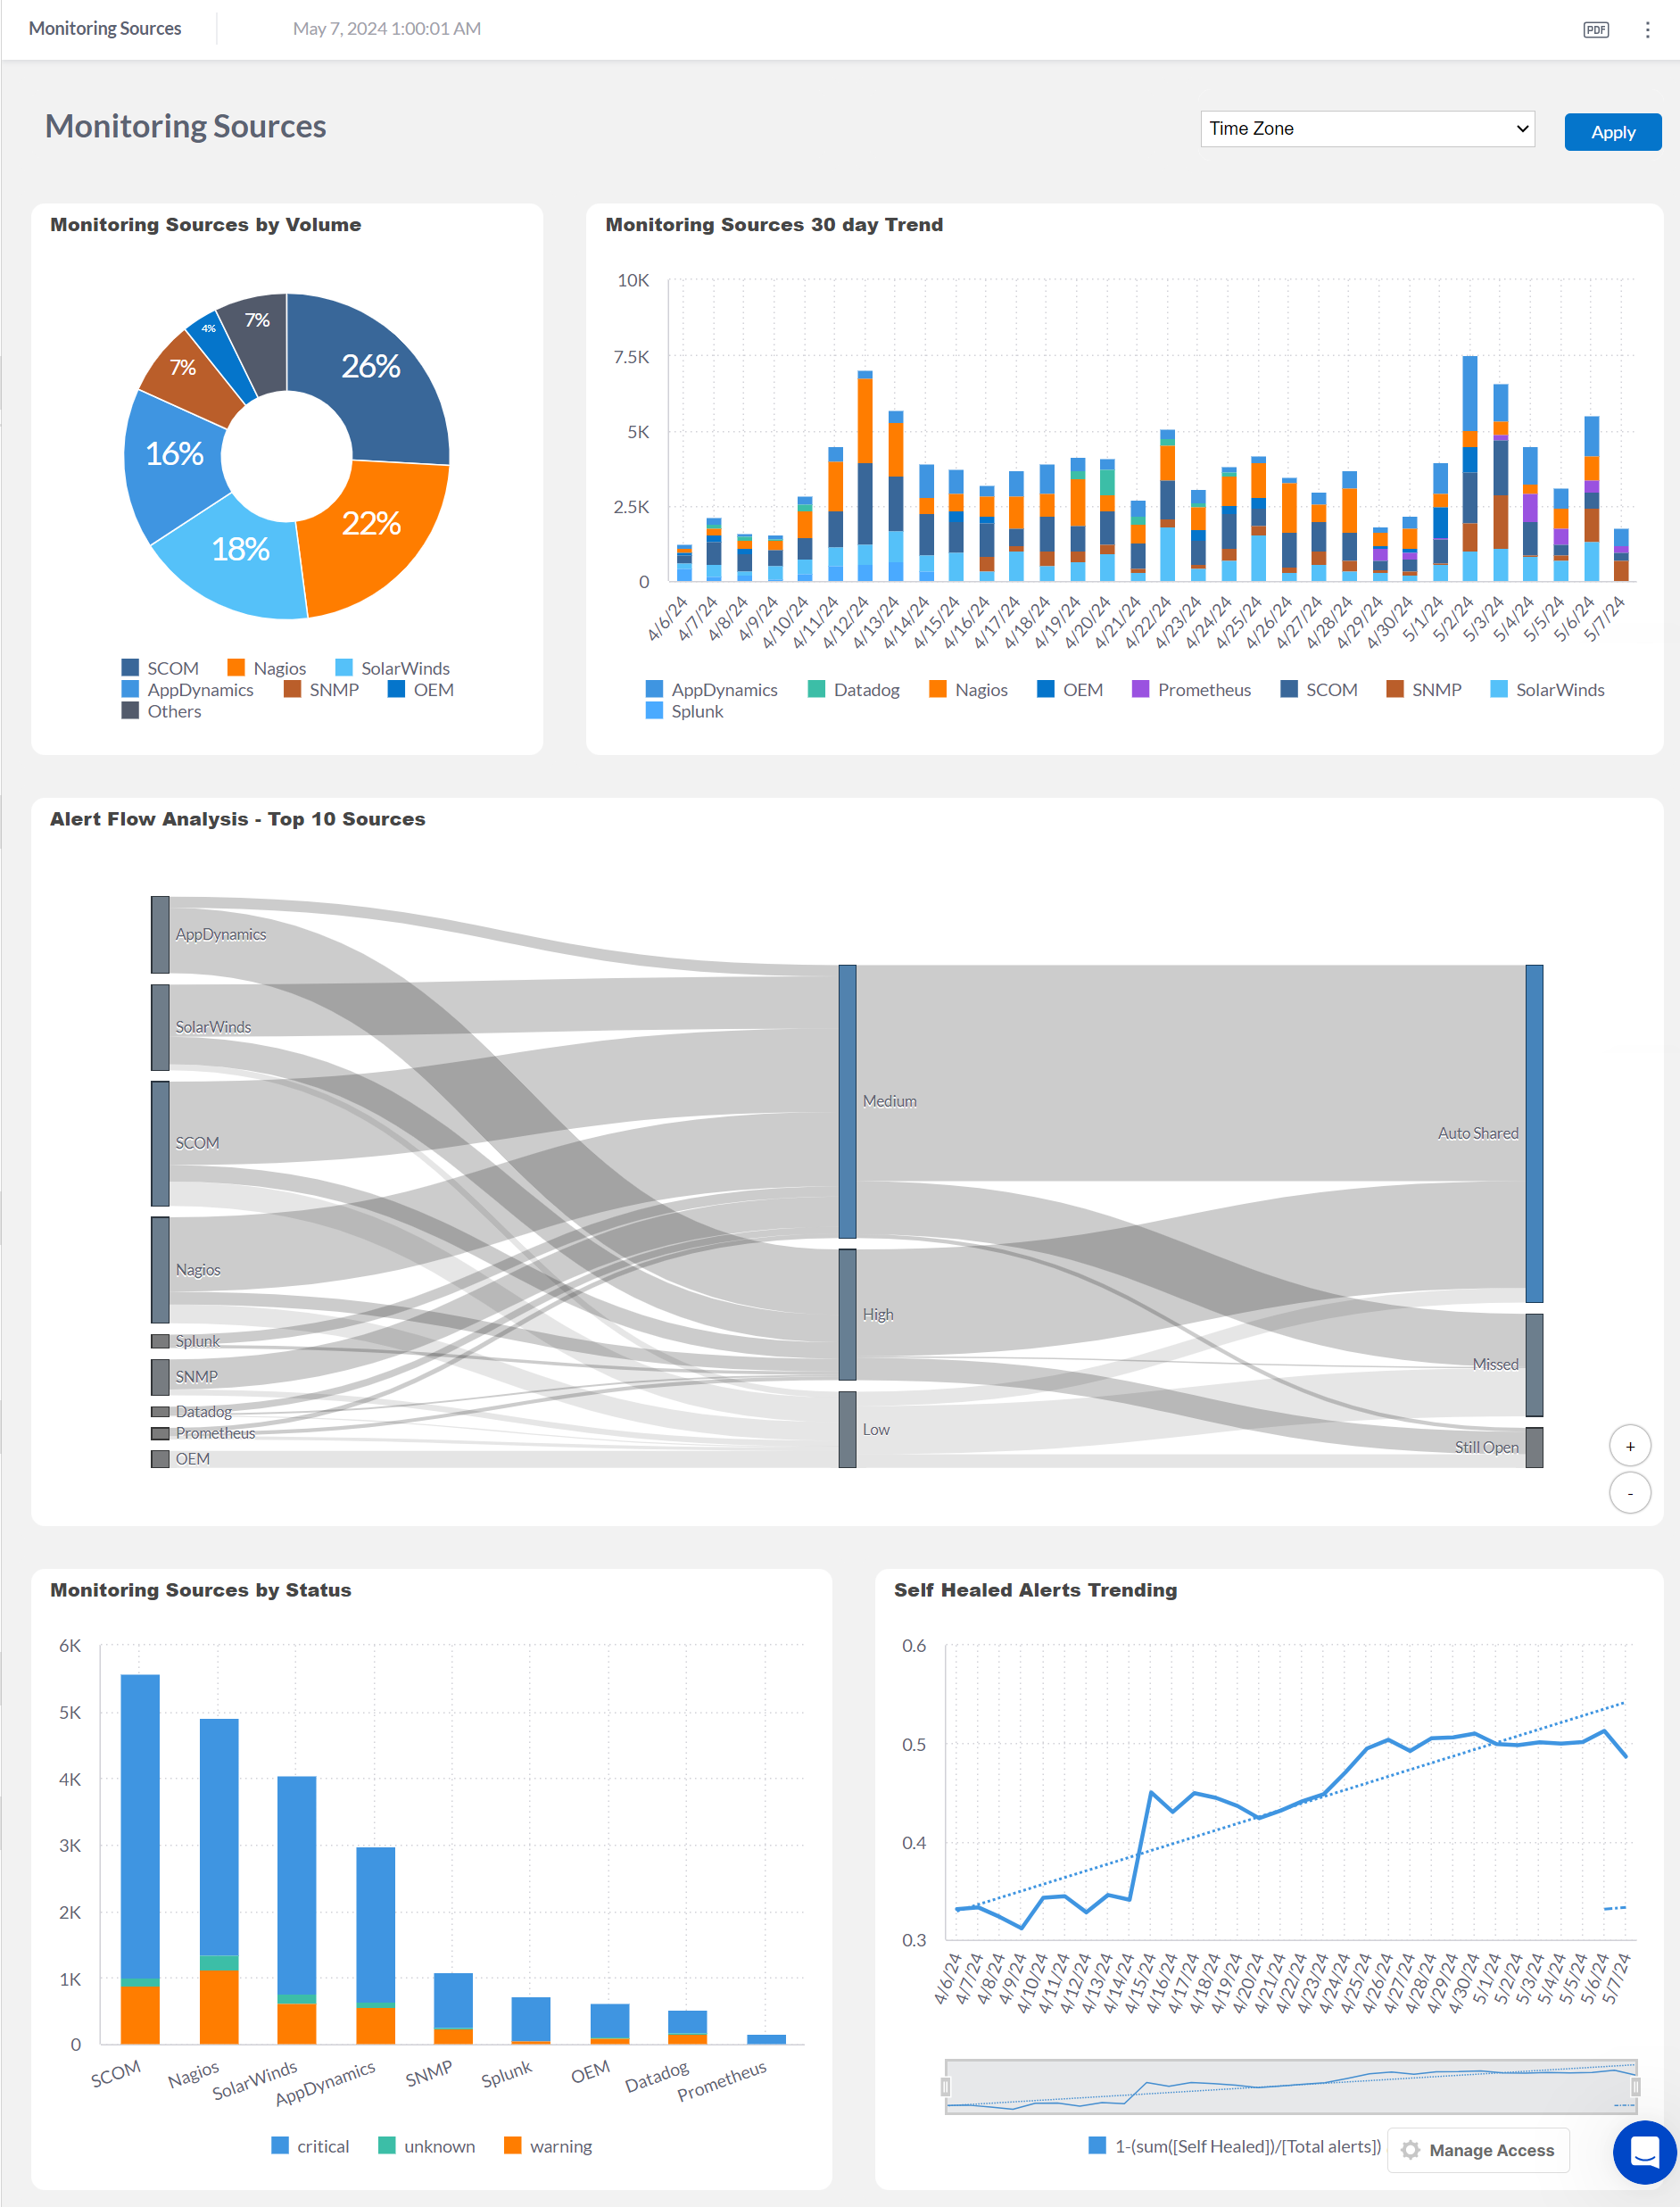
Monitoring Sources by Volume | The percentage of alerts sent by each inbound integration. |
Monitoring Sources 30 Day Trend | The number of Critical or Warning alerts sent by inbound integrations per week. |
Monitoring Tool Assessment | The flow of alerts from individual monitoring sources to their incident closure within BigPanda. Alerts are classified as either high, medium, or low quality based on the level of BigPanda enrichment for the alert. See Alert Quality for more information. |
Monitoring Sources by Status | The number of Critical and Warning alerts sent by each inbound integration. |
Self Healed Alerts Trending | The number of alerts that were resolved without operator action within BigPanda per week. The dotted line tracks the trend over the full reporting period. |
Next Steps
View Unified Analytics dashboards.
Learn how to Manage Unified Analytics.
Find definitions of Unified Analytics key metrics.
Dive into potential reporting fields in the Standard Data Model documentation.