MTTx Breakdown
The MTTx Breakdown Dashboard gives you visibility into trends and patterns in your organization’s incident detection, assignment, and resolution.
MTTx calculation
For information about how MTTx is calculated, see the Business Reporting Definitions documentation.
Key Features
Visualize trends in MTTx timing
Recognize areas for improvement in MTTX timing
Identify which applications experience the most downtime
Widgets
The following widgets are available in the MTTx Breakdown dashboard:
Widget | Description |
|---|---|
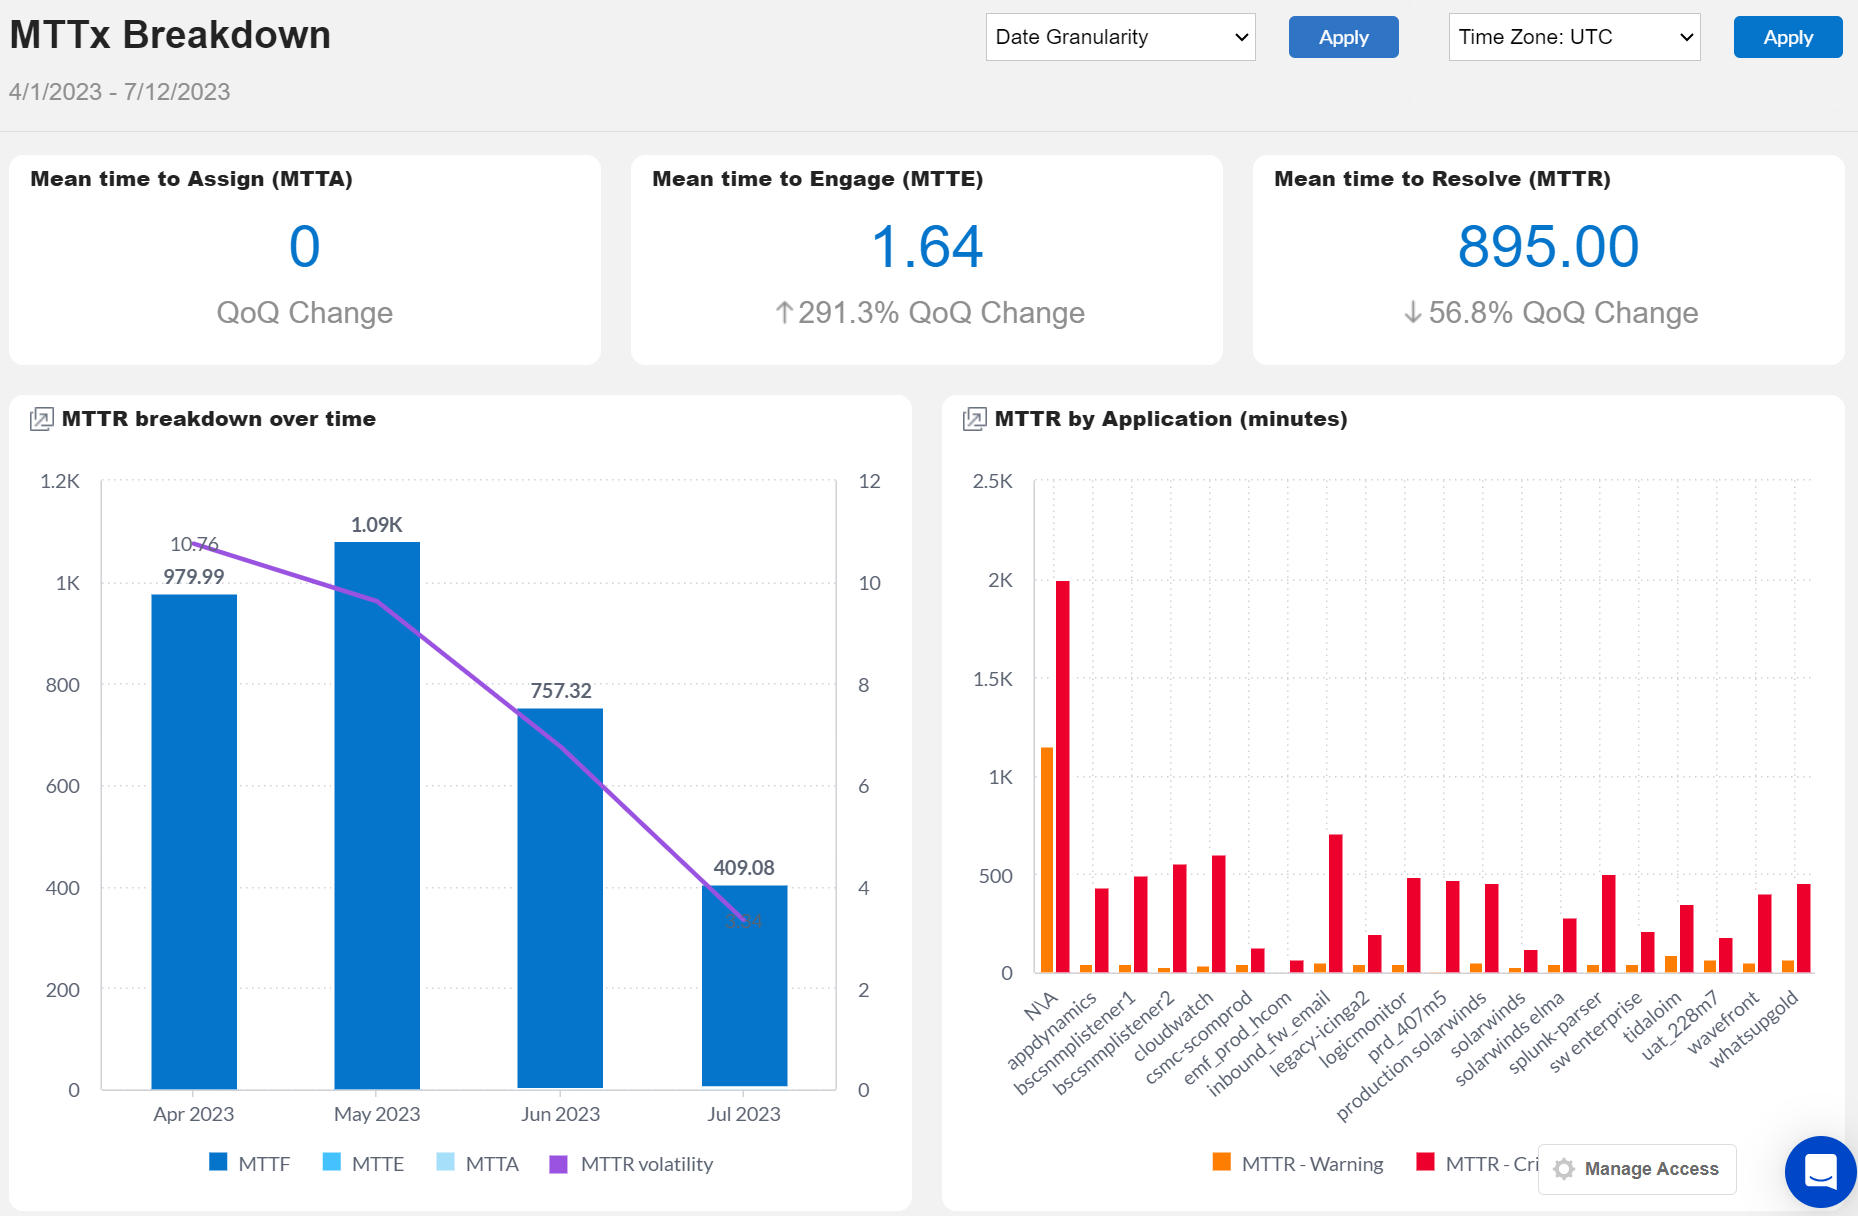
Mean Time to Assign (Min) | The average amount of time it took the IT Ops team to assign the incident. |
Mean Time to Engage (Min) | The average amount of time it took the IT Ops team to engage in resolving the incident. In BigPanda, this is measured by the time it takes to perform an action other than assign. |
BigPanda Mean to Resolve (Min) | The average amount of time it took to get back to service. MTTR looks at the repair of alert symptoms as opposed to the complete resolution of the incident. The BigPanda MTTR calculation is AVG([Time to resolve (mins)]) WHERE IS_ACTIONED = TRUE The calculation for this widget is IF (isNull([BigPanda MTTR]), 0, [BigPanda MTTR]) |
BigPanda MTTR Breakdown Over Time | MTTx values per week. The trendline tracks the MTTR Volatility over time. The calculation for MTTR volatility is [BigPanda MTTR] / median(([incident_id],[is_actioned],) [Min time to resolve (mins)]) |
BigPanda MTTR by Application (minutes) | The MTTR for alerts with a Critical and Warning severity broken out by source integration. The calculation for warning alerts is ([BigPanda MTTR], [incident highest severity]) The calculation for critical alerts is ([BigPanda MTTR], [incident highest severity]) |
Next Steps
View Unified Analytics dashboards.
Learn how to Manage Unified Analytics.
Find definitions of Unified Analytics key metrics.
Dive into potential reporting fields in the Standard Data Model documentation.