Executive Summary
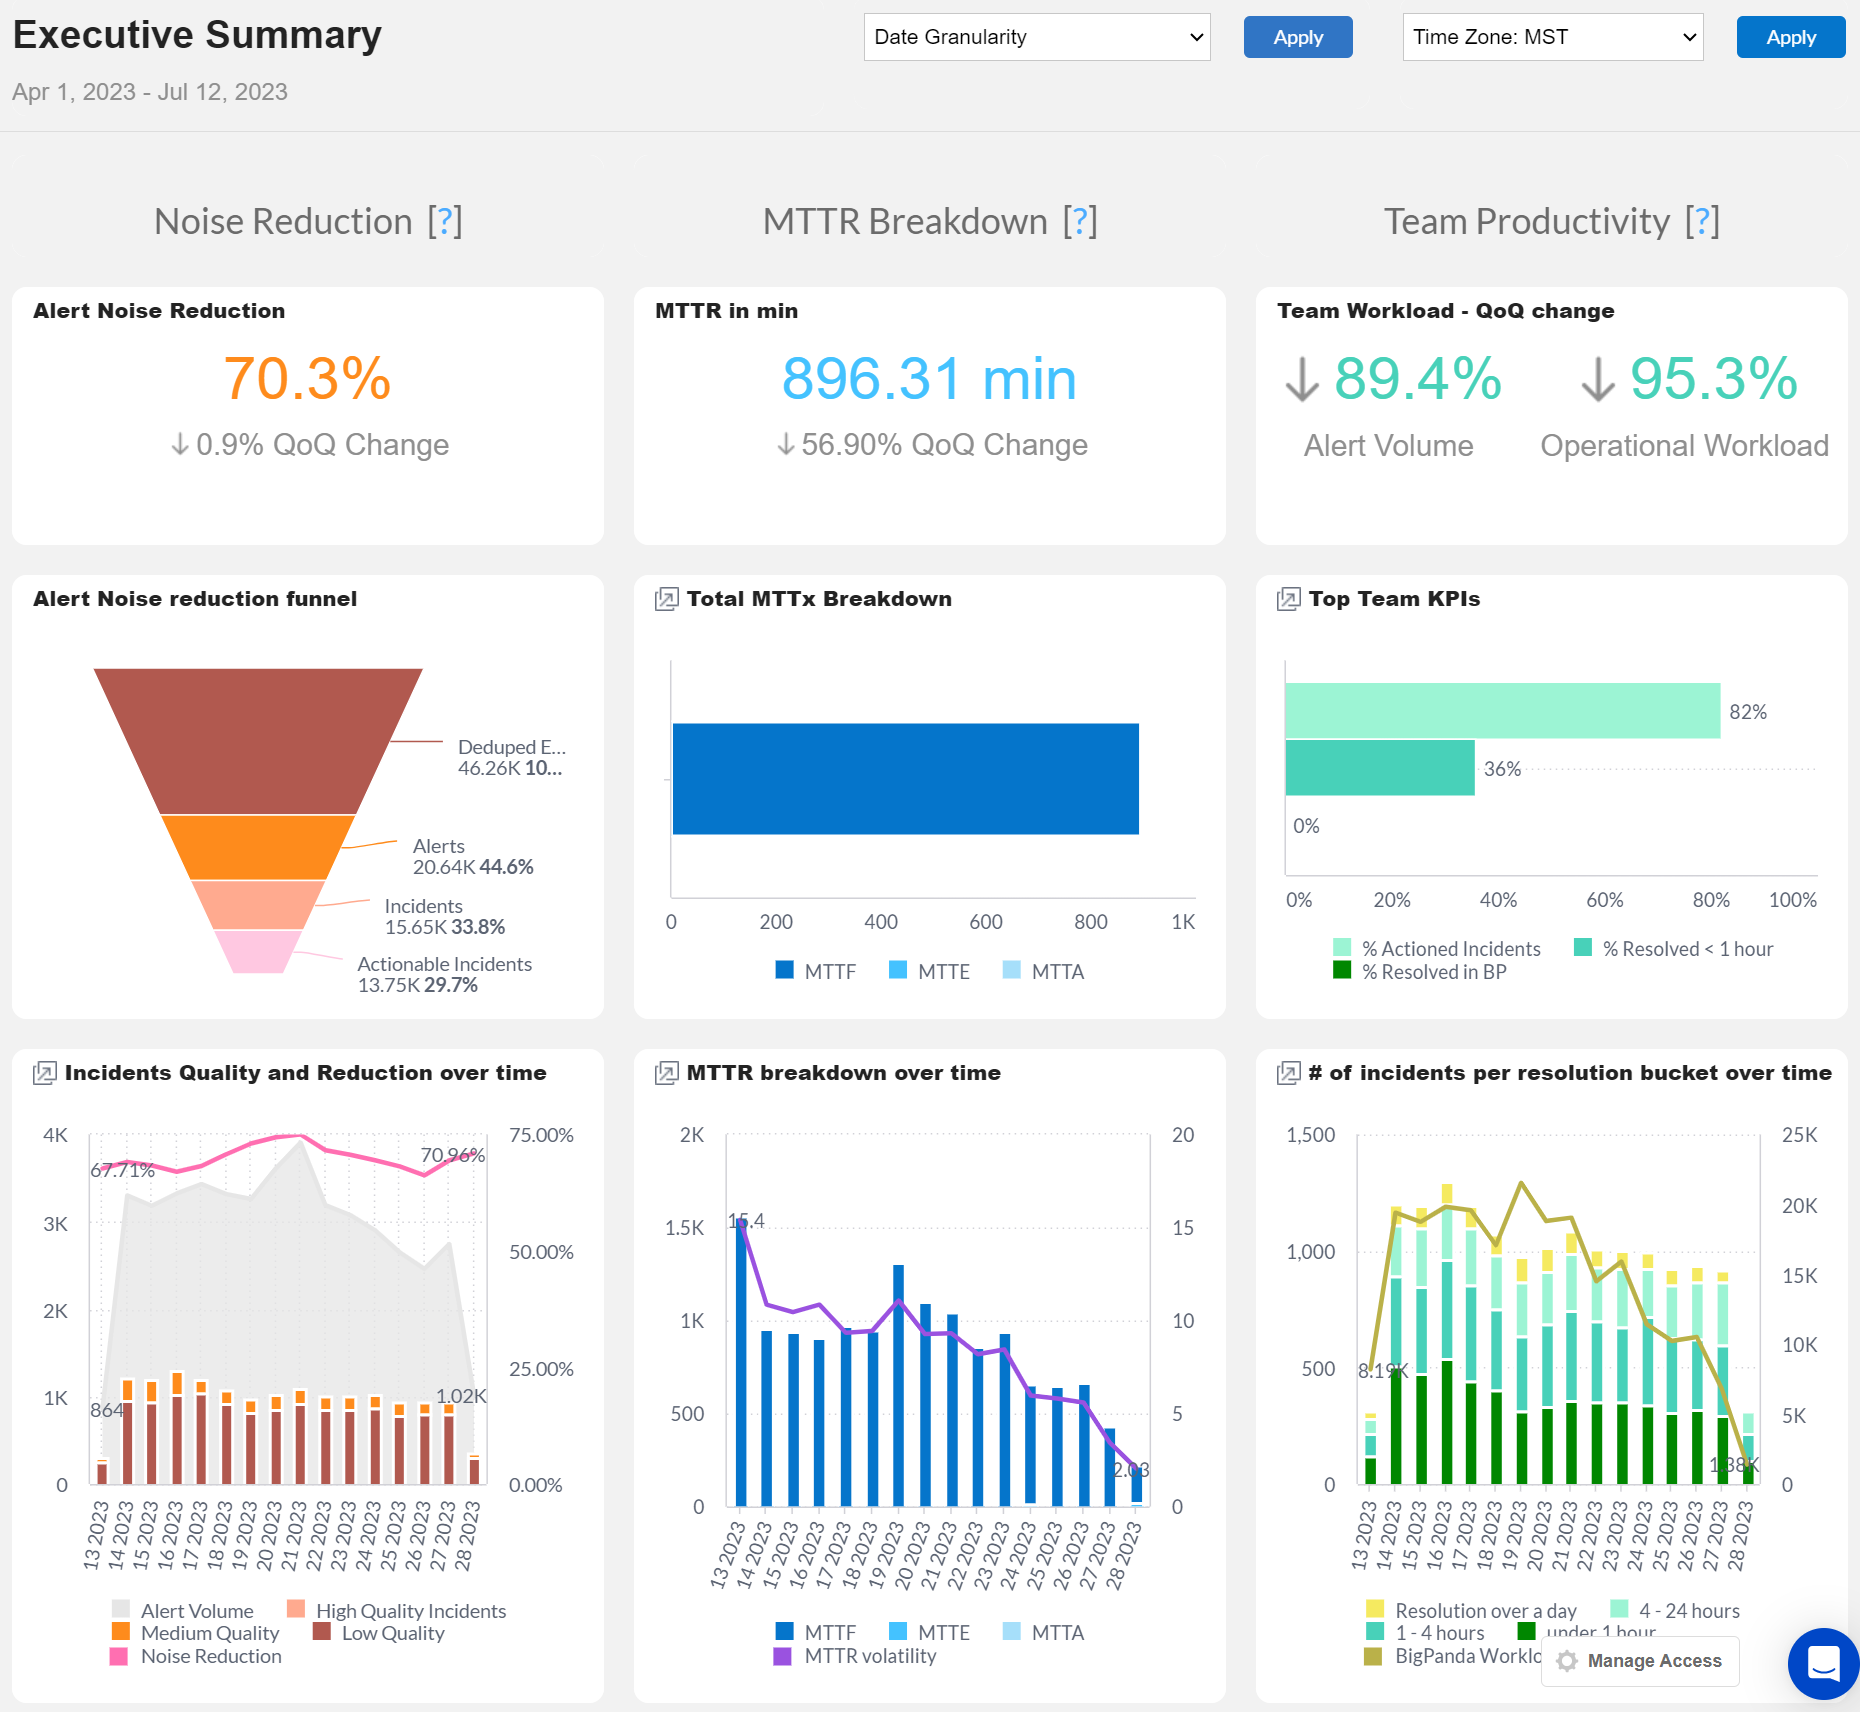
The Executive Summary Dashboard offers a comprehensive overview of the metrics vital for IT Ops planning and management including compression trending, alert volumes, and MTTx.

Dashboard duplication
This dashboard can be duplicated. See the Manage Unified Analytics documentation to learn how to create a new dashboard from a copy.
Key Features
View a high-level recap of BigPanda incidents at an executive level
Gain insight into alert volume reduction through compression
Evaluate various MTTx to measure IT Operation’s health
Export as simple screenshots or display during presentations for easy visibility
Widgets
The Executive Summary dashboard provides a high-level overview of alert and compression metrics for leadership. The following categories of widgets are available within the dashboard.
Quarter-over-quarter (QoQ) comparison
The Alert Noise Reduction, MTTR in Min, and Team Workload - QoQ Change widgets each provide a quarter-over-quarter comparison. Quarter-over-quarter (QoQ) is the change from the last quarter in the selected timeframe to the one before it.
When a timeframe with multiple quarters is selected, the comparison will be from the last quarter in the timeframe to the one previous to it. When only one quarter is selected, the comparison will be between that quarter and the one before it.
Alert count
Alerts are counted using the following calculation:
Count (Distinct Alert_ID)
Noise Reduction
BigPanda Noise Reduction is defined by the amount of alerts that are prevented from reaching the end user. This process is done through alert aggregation, enrichment, incident correlation, and filtering.
Widget | Description |
|---|---|
Alert Noise Reduction | The percentage of duplicate and irrelevant alerts that BigPanda saved from reaching the end user. The process is done through alert aggregation, incident correlation, and filtering. The following calculation is used: 1 - (Actioned incidents / Count(Event_ID)) |
Alert Noise Reduction Funnel | The funnel showcases the workload automation BigPanda brings in alert processing from deduplication down to actionable incidents. This illustrates the main stages an alert will go through and provides the visualization needed to have meaningful conversations about the different phases. The event count is Count(Distinct Event_ID). The alert count is Count(Distinct Alert_ID). |
Alert Quality and Reduction Over Time | Displays the alert payload quality over time. The shaded area shows the total incidents after correlation. The line shows the Noise Reduction percentage over time. |
MTTR Breakdown
MTTR Breakdown is used to measure incident management performance using the BigPanda event data. Many teams use MTTR as the main KPI and then break it down to its different components for more granular reporting.
Actioned incidents
Only incidents where the is_actioned field is true are included in the MTTR metrics.
Widget | Description |
|---|---|
MTTR in Min | The average MTTR in minutes and the MTTR percent decreased QoQ. |
Total MTTx Breakdown | The breakdown of total MTTx. Allows managers to see where time is allocated and if there might be problems in their incident management process. |
MTTR Breakdown Over Time | The MTTx over time and the volatility of the MTTR. Volatility is a measurement of the spread of the values of MTTx within a given data set. If the values are all relatively consistent, volatility is low. If MTTx values are inconsistent, the average may be unaffected, but volatility is high. |
Team Productivity
Team Productivity helps you understand the impact on Team workload and performance while using BigPanda. The two KPIs used are Alert Volume (amount of work) and Operational workload (time spent).
Widget | Description |
|---|---|
Team Workload - QoQ Change | The overall efficiency improvements across teams. Shows how alert volume and operational workload is changing over time. Alert volume - Displays the percent increase or decrease of alerts. Operational Workload - Measures the impact of BigPanda on overall team efficiency. Operational workload is calculated using (Incident Count * MTTR) |
Top Team KPIs | The three top level Team KPIs that indicate mature handling of incidents in BigPanda. KPIs: % Actioned Incidents - Percentage of Incidents that were handled by the team (as opposed to missed) % Resolved < 1 Hour - Percentage of Incidents that were resolved in less than an hour % Resolved in BP - Percentage of incidents that were resolved without Sharing to external targets |
# of Incidents Per Resolution Bucket Over Time | The number of incidents handled for each resolution bucket, over time. Allows managers to investigate why incidents may be taking longer than expected. Resolution buckets: Still Open Under 5 min 5 - 30 min 30 - 60 min 1 - 4 hours 4 - 24 hours 1 - 7 days Over a week The line charts the overall BigPanda Workload trend over time. |
Next Steps
View Unified Analytics dashboards.
Learn how to Manage Unified Analytics.
Find definitions of Unified Analytics key metrics.
Dive into potential reporting fields in the Standard Data Model documentation.