Manage Alert Enrichment
BigPanda ingests raw event data from integrated monitoring systems and normalizes them into key-value pairs called tags. Tags drive alert normalization and deduplication, correlation into incidents, incident enrichment, and automation.
In addition to the data sent in with raw events, you are also able to configure enrichment tags. These tags build on or interpret the raw data into more understandable, actionable tags for your team.
Enrichment tags can be as varied as your team. Common uses include:
Operational data to categorize, prioritize and remediate an incident (For example: tags named “owner,” “priority,” or “category”)
Topological information that provides context to the physical and logical elements of the alert (For example: tags named “cluster,” "data center,” or “city”).
Alert View Customization
By default, all alert tags are included in the alert details section of incidents, listed by run order. Which details appear in the UI can be configured by your BigPanda administrator. See Manage Alert Views for more information.
Audit Logs
When multiple users are working in the BigPanda platform, it’s vital to see historic information on system configuration changes. Audit logs are available for alert enrichment in BigPanda, allowing admins to keep track of configuration changes.
Users with the Audit Logs permission can view historical configuration changes and actions made related to alert enrichment. See the Use the Audit Log documentation for more information.
Relevant Permissions
Roles with the following permissions can access the Alert Enrichment page in BigPanda Settings:
Role Name | Description |
|---|---|
Alert Enrichment | View and use Alert Enrichments UI and API. |
Permission access levels can be adjusted by selecting either View or Full Access. To learn more about how BigPanda's permissions work, see the Roles Management documentation.
Alert Tag Enrichment Rules
Each alert tag is made up of one or more automatic enrichment rules.
Automatic Enrichment rules add the tag value based on raw event data. Alert tags without automatic enrichment will not apply values to incoming alerts. Unlike incident tags, alert tags cannot be manually edited by operators and will only appear on alerts that match the conditions for one or more automatic enrichment items.
Alert tags can be made up of multiple types of enrichment rules. A single tag may have one or more of any of the enrichment rule types:
Extraction: extract values from an existing tag to create new custom tags.
Composition: combine multiple values of existing tags to create one new custom tag.
Mapping: added automatically to the list of tag rules when a map includes a result tag value with the same name as a tag.
Extraction
Extraction rules allow you to pull metadata from existing values.
For example: A hostname is generally comprised of key pieces of information, such as service, node, cluster, datacenter, and domain. Each of these data points can be extracted into their own tag. To automatically add the value for a cluster tag based on incoming host data, you can extract the cluster data.
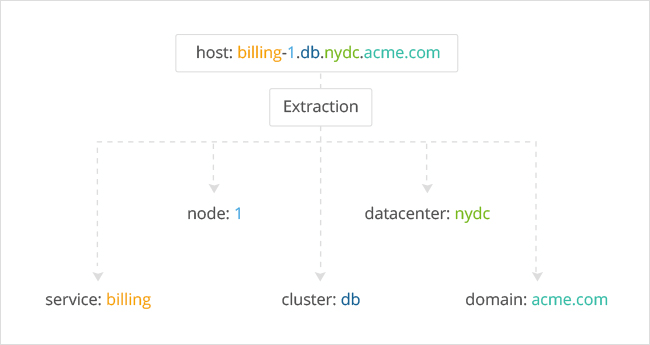 |
Tag Extraction Process
Extraction rules use regular extraction expressions (regex) to build value formulas.
Composition
Composition rules create new values by combining multiple values of existing data and/or additional information.
For example: To add a runbook URL for alert remediation you can combine the values of your base wiki URL, cluster tag value, and check tag value.
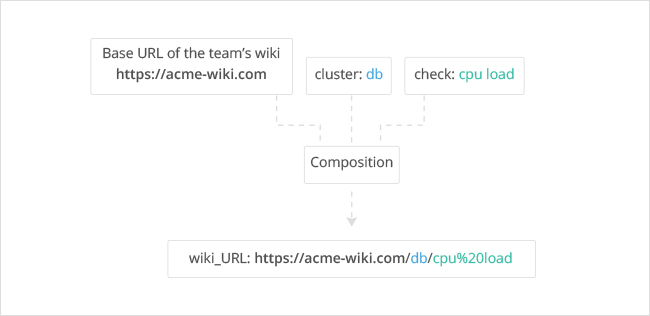 |
Tag Composition Process
Composition rules use the BigPanda Query Language (BPQL) to build value formulas.
Mapping Enrichment
Mapping enrichment enriches alerts with additional information about your organization by importing data from external data sources, such as a CMDB or team spreadsheet and adding that data to matching alerts.
For example: You can upload a data mapping table that lists application names, their associated owners, and runbook URLs. If any monitoring tool generates an event with a matching application name, the event is enriched with data about the associated owner and runbook URL.
Mapping enrichment automatically adds enrichment rules to related alert tags and automatically creates new alert tags. Only the run order of mapping enrichment items can be managed within the Alert Enrichment screen.
Best Practice: Update Mapping Enrichment
Regular updates for mapping enrichment ensures events are always enriched with up-to-date information. Work with your ServiceNow team to make sure your CMDBs are up to date and accurate.
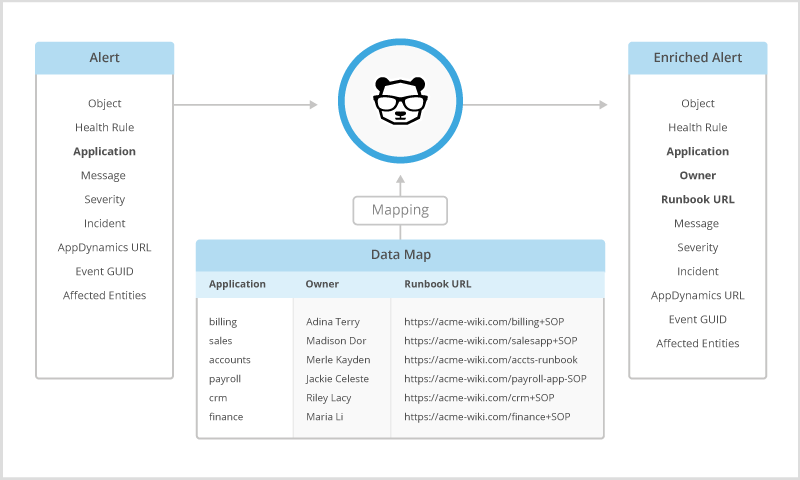 |
BigPanda Mapping Process
Mapping enrichment is managed per map. See the Enrichment Maps documentation on managing and maintaining enrichment maps.
Results tags
When viewing mapping enrichment, only result tags are listed in the alert enrichment tag list. Query or key tags are not listed.
Tag Order and Dependencies
Each tag is treated as a complete set, with all rules being run before moving on to the next tag. By default, alert enrichment tags run in the order they were created.
As enrichment rules rely on existing data, some tags are dependent on other tags. The tags that generate the data that enrichment rules build on must run in BigPanda before the dependent tags. For example: With an extraction tag named Service that uses regex where the source tag is Host, the Service tag is dependent on the Host tag and must follow Host in the listed run order.
Each tag will list their execution order on the list ribbon and in the tag details. Tag order can be rearranged in the Execution Order editor.
Within a tag, each enrichment item runs in order. Enrichment item order is based on the order it appears in the UI or API call.
Best Practice: Alert Tag Dependency
We recommend creating a dependency diagram as a visual to understand tag relationships before defining the tag order.
Mapping overrides
Mapping enrichment may be configured to override existing enrichment values. View override settings in the enrichment details pane. Read more about mapping overrides in the Enrichment Maps documentation.
Create an Alert Enrichment Tag
Tag Limitations
To maintain quality of service, BigPanda limits the number of alert tags and enrichment items available. Each organization can have:
1000 alert tags
500 enrichment items per alert tag
20,000 alert enrichment items total
200 mapping enrichment result tags per map
If more alert tags or enrichment items are needed, we recommend exploring normalization options to help streamline your alert data and improve incident quality.
Tags are created and managed in the Alert Enrichment setting screen.
Navigate to Settings > Alert Enrichment.
Click New Tag.
Give the tag a short, meaningful name. Tag names will appear in incident details and should give context for the tag value.
(Optional) Add a short description about the tag. Tag descriptions are visible to your teammates working on alert enrichment.
Add Automatic Enrichment items to automatically add a value for the tag based on raw event data. Alert tags without automatic enrichment will not apply values to incoming alerts. Unlike incident tags, alert tags cannot be manually edited by operators and will only appear on alerts that match the conditions for one or more automatic enrichment items.
(Optional) Toggle the Create as 'Inactive' option to save tag settings without having the tag apply to incoming alerts.
Click Create Tag to save the tag settings. Click Cancel to return to the previous screen without saving your changes.
Enrichment Preview
As you add automatic enrichment items to a tag the Preview pane will automatically populate with sample tags for alerts that match the condition. Click Preview for an item to refresh the preview data.
Tag Naming Requirements
Tag names must meet the following requirements:
Maximum length of 64 characters.
Start with a letter from a to z.
Contain only lowercase letters (a-z), numbers (0-9), and some special characters, including underscores ( _ ) and hyphens ( - ) and cannot contain spaces.
Tag Name Limitations
Some words are reserved and cannot be used as alert tag names in BigPanda. Tags with these names may be able to be saved, but will not enrich alerts. In addition, some tag names have limitations within broader functionality. See the Tag Naming documentation for details on tag name limitations.
Create an Automatic Enrichment Rule
Each tag is able to have multiple automatic enrichment rules. Each enrichment rule defines both a value formula, and when that value should be applied to incoming alerts.
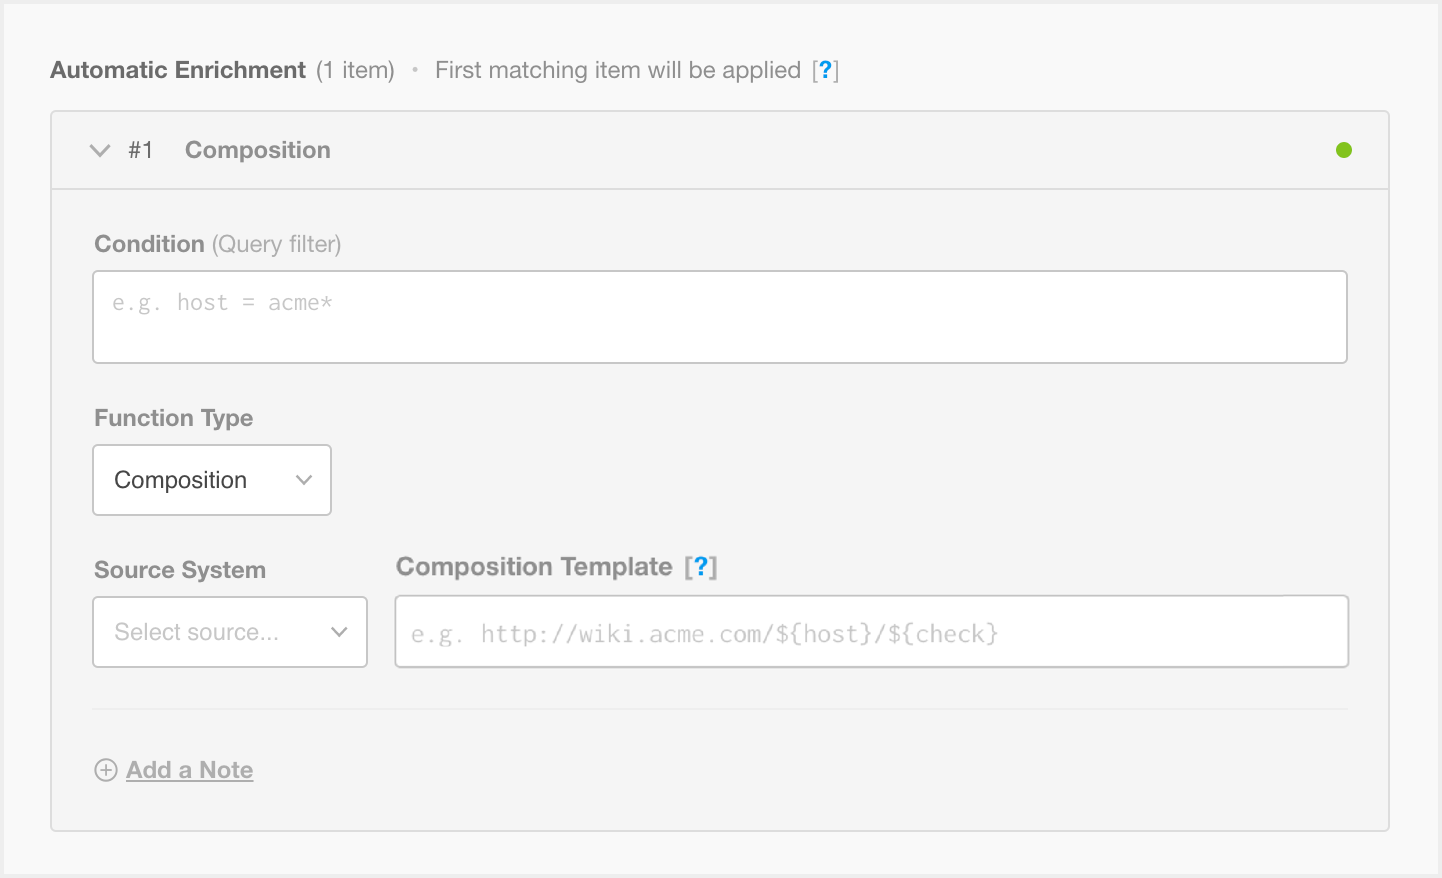 |
Automatic Enrichment Editor
Composition Enrichment
Parameter | Description |
|---|---|
Condition | Define a condition (query filter) to filter which alerts should contain the tag (e.g., |
Source System | Select a specific integrated monitoring system for which the tag applies. Select All Systems to apply this tag to events from all source systems. |
Composition Template | Provide the expression to create and combine data for building the tag value from other existing tag values. Use any tag value as a variable, in the format Special formatting is required for tag values that contain encoded characters for URLs. If the tag value contains encoded values for the characters |
Add a Note | (Optional) Add a short description about the enrichment. |
Additive Values
For composition rules that leverage multiple tag values, all referenced tags must have a value for the tag to be enriched. If the tag includes the formula ${host}/${check}, then the tag will only be enriched for alerts that have both a host and a check value.
Extraction Enrichment
Parameter | Description |
|---|---|
Condition | Define a condition (query filter) to filter which alerts should contain the tag (For example: |
Source System | Select a specific integrated monitoring system for which the tag applies. Select All Systems to apply this tag to alerts from all source systems. |
Source Tag | Select the alert tag where the value should be extracted. |
Extraction Regex | Provide the regular expression to extract the new tag value from the source tag value. - Extraction rules support the inclusion of the start (^) and end ($) characters in the formula. The formula will return partial matches by default and you must include the characters to perform an exact match. - Use parentheses to surround the capture group for the extraction. BigPanda uses the contents of the first capture group to create the value of the alert enrichment. - Use a non-capturing group to ignore part of the contents. If a matching pattern isn't found in the source tag, the alert is not enriched with the alert enrichment. |
Add a Note | (Optional) Add a short description about the enrichment. |
BPQL Limitations
Some tag names cannot be leveraged in BPQL conditions. See Tag Naming Functionality Limitations for a list of tags that cannot be leveraged.
Literal Pipes in Tag Array Values
Pipes: | are used in BigPanda as a delimiter for array values.
If the value should have a literal pipe, wrap the entire cell in three quotes: """this is a | literal pipe"""
If the value should have both a literal pipe and quotation marks, then the cell should be wrapped in three quotes, and the quoted text needs to be wrapped in four quotes: """this is a | literal pipe with """"quoted"""" text"""
Config object required
The config object is required when creating an enrichment item. When adding your array of enrichment items, make sure to expand the config object and include all required parameters.
Managing mapping enrichment
Mapping enrichment is configured and managed at the map level. See the Enrichment Maps documentation to learn how to create, manage, and maintain enrichment maps.
Enrichment Rules Run Order
When an alert tag has multiple enrichment rules, BigPanda uses the first matching rule in the enrichment tag. After finding the first match, the system does not run the remaining rules and moves to the next tag.
By default enrichment rules run in the order of their creation. You are able to rearrange the rules through a simple drag and drop.
To change the enrichment run order for an alert tag:
Navigate to Settings > Alert Enrichment.
Select the alert tag to modify.
Click the Pencil icon or Edit Alert Tag button to open the tag editor.
Click and hold the left edge of the rules and drag them into the desired order.
Click Update Tag to finalize the changes.
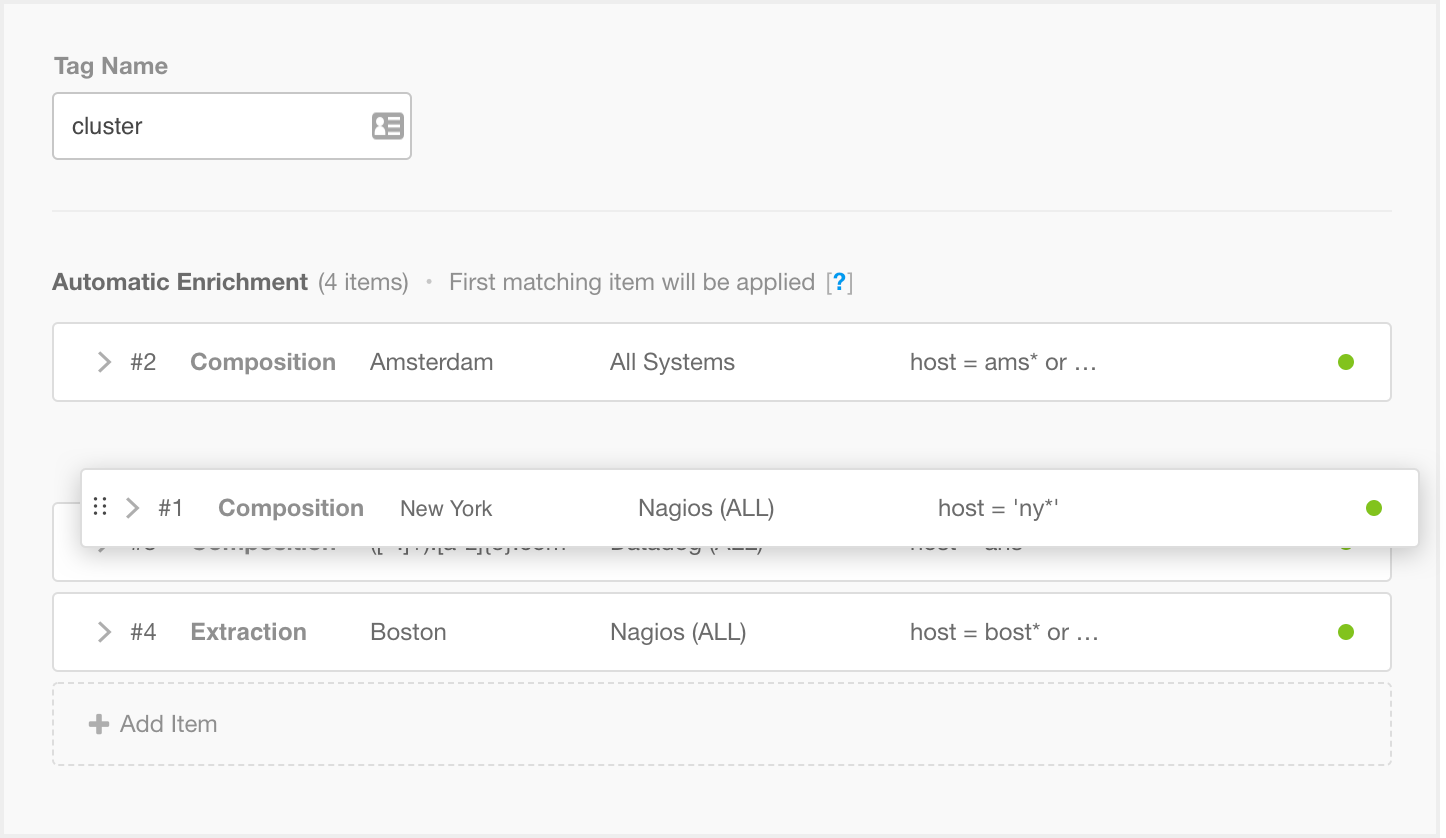 |
Modifying Tag Execution Order
Mapping Item Reordering
Any enrichment order changes will need to be adjusted when updating mapping enrichment.
To change the rules or content of mapping enrichment, the entire map must be reuploaded. If tags or enrichment items were reordered within the UI, they will lose the new order upon reupload as the tags will revert to the created-first rule. You can rearrange the order of columns in the table to fit the desired run order.
Preview Tag Results
With the complexity of modern ITOps, even small adjustments to enrichment logic can make big changes for managing incidents. To help you find the right enrichment patterns, the Alert Enrichment engine offers a Preview capability to help rapidly develop, test, and iterate enrichment logic.
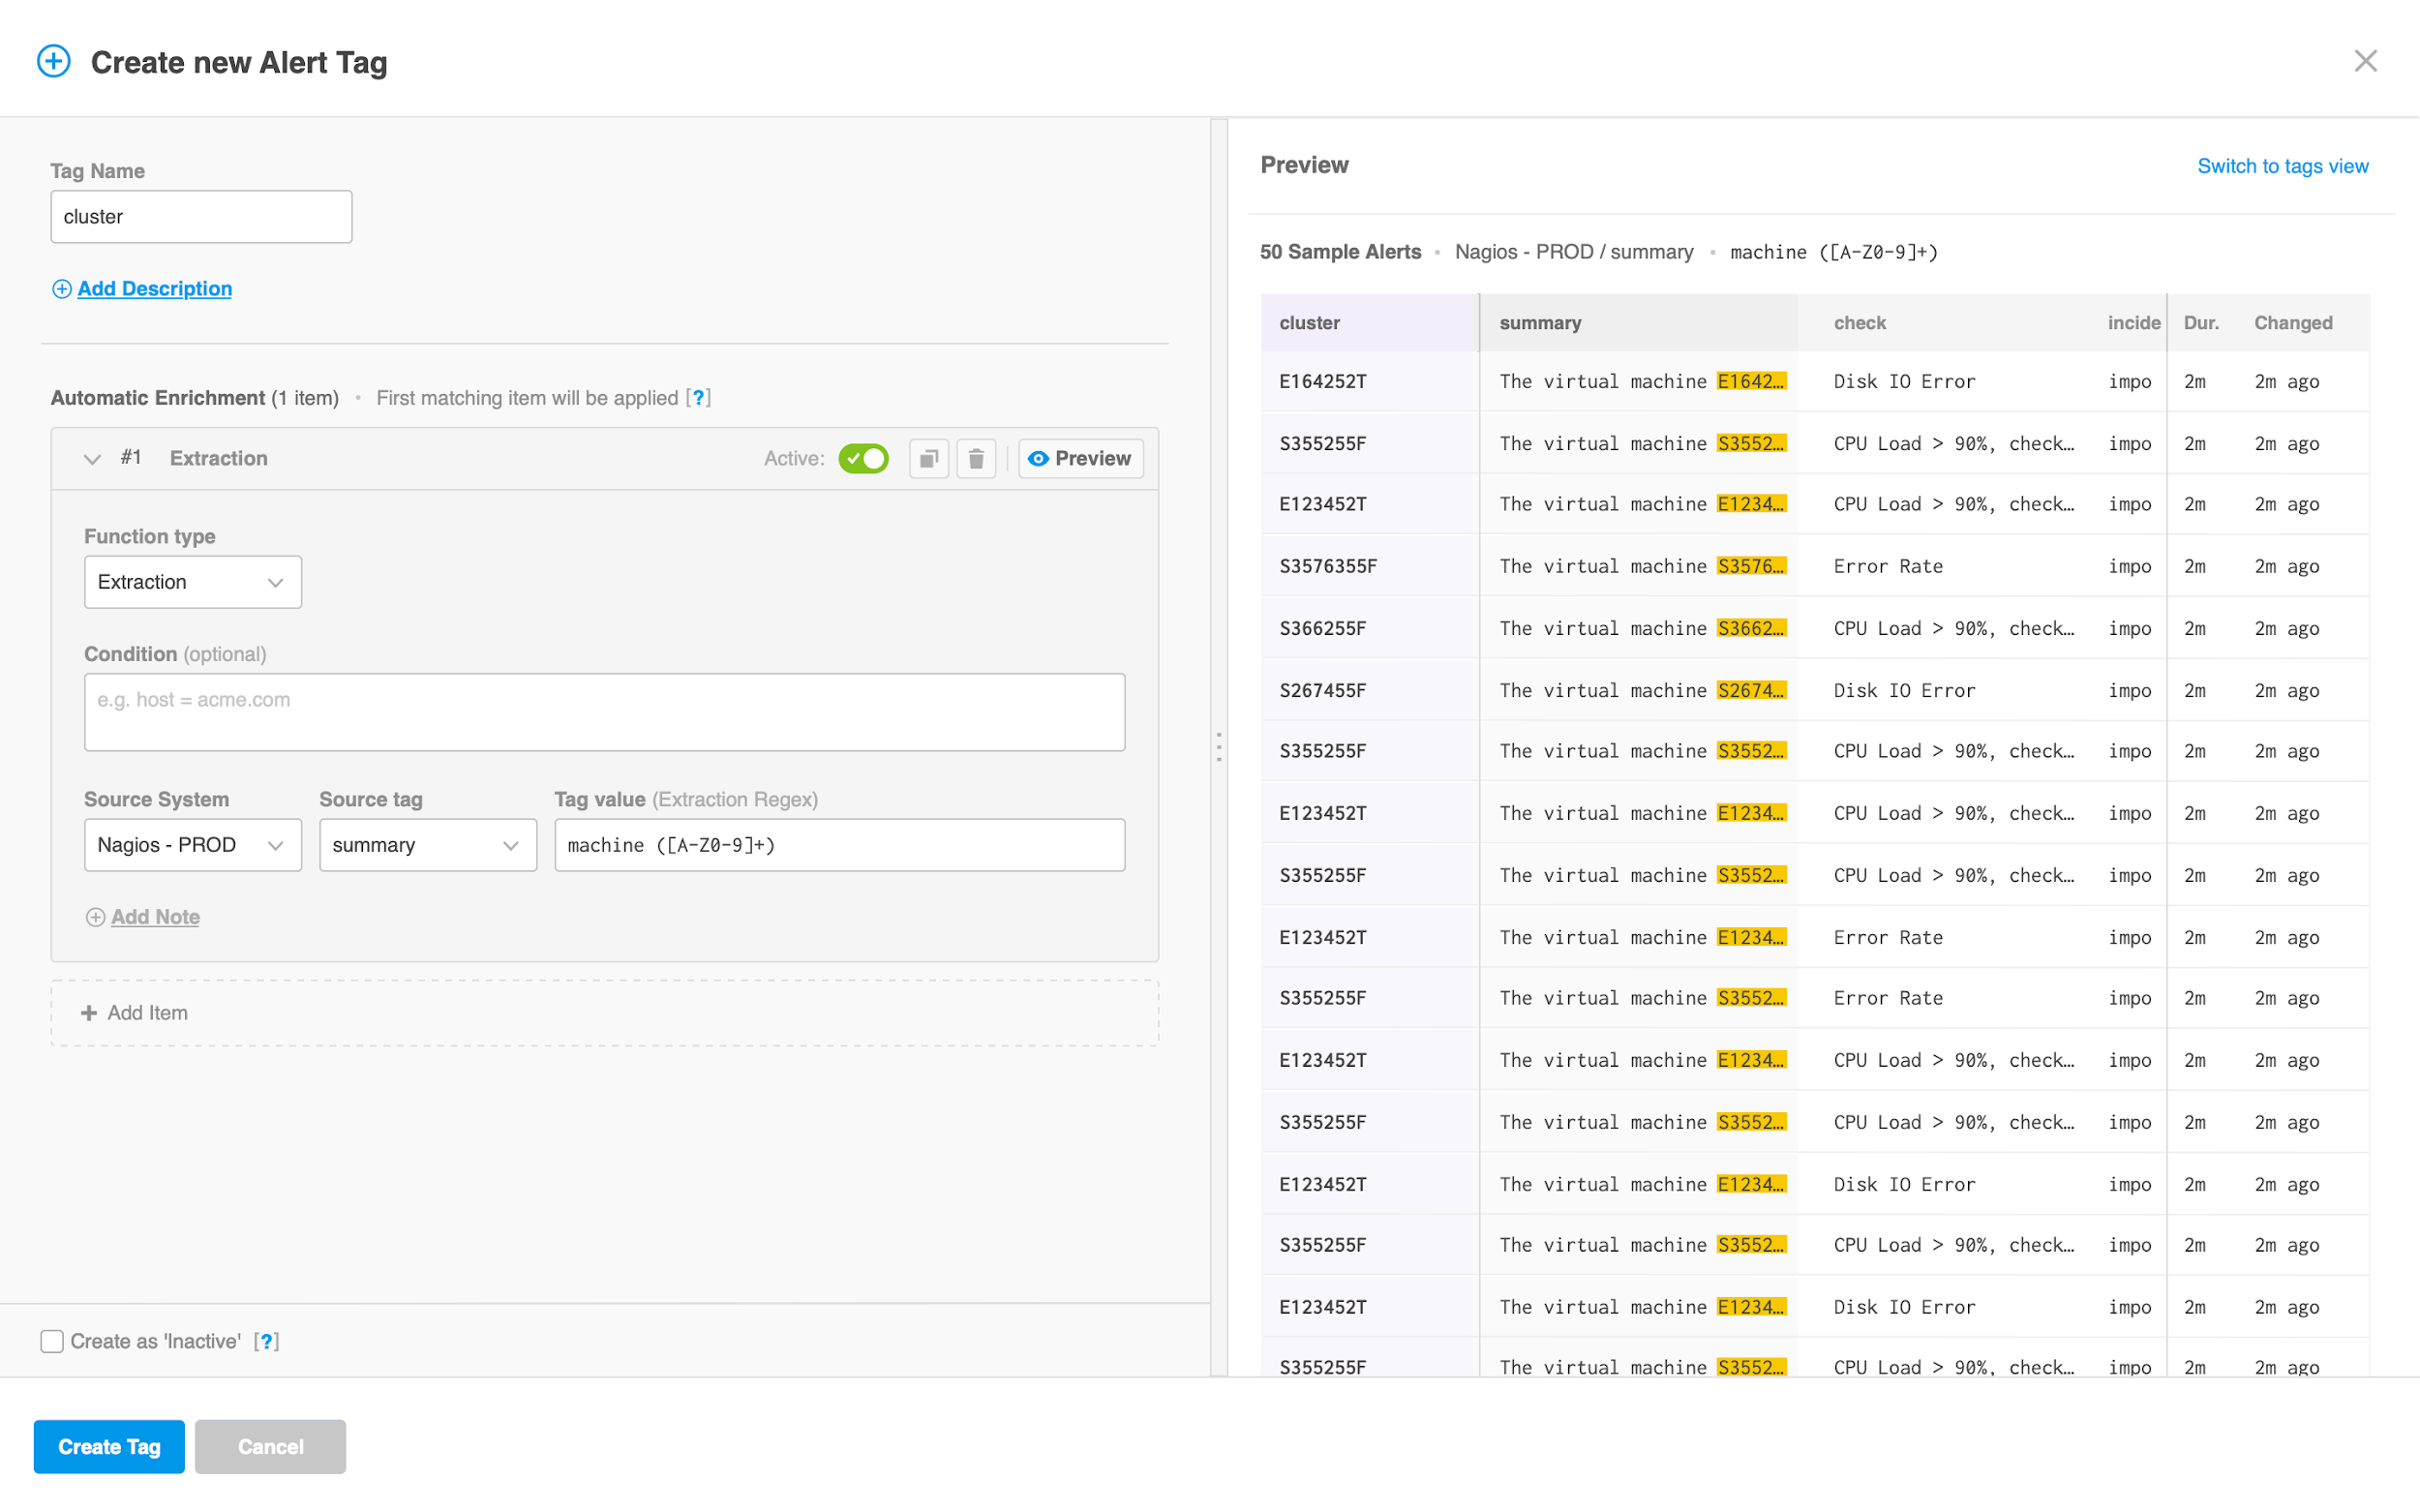 |
Previewing an Enrichment Tag
The Enrichment Preview fetches sample historical alerts from your BigPanda instance that match the Condition for any one of the enrichment items for that tag. Using these historical alerts as a “working set,” the preview will show how the current enrichment logic would apply to these tags.
To generate a Preview for the enrichment logic of a specific item, click on the Preview button next to the desired enrichment item. In the Preview pane to the right, each of the alerts from the working set will populate in a table showing:
The calculated value for the enrichment tag currently being edited, highlighted in purple
The source tag(s) with any extracted values highlighted in yellow
Additional alert data to give context on the alert type
Missing Enrichment
If the leftmost column is blank for any sample alerts, this means the enrichment logic would not apply for similar alerts in production. Reasons for a tag to not be enriched include:
Dependent tags not existing in the source alert
Extraction regex failing to match the source tag
Source values not found in a mapping enrichment
If values are failing to populate the left column, consider changing the item’s definition to be more generic, or creating more items to cover these alert types.
Preview mismatch
Generating a preview bypasses many downstream processes and may not perfectly match results for live events. This is particularly common when a configuration leverages words or characters that are reserved or have functionality limitations or have complex dependencies.
If a preview does not match expectations, you may need to verify the result through test events.
Manage Alert Enrichment Tags
You can edit, temporarily deactivate, permanently delete, or reorder alert tags.
You can filter the list of tags by entering a search term in the field above the list. Or, by using predefined filtering by status, type, and source.
Change Tag Details
Navigate to Settings > Alert Enrichment.
Select the tag you wish to edit, activate/deactivate, or delete.
Use any of the following options to modify the tag:
Parameter | Description |
|---|---|
Edit | a. Select the Edit pencil icon. b. Modify the tag's definitions according to your needs. c. Click Update Tag to apply the modifications. |
Active or Deactivate | At the top right of the tag details pane, toggle between Active or Deactivate. Active Tags will have a green bar on the ribbon and the Active status. BigPanda applies active tags to new alerts immediately after the tag definition is created. The new alert enrichment tag is not added to existing alerts in the system. When deactivating a tag that includes a map, the mapping rule is still preserved. |
Delete | a. Select the Delete trash can icon. b. Select Delete again to confirm the deletion. |
Custom Tags and Correlation Patterns
Correlation patterns are based off tag names. When editing custom tag names, correlation patterns with the tag should be updated to reflect the change.
Managing mapping enrichment
Mapping enrichment is configured and managed at the map level. See the Enrichment Maps documentation to learn how to create, manage, and maintain enrichment maps.
Change Tag Run Order
To change the order that alert enrichment tags apply to incoming alerts:
Navigate to Settings > Alert Enrichment.
At the top of the list, beside the screen title, select the Execution Order icon.
In the editor, click and hold the left edge of the tags and drag them into the desired order. To send a tag to the beginning or end of the execution order, click the Three Dots Icon, and select Top of the List, or Bottom of the List.
Click Save to finalize the changes.
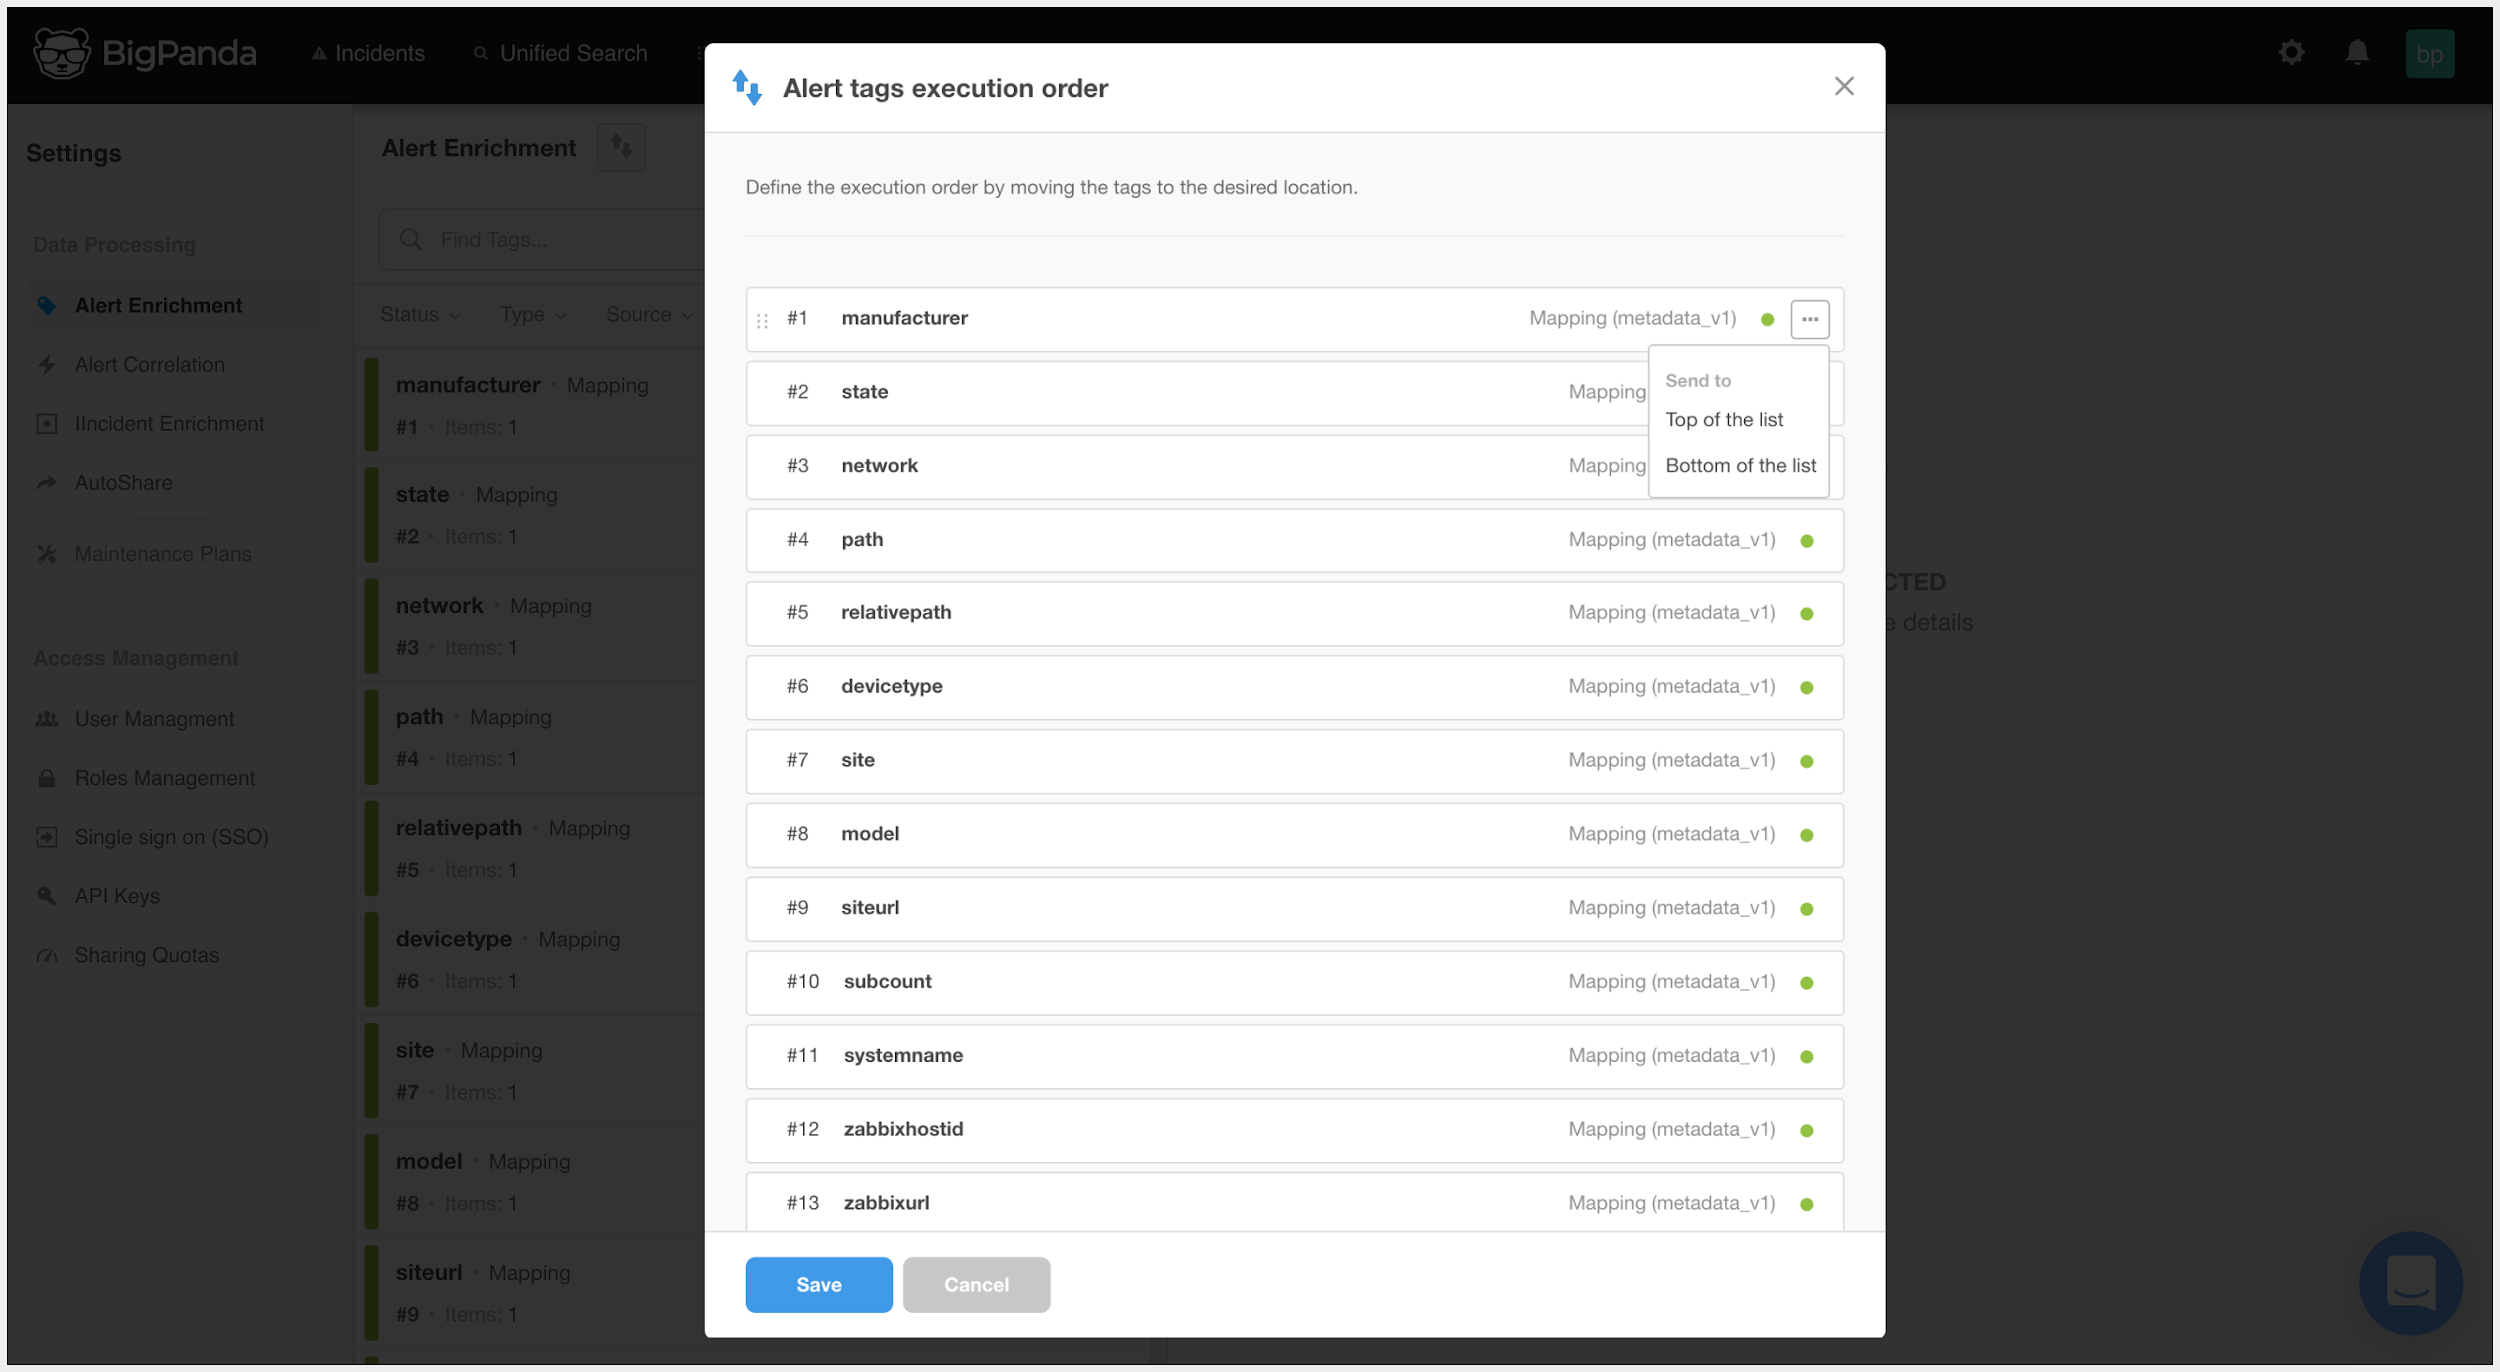 |
Modifying the Alert Tags Execution Order
Changes Apply to New Alerts Only
Modifications made to alert enrichment tags affect only new alerts, not existing alerts. When you disable or delete an alert enrichment tag, the tag is no longer added to new alerts. However, existing alerts that contain the tag are not affected, and the tag value is still available in the UI and in searches.
Next Steps
Investigate Alert Quality Reporting
Learn more about Navigating the Settings Menu
Dig into Alert Enrichment