Correlation Patterns
The Correlation Patterns dashboard provides insight into the effectiveness and trends of your correlation patterns. The dashboard enables you to view data on all of your patterns at a glance, and to drill down to view granular information about a specific correlation pattern.
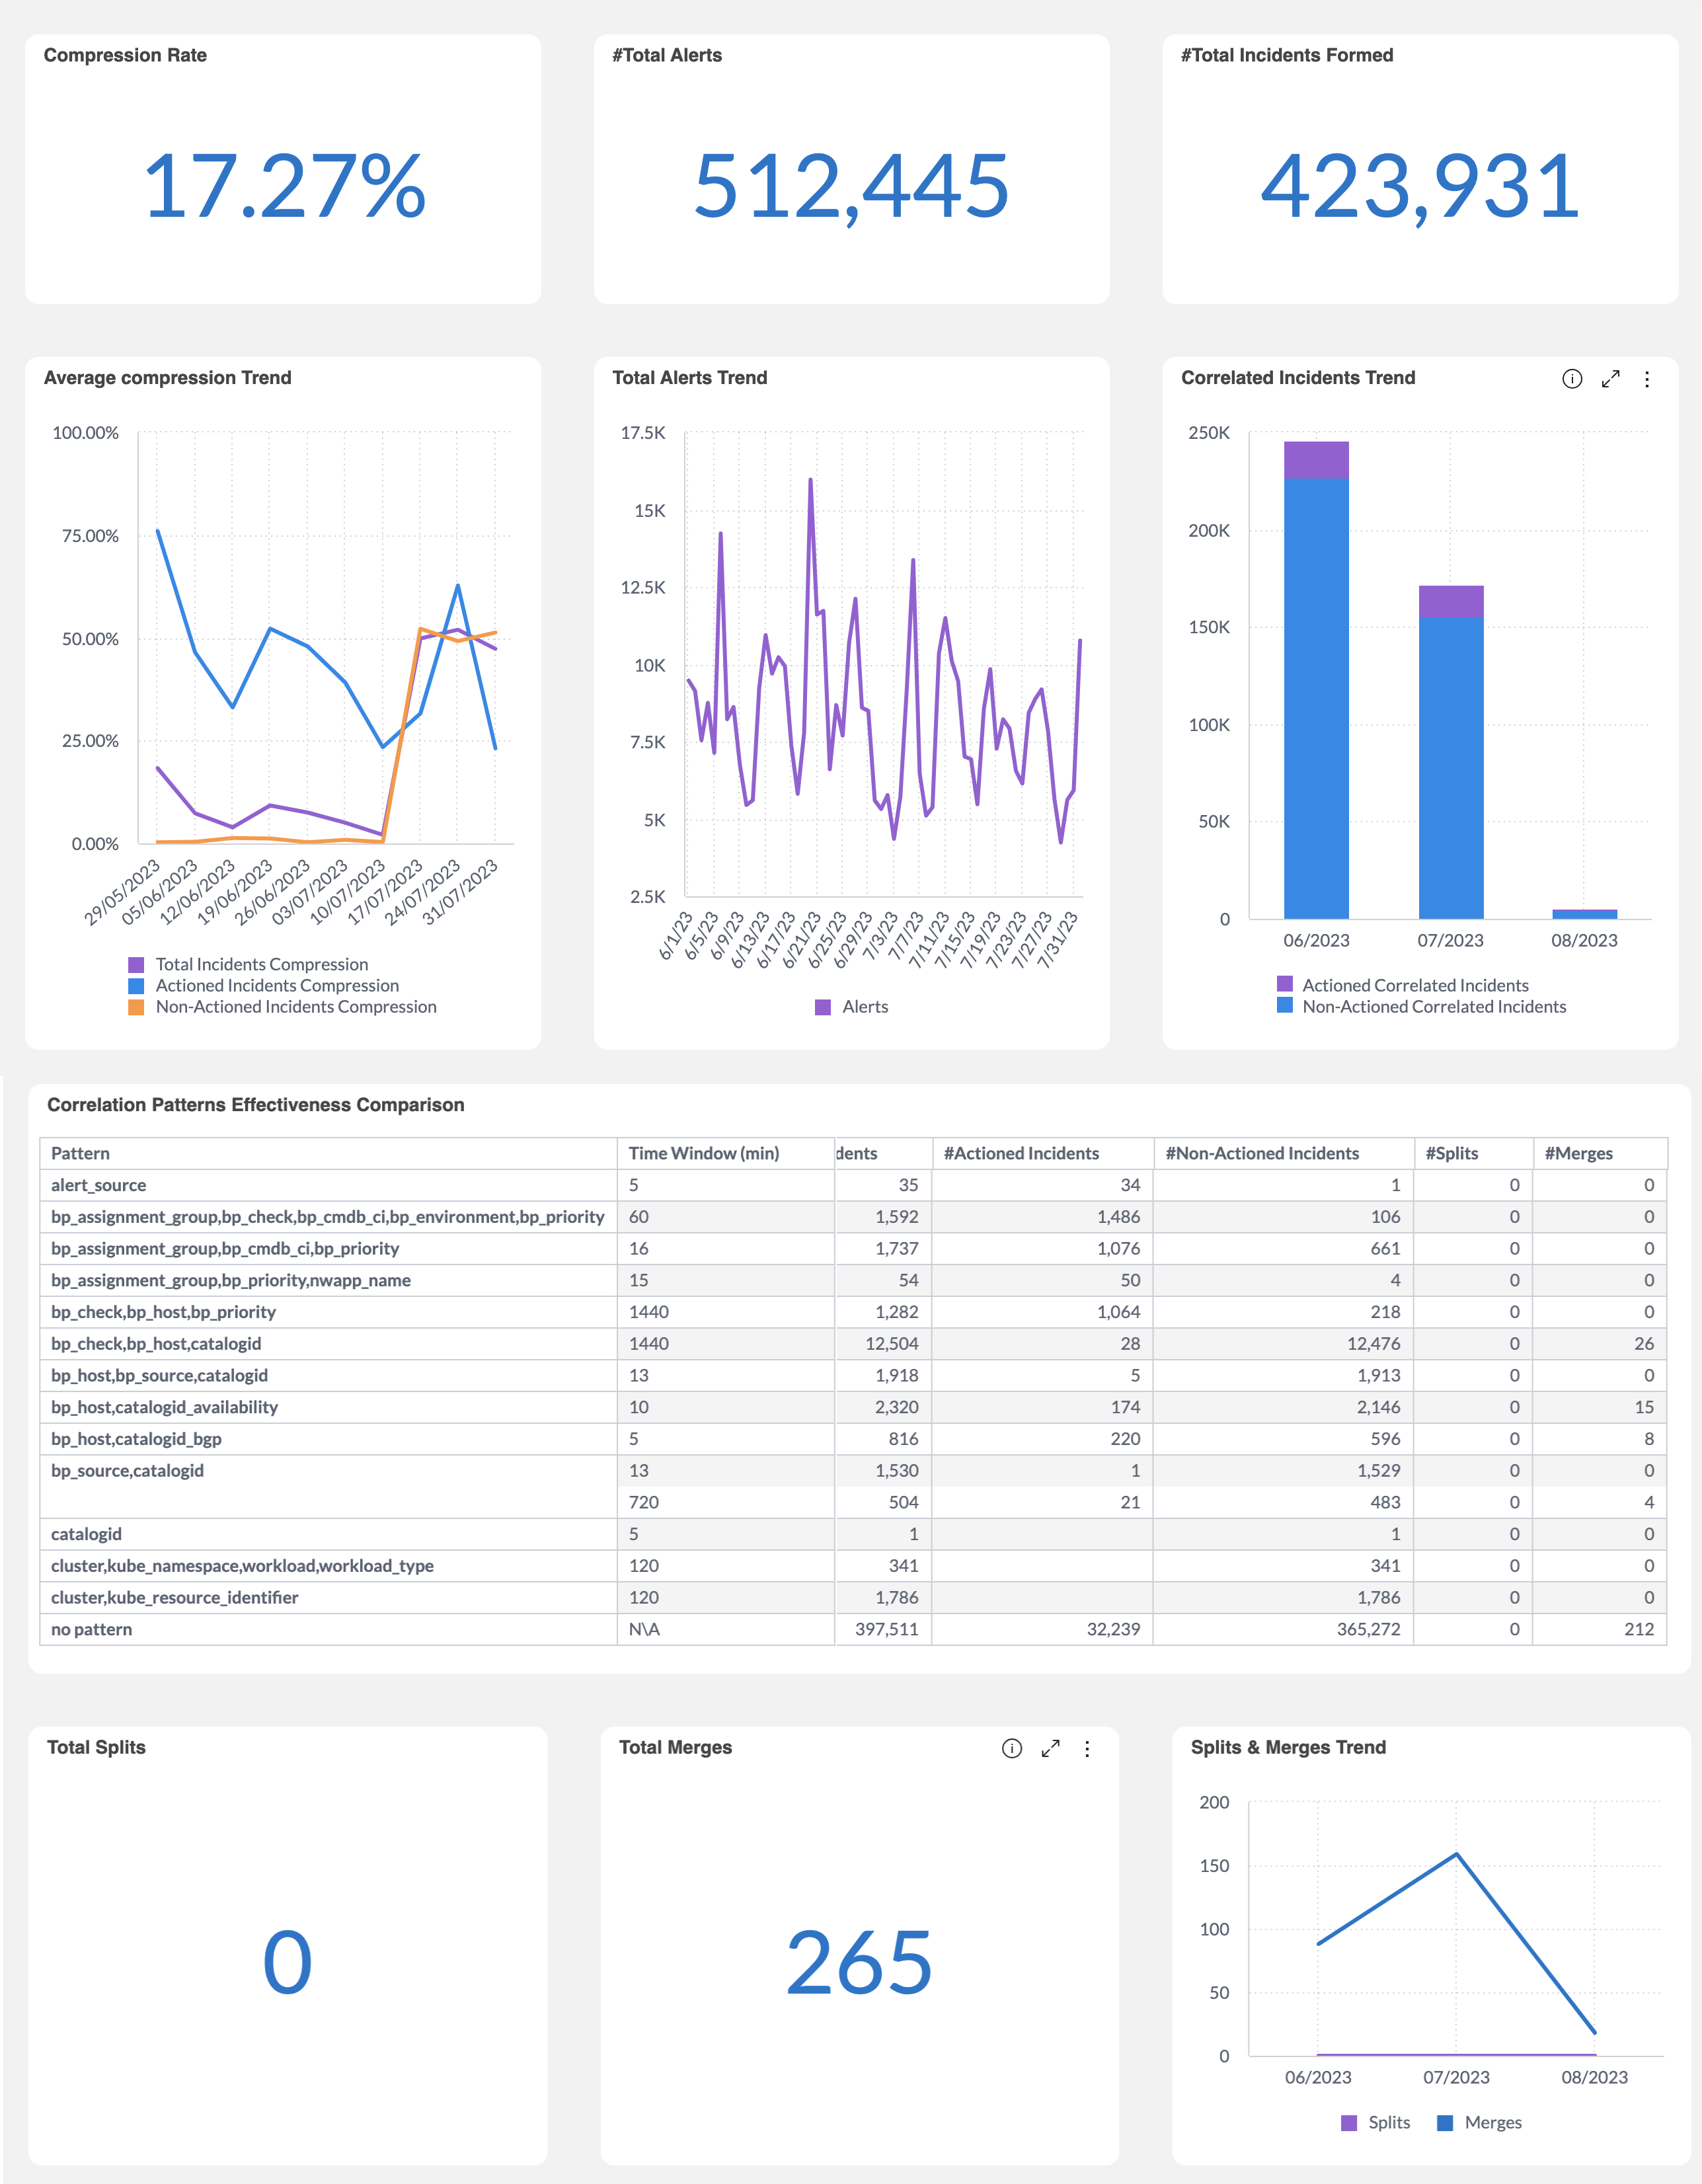
Correlation Patterns Dashboard
Dashboard duplication
This dashboard can be duplicated. See the Manage Unified Analytics documentation to learn how to create a new dashboard from a copy.
Key Features
The Correlation Patterns dashboard allows you to:
Visualize and track data on alert correlation across your instance.
Drill down to view analytics on specific correlation patterns.
Determine ways to improve configuration settings to reduce noise.
Correlation Patterns
The Correlation Patterns dashboard displays information on how all of your correlation patterns are performing.
Incident updates
Data in this dashboard is based on incident updates in the selected timeframe.
The following widgets are available within the dashboard:
Widget Name | Description |
|---|---|
Correlation % | The percent of processed alerts formed into incidents. The correlation calculation is 1 - [Number of unique incident_id] / [number of unique alert_id] |
Alert Count | The total number of alerts that were processed by correlation during the given timeframe. This widget is calculated by counting the number of unique alert IDs. |
Incident Count | The total number of incidents created during the given timeframe. This widget is calculated by counting the total number of unique incident IDs. |
Alert Count Trend | The total number of alerts correlated, over time. Total alerts are calculated by counting the total number of unique alert IDs per day. The calculation for correlation percent is 1 - [# of unique incident_id] / [# of unique alert_id] |
Correlated Incidents Trend | The number of actioned vs non-actioned correlated incidents. The number of actioned incidents is calculated by finding the total number of incidents where is_actioned=true. The number of actioned incidents is calculated by finding the total number of incidents where is_actioned=false. |
Average Compression Trend | The average correlation percentage over time for all incidents, actioned incidents, and non-actioned incidents. The calculation for total incident correlation is 1 - (Total incident IDs) / (Total unique alert IDs) The calculation for actioned incident correlation is 1 - (Total incident IDs), (Is_Actioned =true) / (Total unique alert IDs), (Is_Actioned=true) The calculation for non-actioned incident correlation is 1 - (Total incident IDs), (Is_Actioned =false) / (Total unique alert IDs), (Is_Actioned=false) |
Correlation Patterns Effectiveness | A table showing detailed data on your correlation patterns. The following information is displayed per correlation pattern: Pattern - The tags used in the correlation pattern. The No Pattern row refers to incidents that did not match any correlation pattern. Time Window (min) - The time window in which this pattern will correlate alerts together. Correlation % - The percent of alerts that were correlated into incidents. The calculation for correlation % is 1 - [# of unique incident_id] / [# of unique alert_id]. Alert Count - Number of alerts correlated by the pattern. Alerts are counted by the number of unique alert IDs. Incident Count - Number of incidents created by the pattern. Incidents are counted by the number of unique incident IDs. Actioned Incidents - Number of actioned incidents. Non-Actioned Incidents - The number of non-actioned incidents. Splits - The number of splits that occurred on incidents created by the correlation pattern. Merges - The number of merges that occurred on incidents created by the correlation pattern. |
Total Splits | The total number of incidents split into new incidents that occurred in the dashboard’s timeframe. |
Total Merges | The total number of source incidents merged into new incidents that occurred in the dashboard’s timeframe. |
Splits & Merges Trend | A line graph showing the trend of splits and merges over time. |
Correlation Pattern Filter
In addition to the time filter, the Correlation Patterns dashboard allows you to filter by a specific correlation pattern.
Select patterns from the filter to drill down into and compare the effectiveness of individual patterns.
No pattern incidents
Incidents that don’t match any Correlation Pattern won’t compress. The No Pattern incidents row in the Correlation Patterns Effectiveness Comparison widget will highlight these. You can also use the filter to drill down into No Pattern incidents.
Learn more about using filters and widget options in the Filter Dashboards documentation.
Next Steps
View Unified Analytics dashboards.
Learn how to Manage Unified Analytics.
Find definitions of Unified Analytics key metrics.
Dive into potential reporting fields in the Standard Data Model documentation.