The New Incident Console
Incident information in BigPanda is managed from a centralized location in the Incidents tab within the UI. You can organize, assign, investigate, and escalate incidents as necessary to facilitate a quick resolution.
The BigPanda Incident Console delivers an incident feed with intuitive usability and performance. The console allows you to accelerate your incident management workflow and surface more actionable insights.
Take a Tour
Click the module below to view an interactive tour of the Incidents Tab.
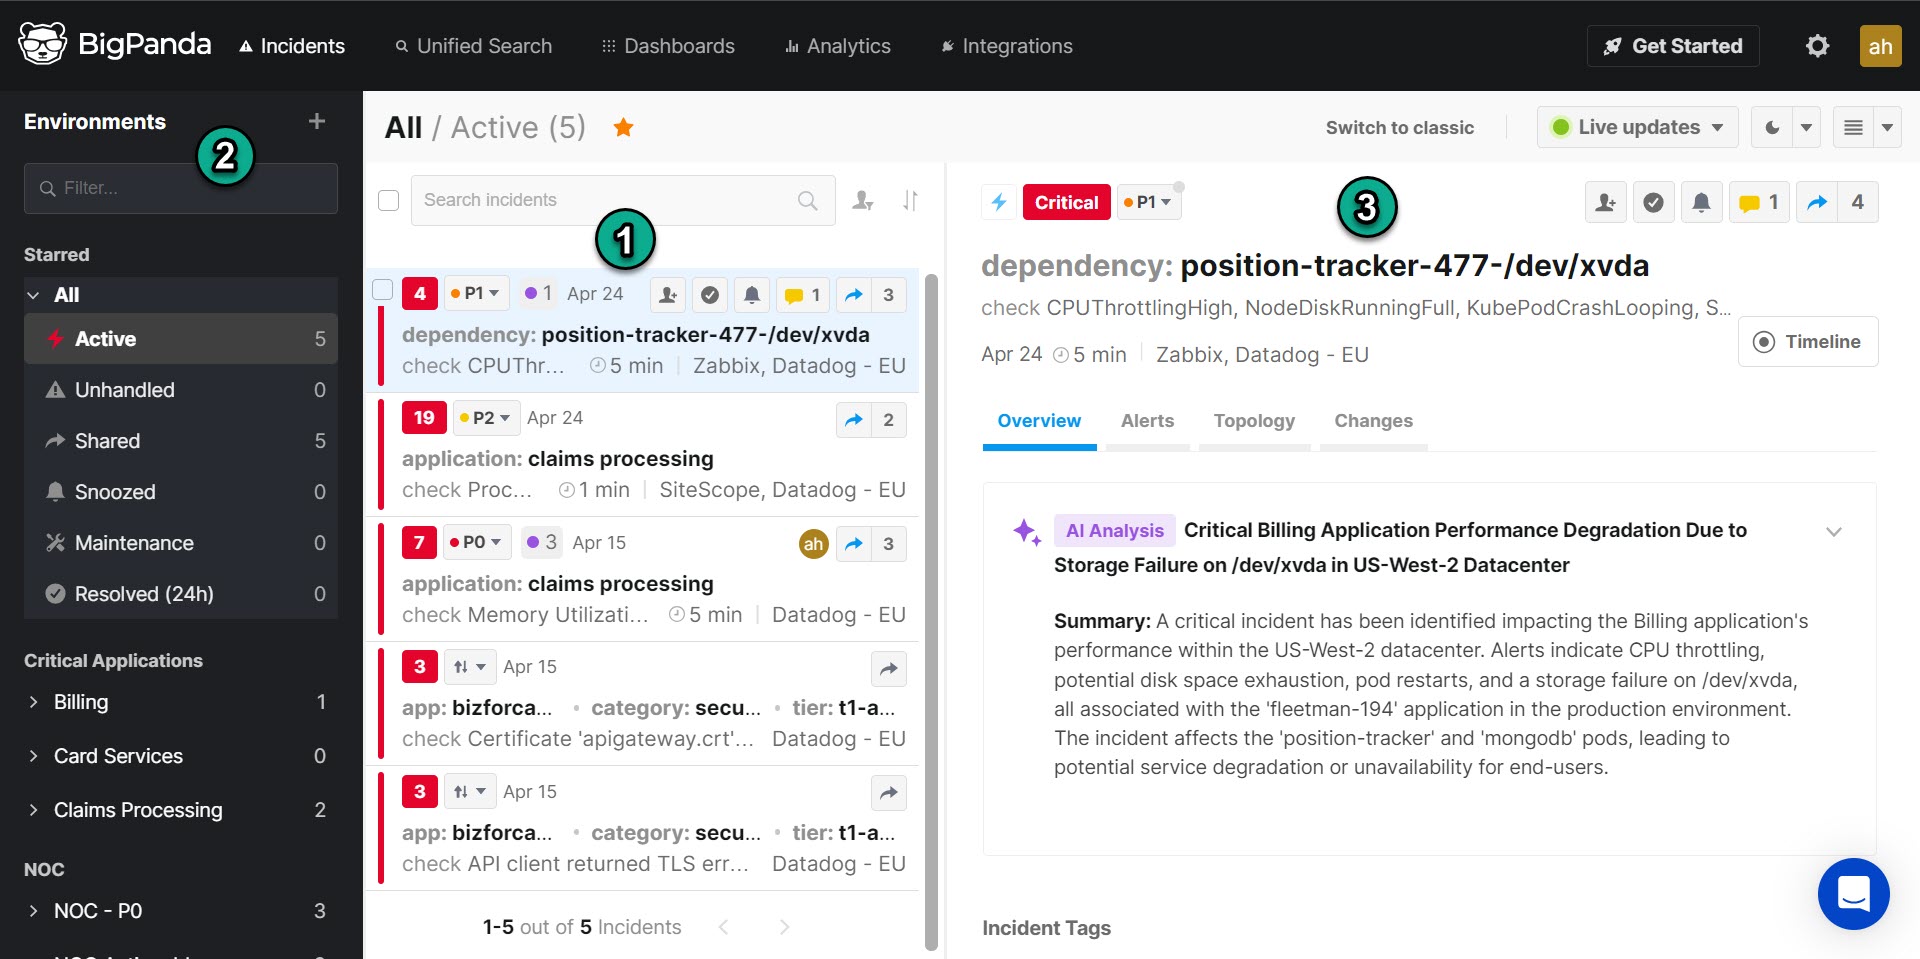
Incidents Tab
Field | Description | Links |
|---|---|---|
1 - Incident Feed | A view of incidents based on a selected folder. You can use the search bar to find a specific incident, or use the filter and sort options to adjust your results. | |
2 - Environments Pane | The environments and folders that you can use to filter the incident feed. | |
3 - Incident Details Pane | Detailed information about the selected incident. You can view details of the related alerts, view the incident life cycle on a timeline, and more. |
Feed Settings, Theme, and Pane Layouts
You can customize your incident console by adjusting the feed settings, choosing a different theme, or changing the layout of your incident feed and incident details pane.
Field | Description |
|---|---|
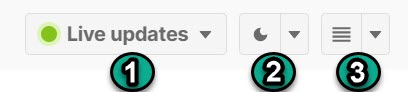
1 - Feed Settings | Toggle the feed between Live Updates and Manual Updates. Live Updates updates the incident feed with new incidents, comments, and changed incident statuses automatically. Manual Updates will only update the incident feed when you refresh your browser page, or when reopening the page after closing. |
2 - Theme | Toggles the console between the Light Theme and Dark Theme. |
3 - Layout | The layout toggle allows you to choose the orientation of the console. You can customize your incident console by choosing a list, split, or table view. |
Customize Incident Layouts
You can customize how incidents appear on the screen by choosing a list, split, or table pane layout.
When the List layout is selected, the details pane appears to the right of the feed. The Split layout places the details pane below the incident feed. The table layout displays the incident feed without the details pane.
The default view is List, but once you’ve changed the setting, BigPanda will remember your selection.
List Pane
Split Pane
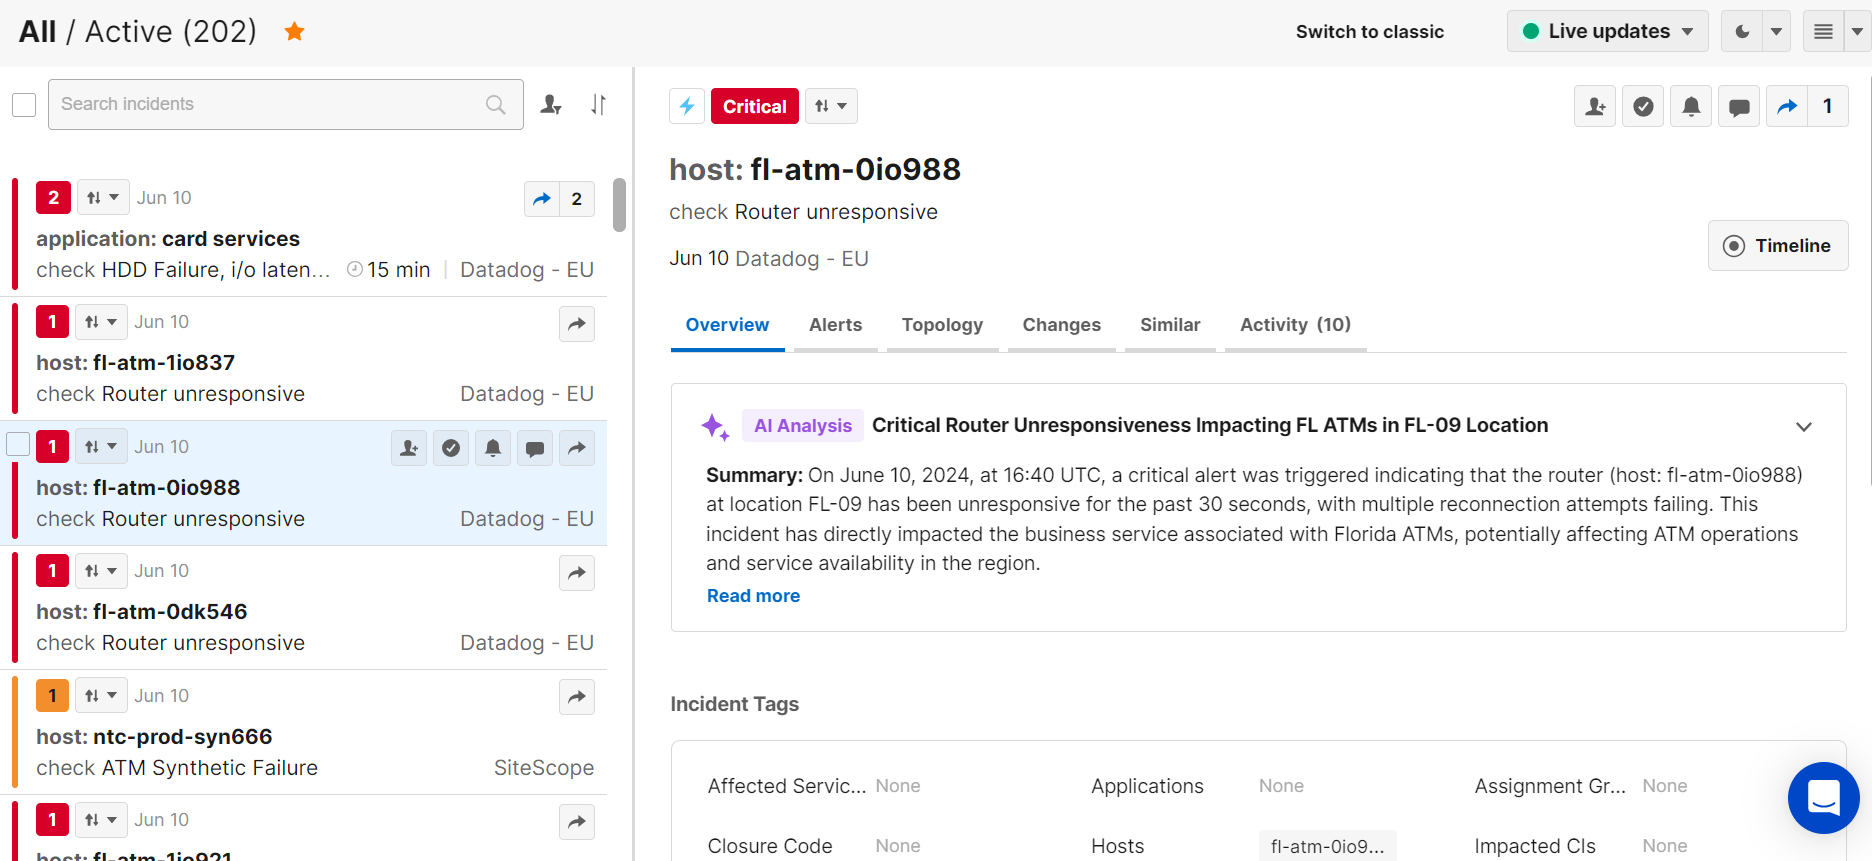
When the Table view is selected, the incident feed view appears without the details pane by default.
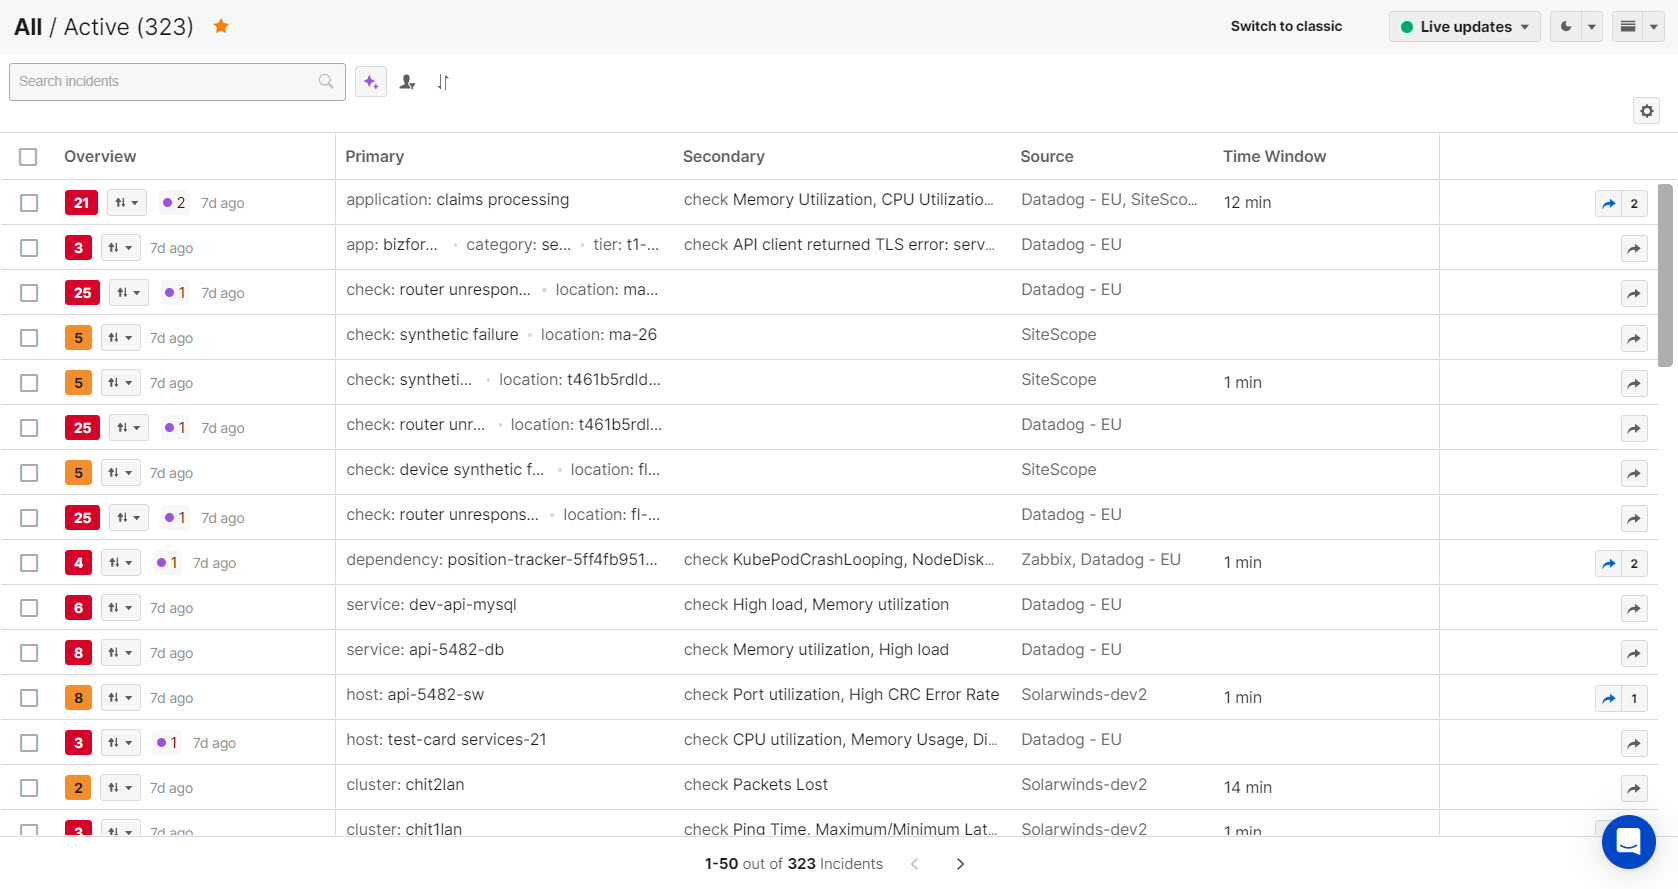
Table Option
To activate this view, click the layout button on the top right side of the console and select Table. When this layout is selected, the incident feed ribbon will fill the entire incident console. You can drag the edges of each column to adjust the size.
To view incident details, click an incident in the feed and the details will appear in a flyout pane on the right.
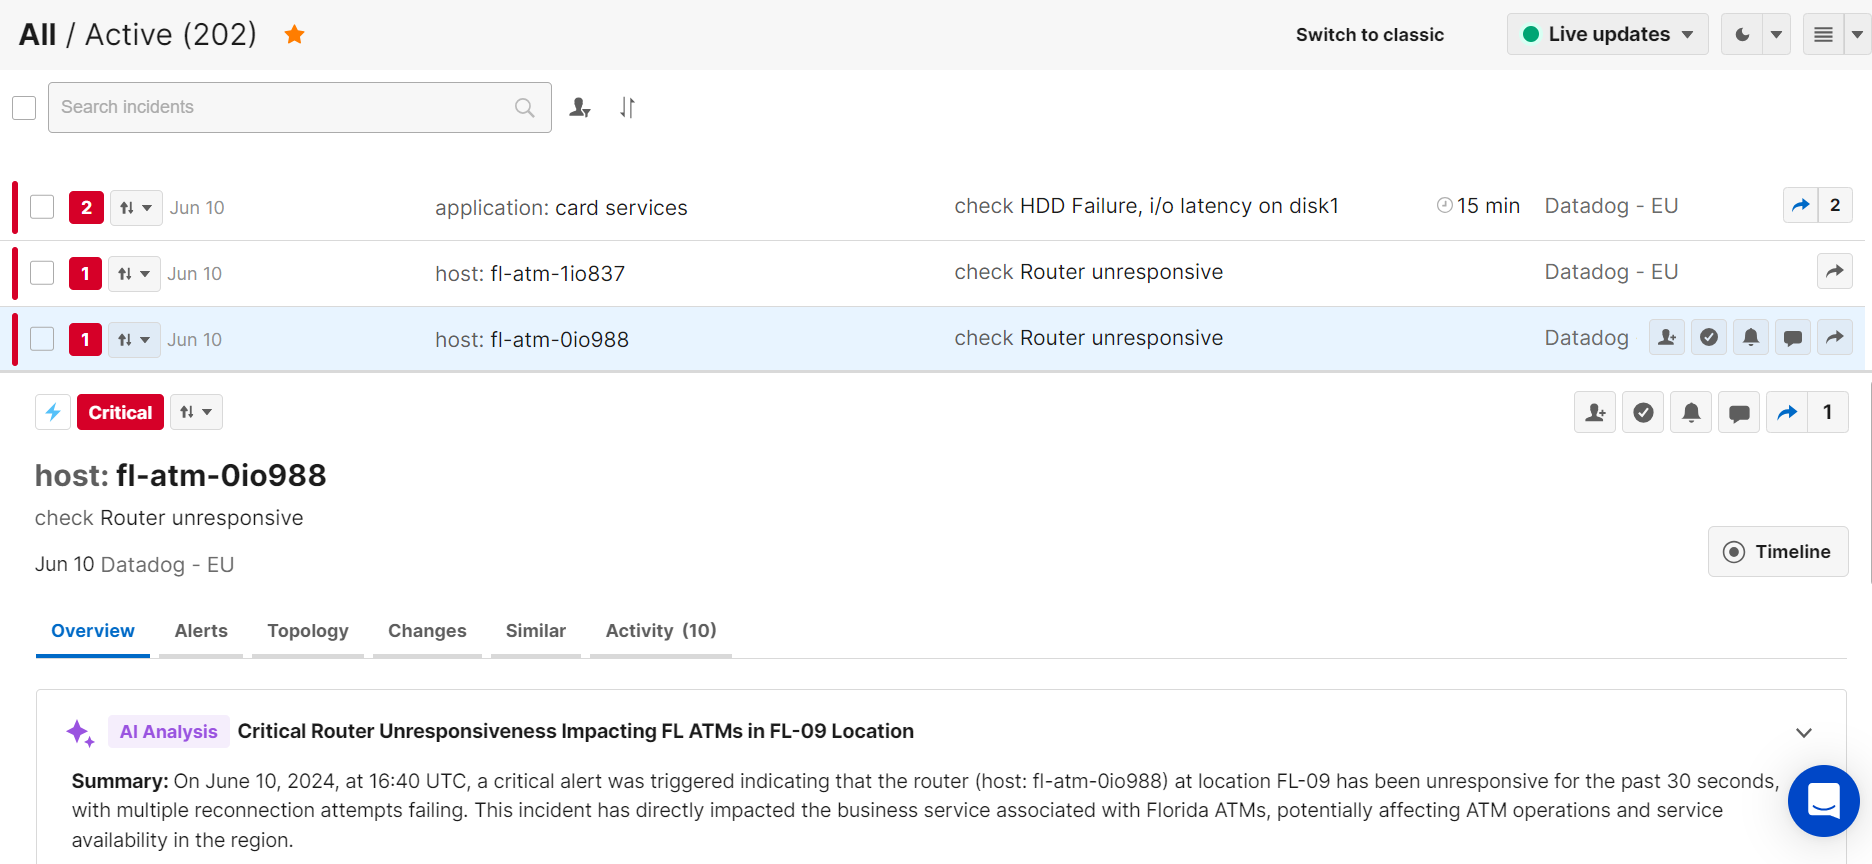
Details Pane
Incident Feed View Customization
With Incident Feed Views, you can customize the tags that appear when the Table layout is selected so that the information most relevant to you is always available at a glance.
Incident Feed Views are based on environments, so you can create separate views for different teams working in BigPanda. All users who have access to an environment will see the same customized table view.
See the Manage Incident Feed Views documentation for more information.
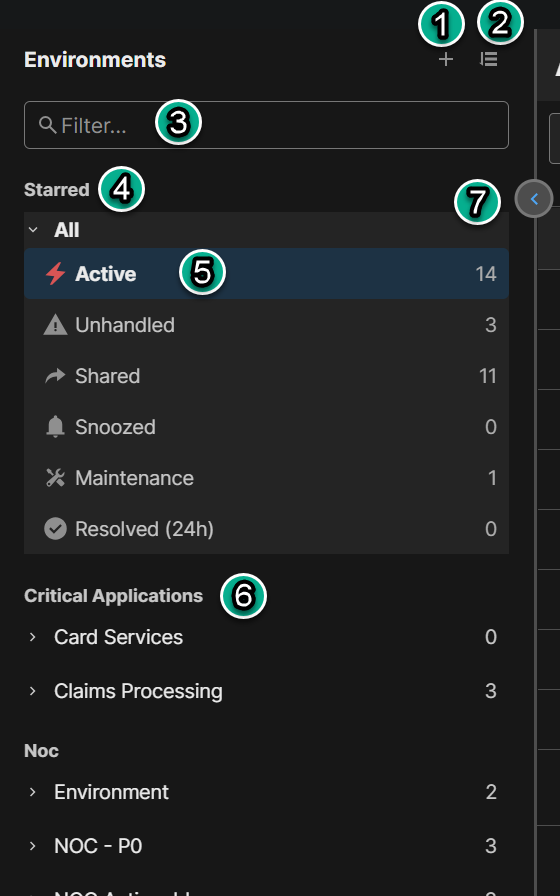
The Environments Pane
Environments filter and group incidents based on properties such as source and priority for easy visibility and action. Environments make it easy for your team to focus on the incidents relevant to their role and responsibilities.
You can use environments to filter the incident feed, create dashboards, set up sharing rules, and simplify incident search.
The Environments Pane
Field | Description | Related Links |
|---|---|---|
1 - Create a new environment or environment group | Click the + button to add a new environment or environment group. | |
2 - Sort Environments | Click the Sort icon to sort the list of environments Alphabetically or by Creation date. | |
3 - Filter Environments | Search the environments pane for a specific folder, group, or environment. | |
4 - Starred Environments | Environments that were starred appear at the top of the environments pane. | |
5 - Environment Folder | Each environment is automatically assigned status folders: Active, Unhandled, Shared, Snoozed, and Resolved. | |
6 - Environment Group | Environment groups organize your environments by common functions or properties such as business services, teams, and infrastructure areas. | |
7 - Collapse Environment Pane | Click the blue arrow to completely minimize the Environments pane. |
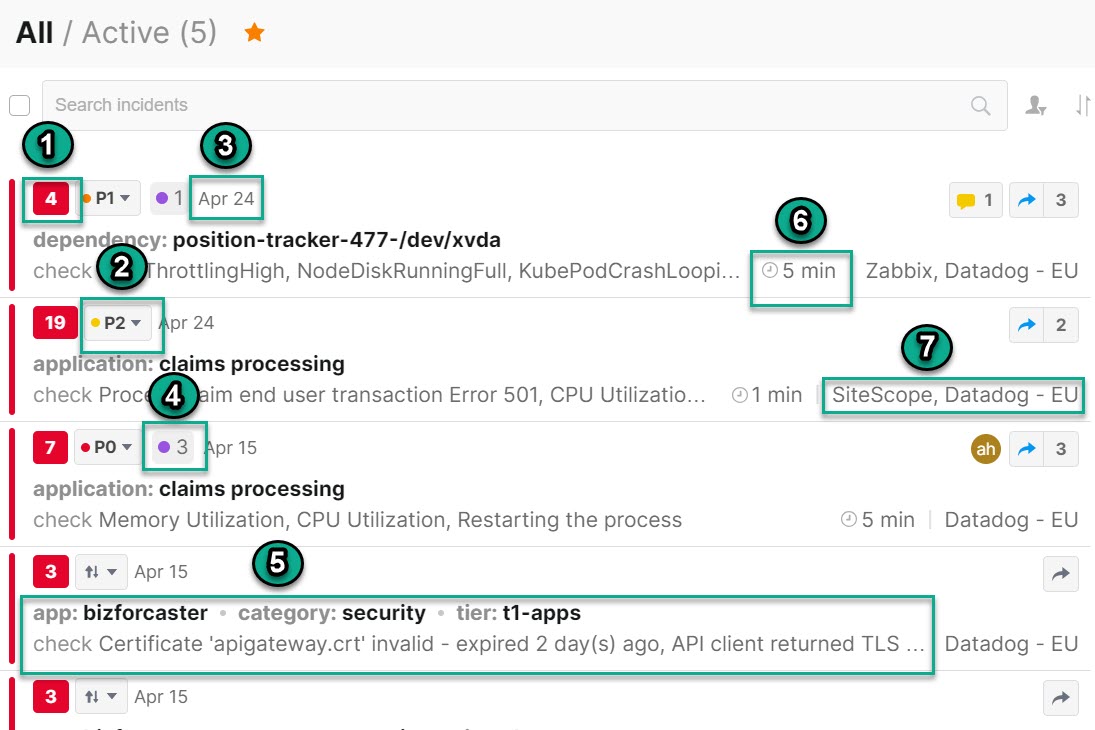
Incident Feed
The incident feed provides a view of all active incidents from the selected environment. You can use the feed to manage and take action on your incidents.
Field | Description | Related Links |
|---|---|---|
1 - Number of Active Alerts and Incident Status | The number of related alerts that are in the Critical or Warning state, and the incident status. The incident status is updated based on the status of the most severe active alert. | |
2 - Priority | The incident's assigned level of importance. | |
3 - Last Changed Date | The date when the last update in the incident occurred. | |
4 - Change Suspects | The number of root cause change suspects associated with the incident. | |
5 - Incident Title and Subtitle | Description of the incident that gives insight into the incident impact, correlation logic, and related alerts. The title is based on the primary property, and the subtitle is based on the secondary property. | |
6 - Time Window | The amount of time between the start of the first and last correlated alert. | |
7 - Source | The monitoring tool(s) where the events originated. |
Incident Actions
The incident action icons appear after hovering over an incident.
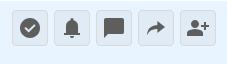
Incident Actions
Available incident actions include resolve, snooze, comment, share, and assign.
See the Respond to Incidents documentation for more information.
Find and Select Incidents
The incident feed contains options that help you find the exact incident or group of incidents that you need.
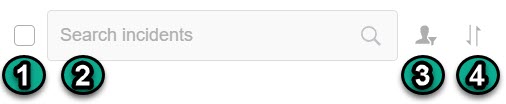
Search, select, and filter incidents
Field | Description | Related Links |
|---|---|---|
1 - Search or filter incidents | Search or filter for specific incidents. | |
2 - Select All | Click the box to select all of the incidents on the page. This allows you to perform actions on multiple incidents at once. | |
3 - Filter and Sort | The Filter option is used to filter the feed by the assignee. Use Sort to sort the incident feed by the selected property. The following options are available:
|
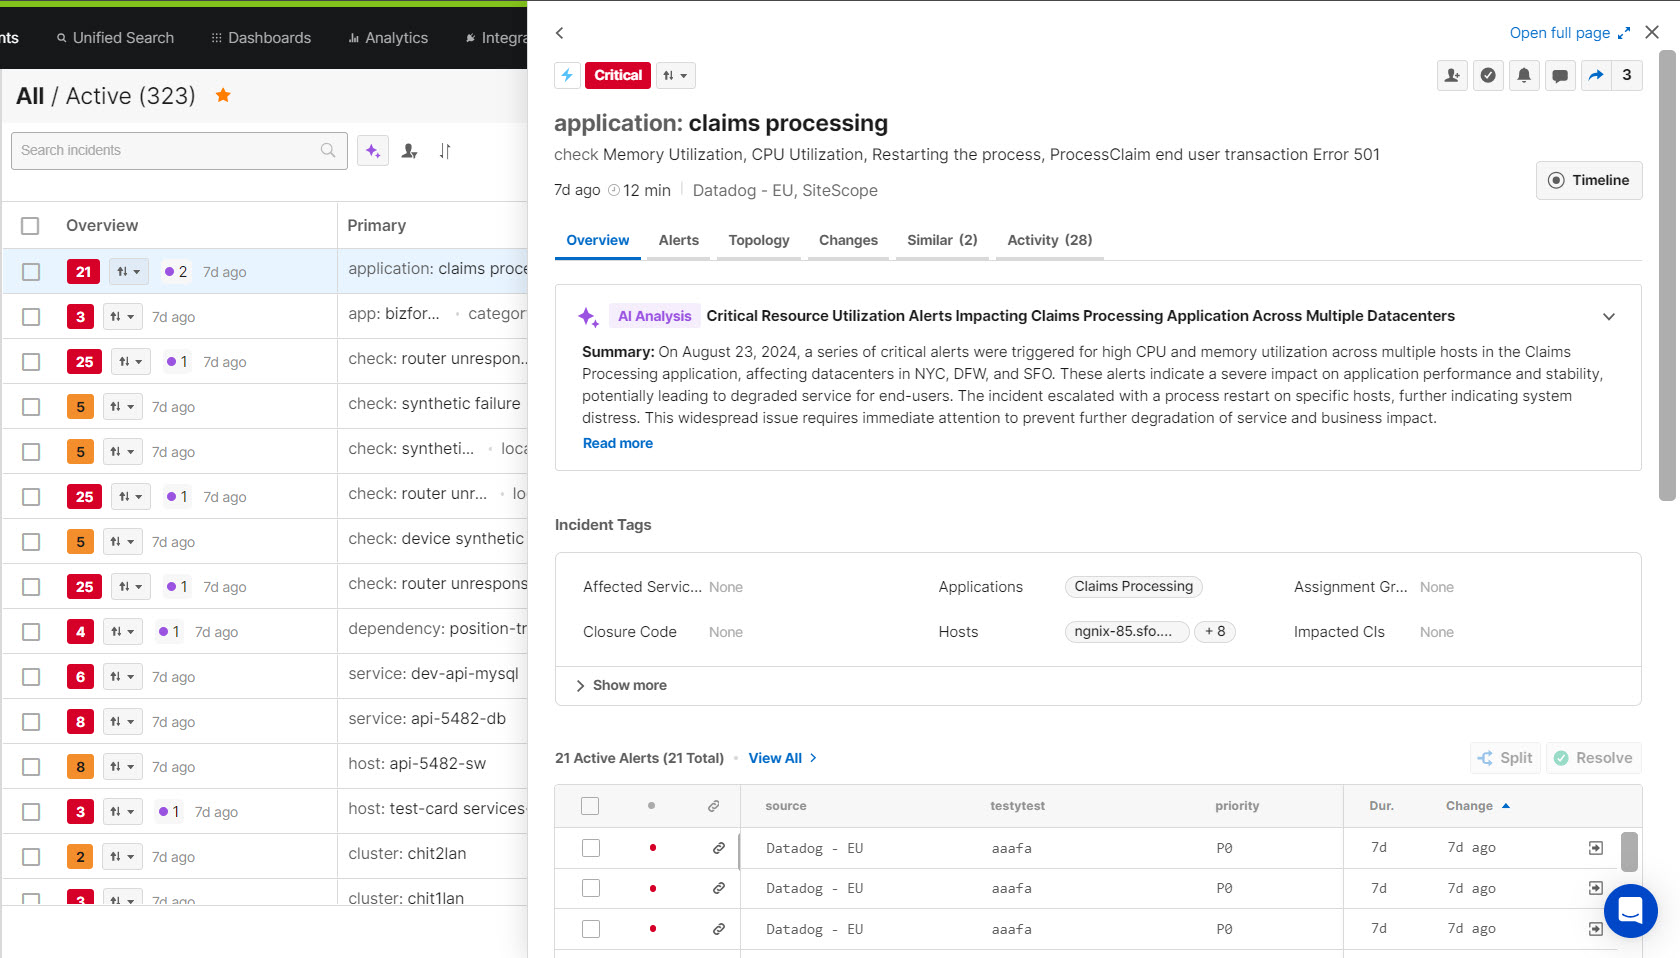
Incident Details Pane
The incident details pane provides a comprehensive view of all information related to an incident. Use the incident details pane to view incident history and take action on incidents.
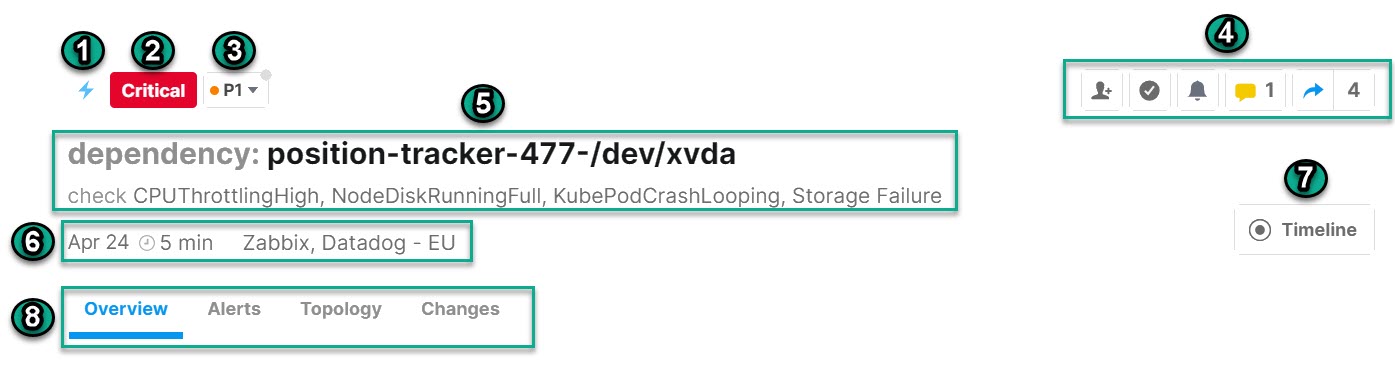
Field | Description | Links |
|---|---|---|
1 - Matched Correlation Patterns | Click the lightning bolt icon to see a list of matched correlation patterns for the incident. | |
2 - Status Indicator | Indicates the incident status, which is determined by the most severe status of the related alerts. | |
3 - Priority | Allows you to view or change the priority of the incident. | |
4 - Incident Actions | Provides access to the available actions for an incident, such as Assign, Resolve, Snooze, Comment, and Share. If the incident has already been shared, a number will appear next to the Share icon indicating how many times it has been shared. | |
5 - Incident Title and Subtitle | Description of the incident that gives insight into the incident impact, correlation logic, and related alerts. The title is based on the primary property, and the subtitle is based on the secondary property. | |
6 - Last Changed Date, Time Window, and Source | The last changed date is when the last change to the incident occurred. The time window is the duration between the start time of correlated alerts in minutes. The Source is the monitoring tool where the events originated. | |
7 - Timeline | Allows you to visualize the life cycle of an incident on a timeline, which helps you understand how the incident has unfolded. | |
9 - Tabs | The Overview tab, Alerts tab, Topology tab, Changes tab, Similar tab, and Activity tab are accessible from the center of the Incident Details screen. | Overview Tab Topology Tab Changes Tab Similar Tab Activity Tab |
Timeline
The Timeline visually displays incident information, activities, maintenance events, and changes over time. It shows the time when the first alert was received (incident start time) and the time when the incident was resolved (incident end time), or the current time if the incident is still active.
Alert/Incident Statuses
The incident timeline shows status changes along the Status line. Status changes are marked using colored dots and lines.
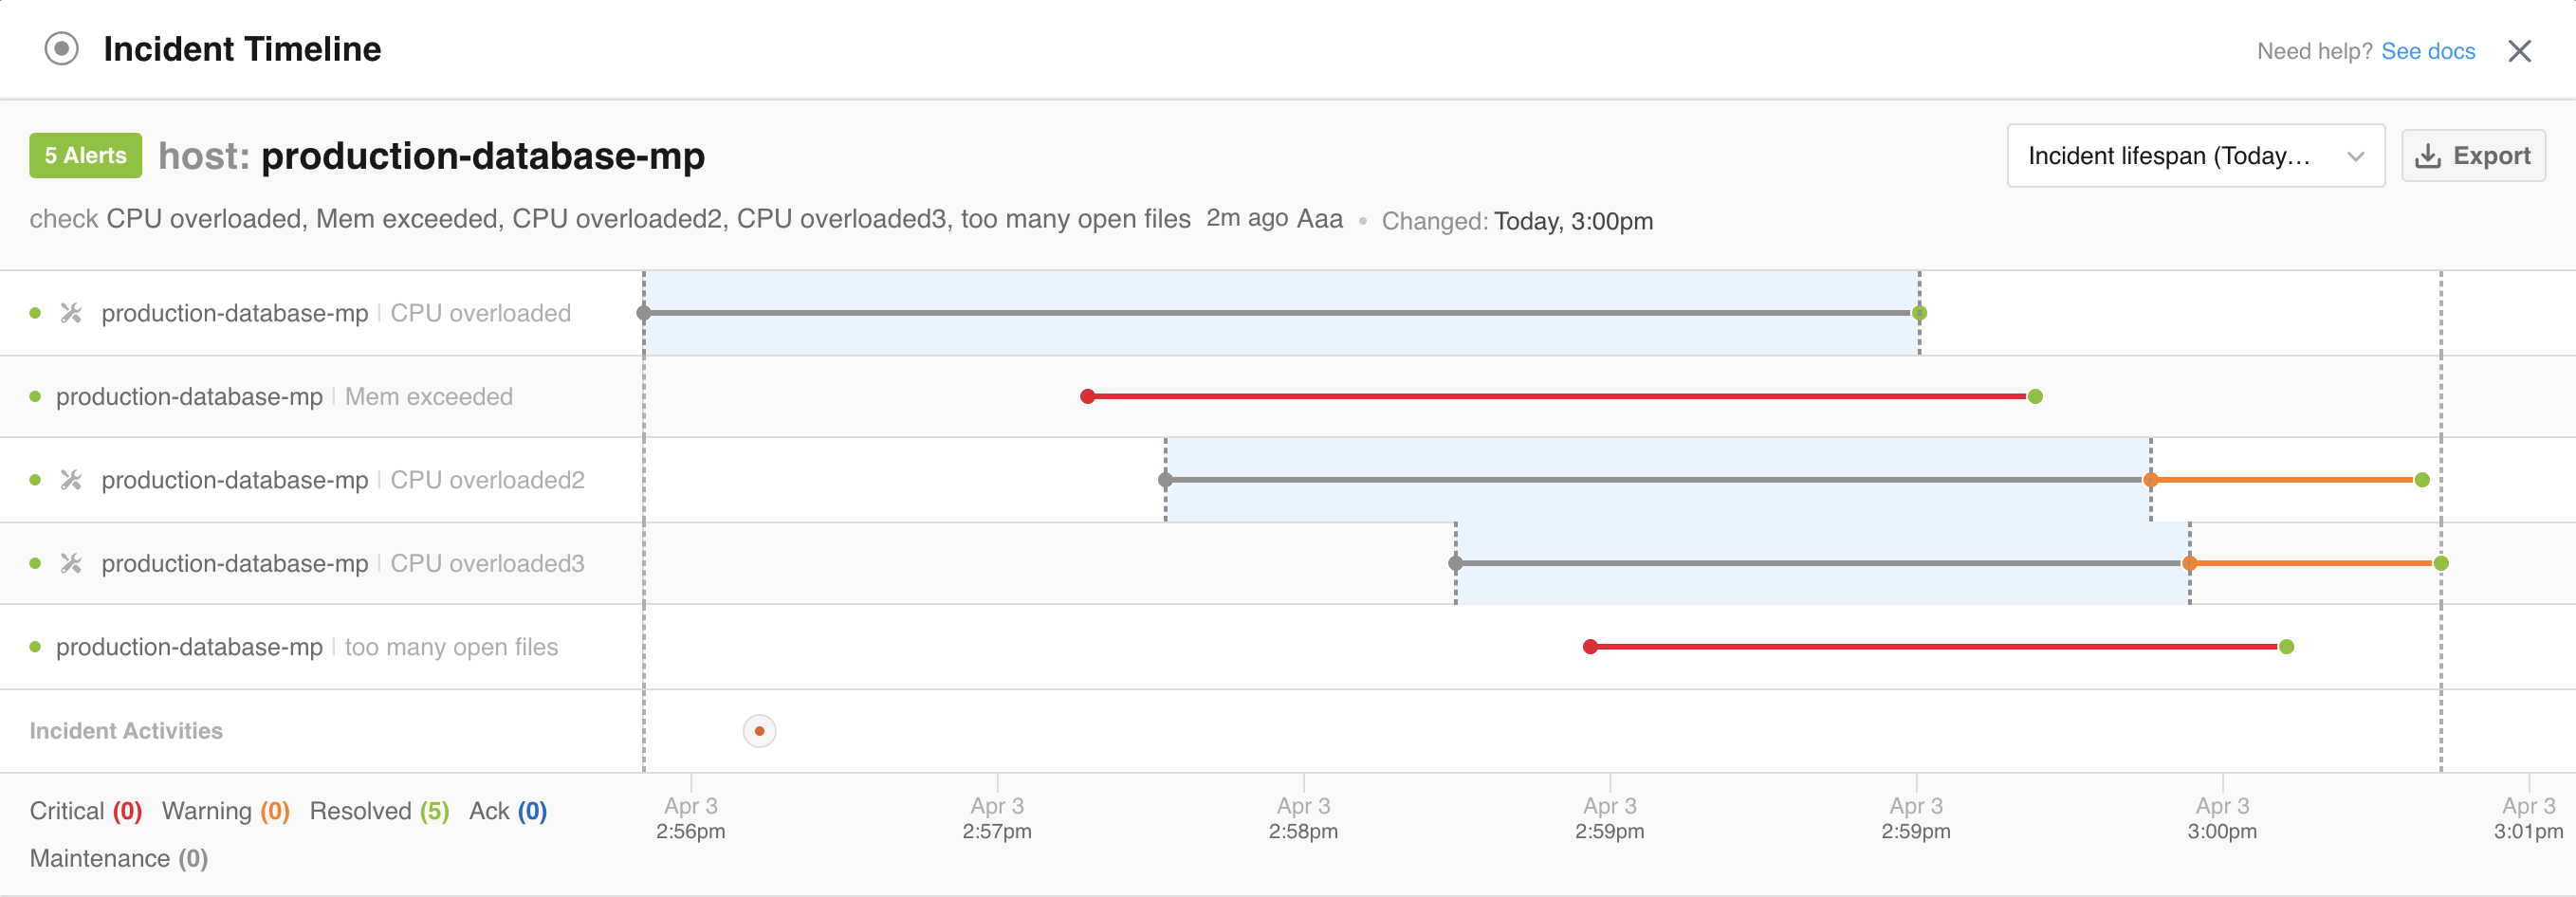
Icon | Description |
|---|---|
Orange dot | The alert is in Warning status. |
Red dot | The alert is in Critical status. |
Green dot | The alert was resolved. |
Black and grey circles | The alert was marked as flapping. |
Grey dot | The status is unknown. |
Dotted line | The alert is in maintenance. The status line will also be highlighted in light blue for the duration of the maintenance period. |
Blue dot | The alert was acknowledged |
Additional incident actions are shown along the Activities line.
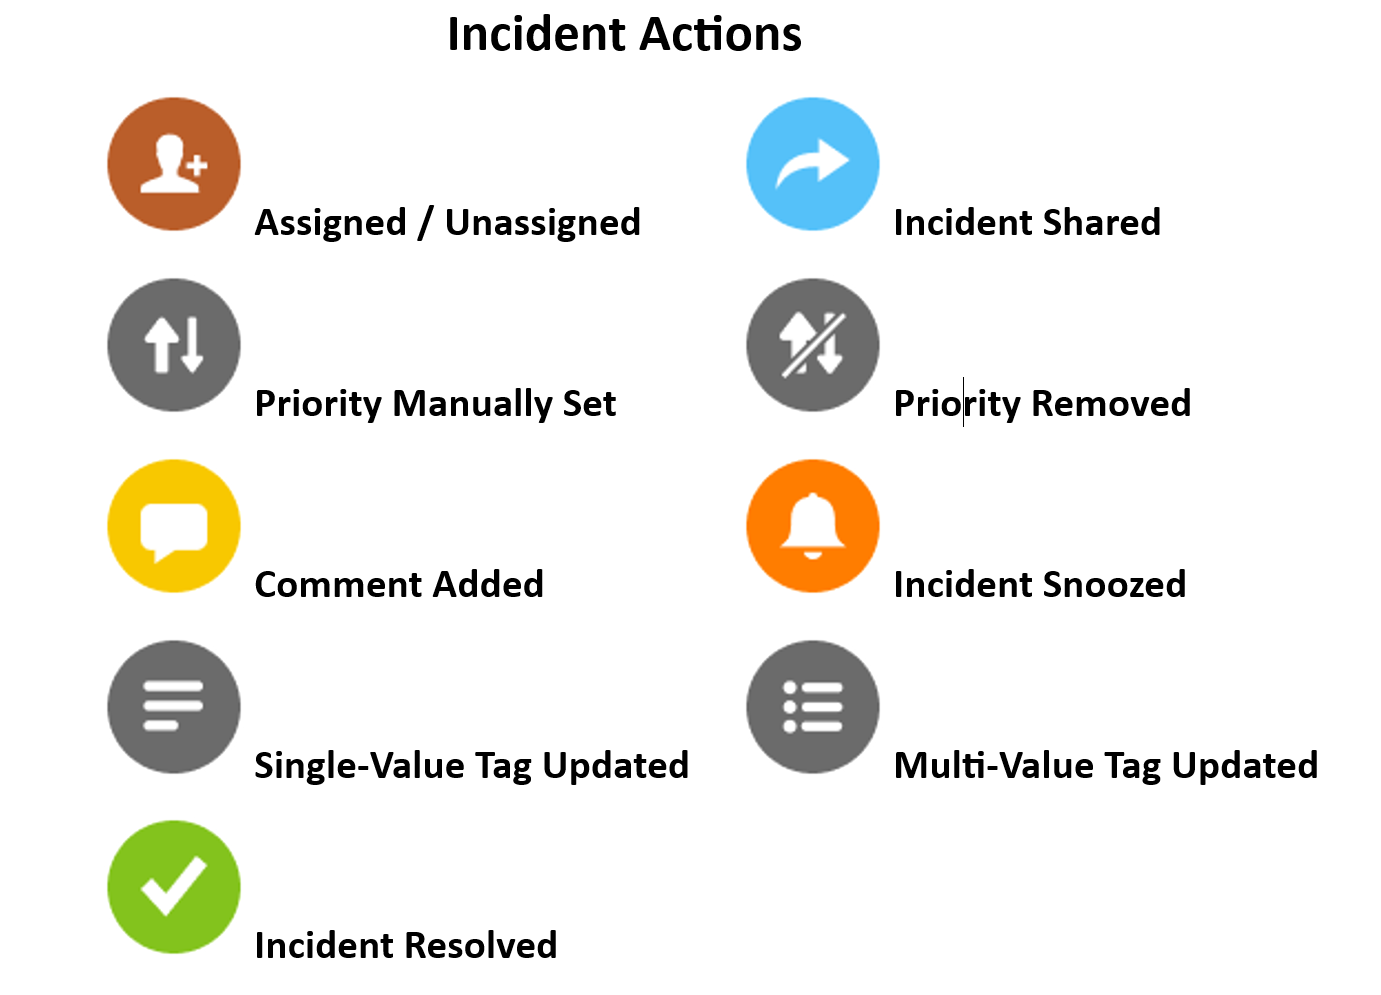
Timeline Activity Icons
Icon | Description |
|---|---|
Orange bust with plus | The incident was assigned to a user. |
Blue arrow | The incident was manually or automatically shared. |
Grey up and down arrows | The incident priority was manually updated. |
Grey up and down arrows with a line through them | The incident priority was manually removed. |
Yellow dialogue bubble | A comment was added to the incident. |
Orange bell | The incident was snoozed. |
Grey paragraph lines | A value was manually changed for a single-value tag. |
Grey bullet point lines | A value was manually added, changed, or removed for a multi-value tag. |
Green checkmark | The incident was manually resolved, or one of the included alerts was manually or automatically resolved. |
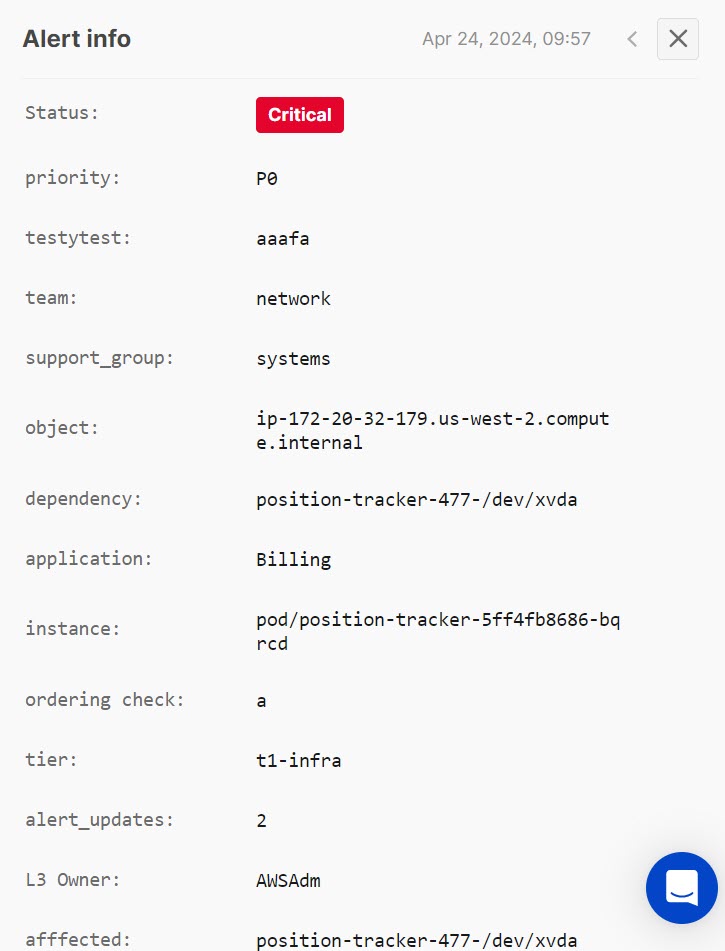
Alert Info
To see information about an event on the incident timeline, click a dot. This opens the Alert Info pane where you can view the complete details of the alert. To view the details of every status change of the alert, click the arrows at the top of the pane.
Next Steps
Learn additional details about the New Incident Console.
Find details about Incidents in BigPanda.
Dig into how Incidents are created with BigPanda AIOps