Monitoring Events
The Monitoring Events Dashboard gives you a deep dive into how BigPanda interacts with your monitoring tools, including event volumes per monitoring source and hour. The dashboard highlights the single pane of glass that BigPanda enables by consolidating all monitoring into a single platform.
You can use the dashboard to find trends related to monitoring tools and determine if any changes need to be made to underperforming tools.
Events in BigPanda
Monitoring tools generate events that are sent to BigPanda, which are then deduplicated before being formed into alerts. The dashboard displays the number of events before deduplication in BigPanda.
To learn more about events in BigPanda, see the Events to Incidents Lifecycle documentation.
Dashboard duplication
This dashboard can be duplicated. See the Manage Unified Analytics documentation to learn how to create a new dashboard from a copy.
Key Features
Use the Monitoring Events Dashboard to:
View the percent of event volume from each monitoring source
View trending events per day, hour, and day of the week
Identify low-volume monitoring tools for potential cost savings
Monitoring Events Widgets
Global date filter
The global date filter is based on the Events entity (event start date) by default, allowing event-based widgets to be filtered directly.
A script is applied to ensure that widgets calculating Changes or Actioned Incidents are filtered by the correct date:
Changes are filtered by
change update dateActioned Incidents are filtered by
first actioned date
The script applies the selected global date to each widget based on its own date column. Each widget is configured to use the correct date and ignore the default global filter. This ensures that each widget shows the correct data, even if the entities use different date fields.
The Monitoring Events dashboard contains the following widgets:
Widget | Description |
|---|---|
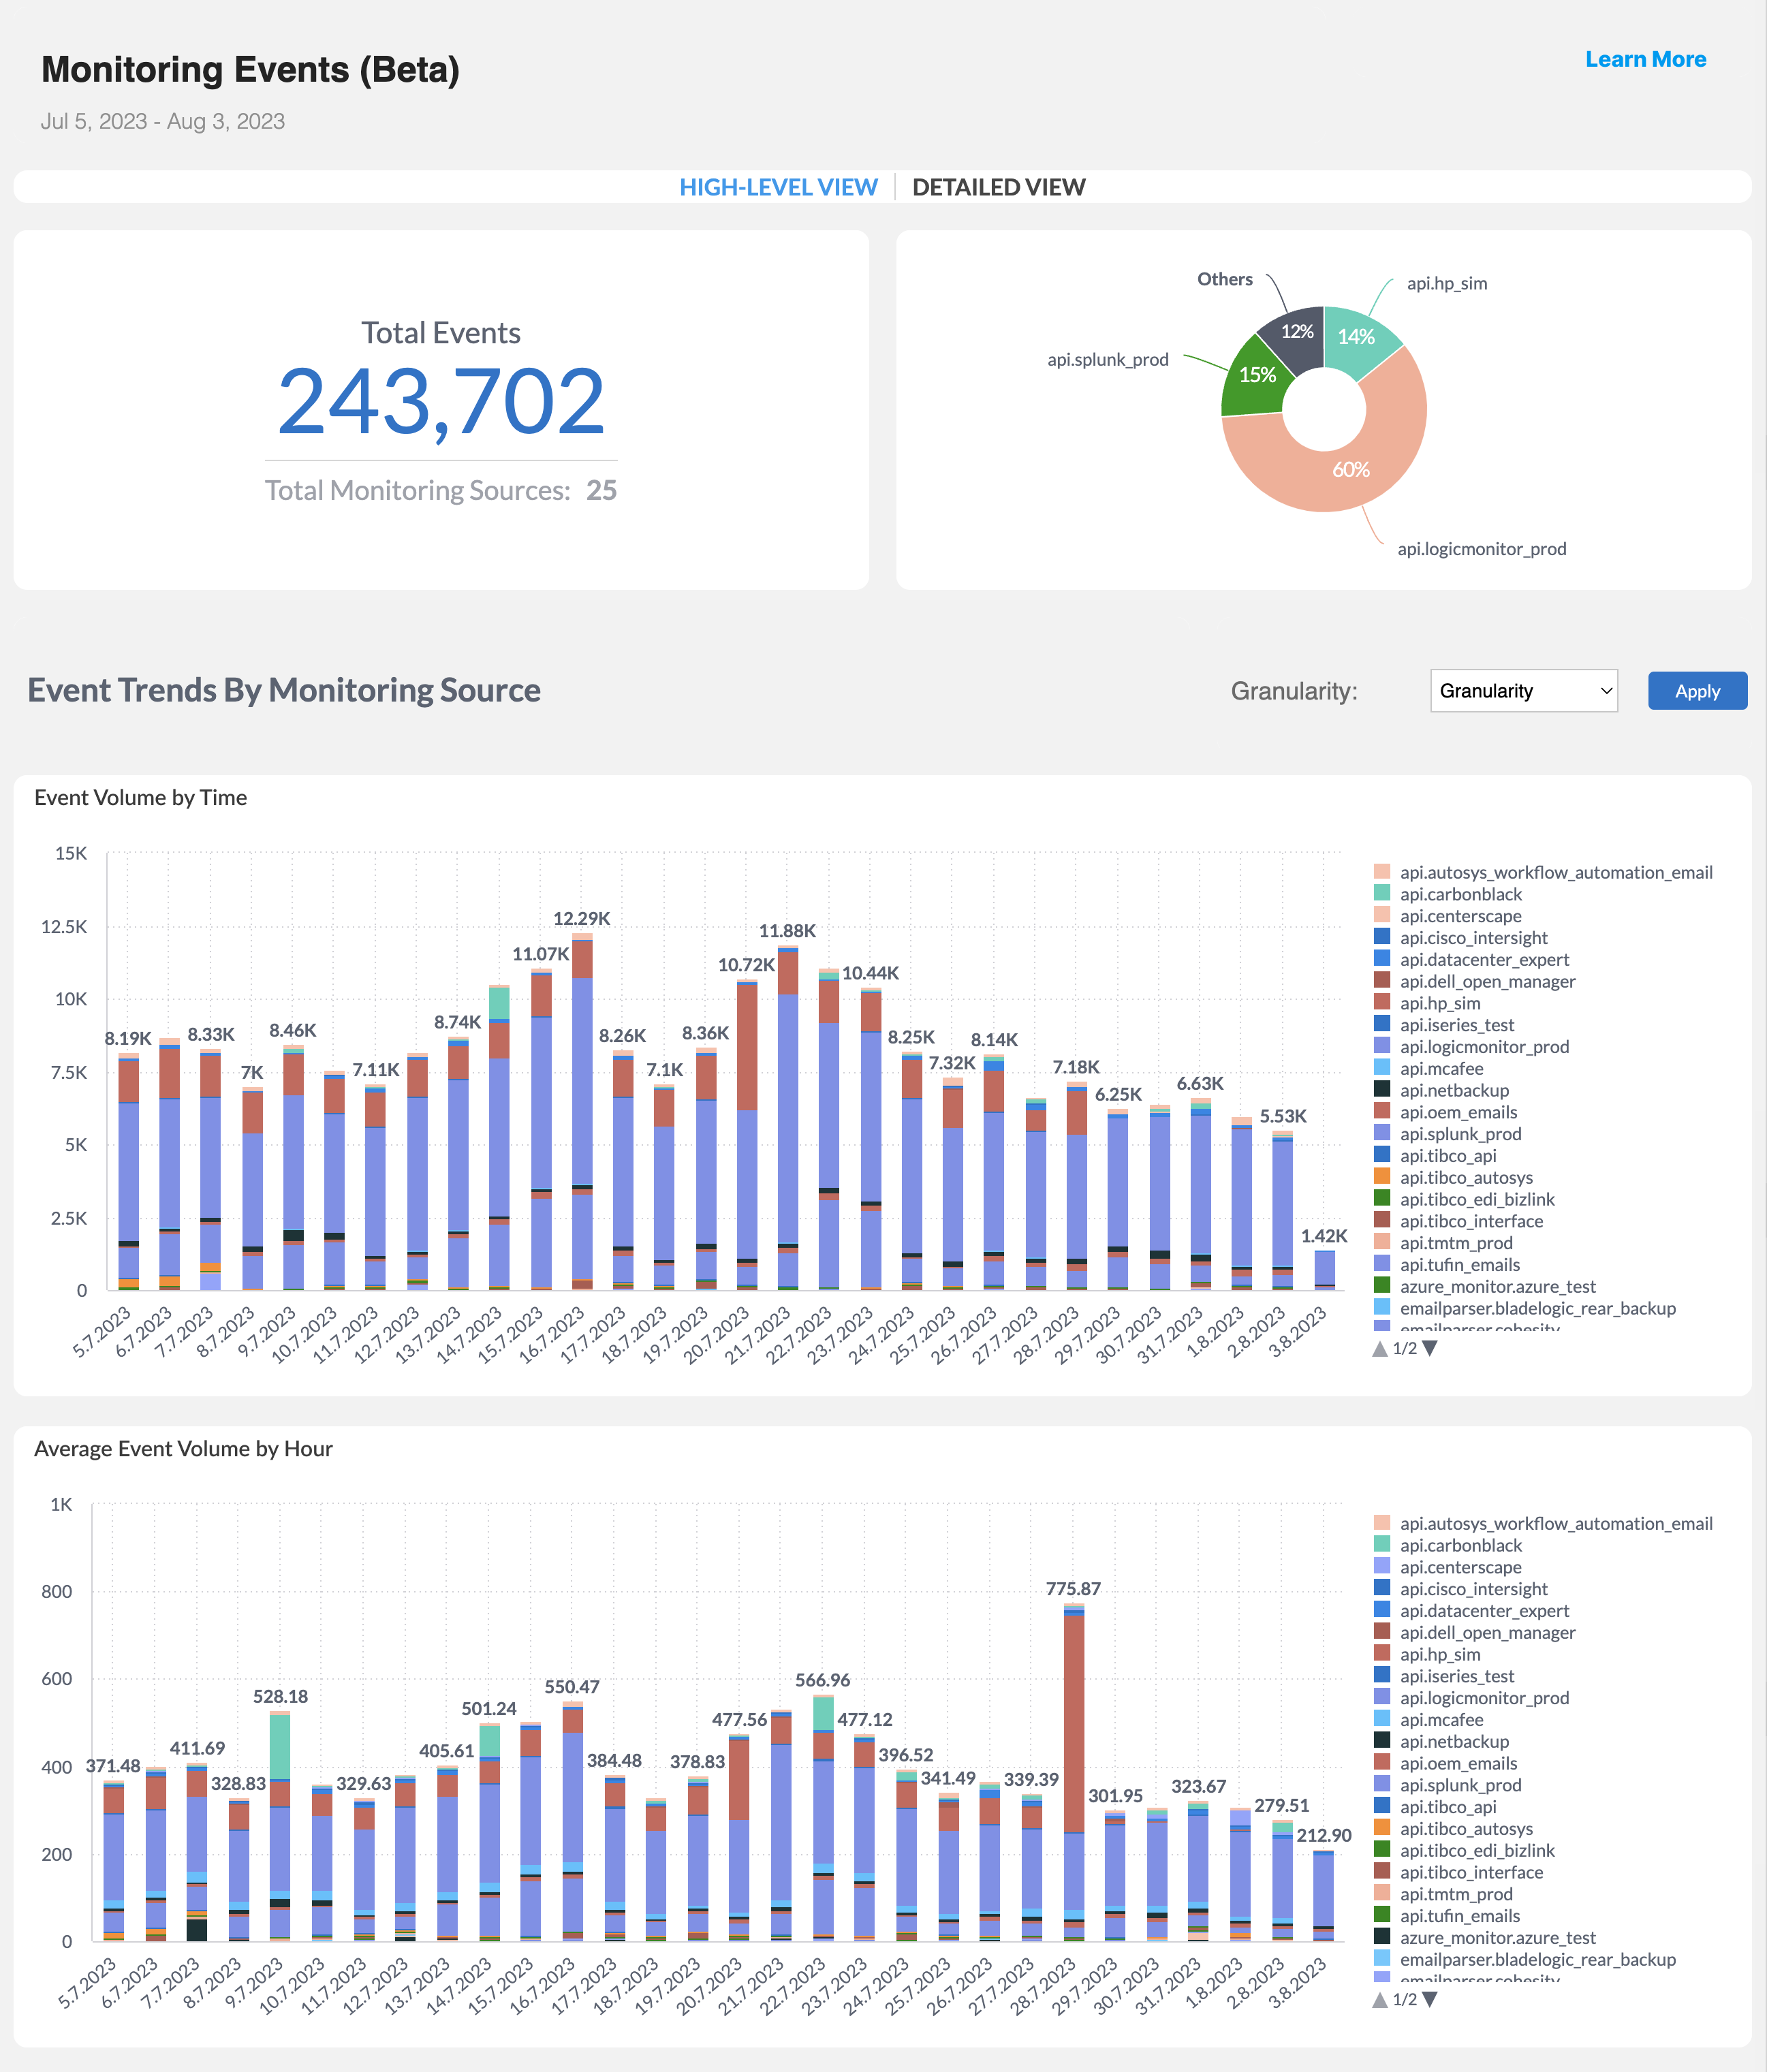
Count Monitoring Events | The total number of events sent to BigPanda, and the number of configured monitoring sources. |
Events Count by Monitoring Source (High-level View) | To view this widget, select High-Level View. Displays a pie chart displaying the percent of events received from each monitoring source. To view the total number from a monitoring source, click a specific section. Monitoring sources sending less than 3 percent of the total number of events can be found by clicking Others. |
Events Volume by Monitoring Source (Detailed View) | To view this widget, select Detailed View. Displays the number and percent of events received from each source system. |
Event Trends by Monitoring Source
The Granularity drop-down menu above the Event Trends by Monitoring Source widgets allows you to select the time period for the Events Volume by Time widget.
Select from Years, Quarters, Months, Weeks, Days, or Hours.
Widget | Description |
|---|---|
Event Count by Time | A bar graph displaying the total event volume by source system for the time period selected. Hover over a specific section in the bar graph to view the total number of events and percent of the total for a specific source system. |
Average Event Count by Time | Displays the average number of events received from each monitoring source for the time period selected. Hover over a specific section in the bar graph to view the average number of events and the average percent of the total for a specific source system. |
Next Steps
View Unified Analytics dashboards.
Learn how to Manage Unified Analytics.
Find definitions of Unified Analytics key metrics.
Dive into potential reporting fields in the Standard Data Model documentation.