Unified Analytics Standard Data Model
BigPanda’s Standard Data Model (SDM) defines the data elements available in all standard and custom Unified Analytics dashboards. Unified Analytics uses transformed data tables for report metrics and data relationship mapping. These tables are built based on the life cycle of incidents within BigPanda.
Understanding the data model and data elements is key to building powerful custom dashboards that can help you visualize, track, and understand your operational metrics.
Key features of SDM include:
Pre-defined joins that automatically connect the data tables into a single object view
Standardized terms and metrics to drive consistency across the platform
Pre-aggregated calculations that allow you to quickly see results rather than waiting for queries to return
Full management and support by BigPanda to ensure maximum uptime and access
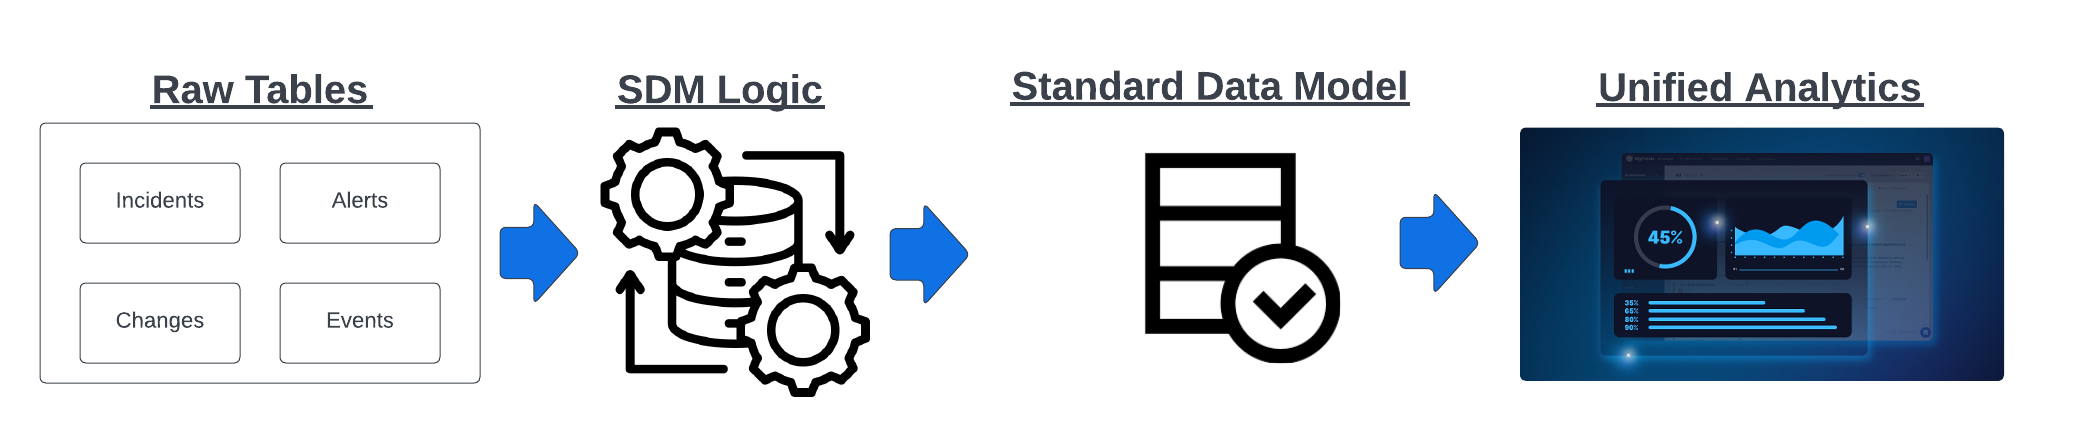 |
Standard Data Model Flow
Available Tables
Data model changes
Some of these data tables may have been adjusted to fit the custom tags of your organization.
Table Relationships to BigPanda Events
Alerts enter BigPanda (Entities)
Alerts are enriched with metadata and enrichment tags (Alert tags)
Alerts are correlated into BigPanda Incidents (Incidents)
Alerts are further enriched automatically and manually with Incident Tags (Incident tags)
The system and users take action on the incident, such as commenting, sharing, and entering or ending the flapping state (Incident activities)
The INCIDENT_START_DATE table is provided in our data model to enable multiple time zone support and is based on Incident Start Date.
The MTBF table provides aggregated metrics on the frequency of alerts at the Host/Check level for ease of reporting in the Mean Time Between Failures widget. For details on TTx metrics (assign, detect, resolve) for individual incidents, refer to the INCIDENT_PROCESSING table instead.
To learn more about how BigPanda deduplicates, correlates, and enriches alerts into incidents, see the Manage Alert Correlation documentation.
To learn more about how BigPanda processes, enriches, and resolves incidents, see the Incidents in BigPanda documentation.
To learn more about standard dashboards and using reporting tables in BigPanda, see the Unified Analytics and Unified Analytics Standard Dashboards documentation.
Primary keys
In the tables below, column names written in bold text are the primary key for the table.
ALERT_ENRICHMENTS
Use the ALERT_ENRICHMENTS table to find a list of ALERT_IDs and the Enrichment Maps that they were enriched by.
Column Name | Description | Data Type |
|---|---|---|
ALERT_ID | The unique identifier of the alert. | Varchar |
LAST_ENRICHED_EVENT_TIMESTAMP | The UTC time when the alert was last enriched. | Timestamp |
TAG_ENRICHMENT_ID | The unique identifier of the enrichment rule. | Varchar |
TAG_ENRICHMENT_TYPE | The type of enrichment rule. | Varchar |
ALERT_PROCESSING
All tags of an alert with normalized fields.
Column Name | Description | Data Type | Notes |
|---|---|---|---|
ALERT_ID | The unique identifier of the alert. | Varchar | |
ALERT_START_MINUTE | The unix time of when the alert started, in minutes. | Number | |
ALERT_STATUS_CHANGES | The number of times the alert has changed status. | Number | Status count includes the initial status. Changes to the “ok” statuses are not counted. For example, if an alert has an initial status of |
INCIDENT_ID | The unique identifier of the incident. | Varchar | |
PROCESSING_DATE | The date when the data was inserted into the data warehouse. This column is the cluster key for this table. | Date | |
PROCESSING_TIME | The time when the data was inserted into the data warehouse. | Timestamp | |
SYS_IMPORT_TIME | The time when the row was inserted or updated. | Number |
ALERTS
Each alert is the aggregated group of deduplicated events in BigPanda. See Alerts for more information.
Column Name | Description | Data Type | Notes |
|---|---|---|---|
ALERT_DEDUP_KEY | Field used to identify duplicate incoming alerts. | Varchar | |
ALERT_END_DATE_TIME_UTC | The date/time when the alert resolved. | Varchar | |
ALERT_END_TIME_EPOCH | The unix time of the alert resolution. | Number | |
ALERT_HIGHEST_SEVERITY | The highest status the alert reported at any time. | Varchar | Can be used to find alerts that were critical at any point. |
ALERT_ID | The unique identifier of the alert. | Varchar | |
ALERT_LAST_CHANGED_TIME_EPOCH | The unix time of the last change made to an alert. | Number | |
ALERT_START_DATE_TIME_UTC | The date/time that the alert started. | Varchar | |
ALERT_START_TIME_EPOCH | The unix time that the alert started. | Number | |
ALERT_STATUS | The current status of the alert. | Varchar | One of: Ok Critical Warning |
alert tag columns * | String value of an alert tag, defined by the column name. | Varchar | The alert tags that are listed in Unified Analytics reporting are dynamic and will depend on your organization’s enrichment tags. Alert tags always start with an underscore ( Each tag will have its own value column. For example, you may see columns for |
BP_ALERT_QUALITY | BigPanda categorizes alert quality based on the amount of enrichment or context available. | Varchar | High Quality Alerts - The most actionable type of alert with all important data needed for a team to triage and resolve the alert. High quality alerts usually include data on both technical and business context. Medium Quality Alerts - An alert that contains the minimum level of information and technical context to support operator action. These alerts lack some valuable elements such as business context, dependencies, or resolution steps. Low Quality Alerts - Alerts that lack key information or which were identified as irrelevant or misconfigured. |
BP_BUSINESS_CATEGORY | A logical type of alert that can be connected to a meaningful function, service, or a recurring topic. This can be a function such as, application, infrastructure, service, etc. It can also be a more technical alert category such as latency, load, etc. | Varchar | Default fields are:
|
BP_BUSINESS_SEGMENT | A business portion or unit that drives unique action or functionality. | Varchar | For example, a high-level Business Unit, Team, Group, or Organization. Default fields are:
|
BP_CONFIG_ITEM | An aggregated field used to capture the relevant configuration item. | Varchar | Default fields are:
A custom field can also be set. |
EVENT_COUNT | The total number of events within an alert. | Number | The event count number is calculated before deduplication and event marshalling. |
HAS_MAINTENANCE_EVENT | Indicates whether the alert has had any maintenance events in the past. | Boolean | |
INCIDENT_ID | The unique identifier of the incident. | Varchar | Key used to connect the incident table. |
IS_MAINTENANCE | Indicates whether there is currently an active maintenance event associated with the alert. | Boolean | |
NON_OK_EVENT_COUNT | Total count of events per | Number | |
NUM_STATUS_CHANGES | Number of times an alert has changed statuses. | Number | |
PREV_START_TIME | The unix epoch time of when the previous alert started. | Number | |
PRIMARY_PROPERTY_KEY | The tag name of the primary property. | Varchar | |
PROCESSING_DATE | The date when the data was inserted into the data warehouse. | Date | |
PROCESSING_TIME | The time when the data was inserted into the data warehouse. | Timestamp | |
SEARCH_CHECK | Direct link to the BigPanda console querying the | Varchar | |
SEARCH_HOST | Direct link to the BigPanda console querying the | Varchar | |
SECONDARY_PROPERTY_KEY | The tag name of the secondary property. | Varchar | |
SOURCE_SYSTEM | The monitoring system that sent the alert. (cleaned) | Varchar | |
SOURCE_SYSTEM_CODE | The monitoring system that sent the alert. | Varchar | |
_SYS_IMPORT_TIME | The time when the row was inserted or updated. | Number | |
TAGS_JOIN_KEY | Concatenated | Varchar | Key used to connect the MTBF table. |
TIME_SINCE_PREV_ALERT | The amount of time that has passed since the previous alert. | Number | Appears as epoch time in seconds. |
CHANGES
Root Cause Changes (RCC) dramatically speeds up the process of identifying the changes that cause outages and incidents in your systems.
Column Name | Description | Data Type | |
|---|---|---|---|
CHANGE_DURATION | The duration of the change, in hours. | Number | |
CHANGE_ID | The unique identifier of the change. | Varchar | |
CREATED_AT | The unix time when the change was created. | Timestamp | |
CREATED_DATE | The date and time when the change was created. | Date | |
DAY_NAME | The name of the day the change was created. | Varchar | |
END_AT | The unix time when the change was ended. | Timestamp | |
IDENTIFIER | Unique identifier of the change. | Varchar | |
SOURCE_SYSTEM | The monitoring system that sent the change. | Varchar | |
START_AT | The unix time when the change was started. | Timestamp | |
STATUS | The status of the change. | Varchar | One of: In Progress Done Cancelled Planned |
SUMMARY | Summary of the change | Varchar | |
TICKET_HYPERLINK | The ticket URL. | Varchar |
ENRICHMENT_RULES
Mapping enrichment imports dynamic contextual information from external sources and adds that data to matching alerts.
Use the ENRICHMENT_RULES table to find information about your organization's enrichment maps. See Enrichment Maps for more information.
Column Name | Description | Data Type |
|---|---|---|
ENRICHMENT_ID | The unique identifier of the enrichment map. | Varchar |
ENRICHMENT_NAME | The name of the mapping enrichment rule. | Varchar |
TYPE | The type of enrichment rule. | Varchar |
UPDATED_AT | The UTC time when the enrichment rule was last updated. | Timestamp |
ENVIRONMENTS
BigPanda Environments group related incidents together for improved automation and visibility.
Column Name | Description | Data Type |
|---|---|---|
ENVIRONMENT_NAME | The name of the BigPanda environment. | Varchar |
ENVIRONMENT_ID | The system-generated ID of the BigPanda environment. | Varchar |
FACT_EVENT_COUNT
An event is a point in time that represents the state of a service, application, or infrastructure component.
Column Name | Description | Data Type | Notes |
|---|---|---|---|
ALERT_ID | The unique identifier of the alert. | Varchar | |
ALERT_STATUS | Indicates if an event was processed into an alert. | Varchar | Field will appear as NULL if the event wasn't processed into an alert. |
CREATED_AT | The unix epoch time when the event was created. | Timestamp | |
EVENT_COUNT | The total number of events. | Number | |
EVENT_STATUS | The event process status. | Varchar | |
INCIDENT_ID | The unique identifier of the incident. | Varchar | |
INCIDENT_STATUS | Indicates if an event was processed into an incident ("Incidents") or not (NULL). | Varchar | Field will appear as NULL if the event wasn't processed into an incident. |
SOURCE_SYSTEM | The name of the monitoring system that sent the alert. | Varchar |
INCIDENT_ACTIVITIES
An incident activity is a single action a user performs in BigPanda.
Column Name | Description | Data Type | Notes |
|---|---|---|---|
ACTIVITY_COMMENT | Comment included with an activity. | Varchar | |
ACTIVITY_ENVIRONMENT | The name of the environment where the activity took place. | Varchar | |
ACTIVITY_ID | The unique identifier of the activity. | Varchar | |
ACTIVITY_START_MINUTE | The unix time when the activity initiated in BigPanda. | Number | |
ACTIVITY_TYPE | The type of activity. | Varchar | The following activity types are available: assigned become-flapping closed commented entities-auto-resolve entities-resolve login manual-resolve merge new none removed reopen resolve shared snoozed split unassigned unsnoozed update upserted |
ASSIGNEE_USER_NAME | The BigPanda username of the person the incident was assigned to. | Varchar | Each time an incident is re-assigned, a new row appears in the table. |
CREATED_TIME | The unix time when the action was taken. | Number | |
CREATOR_USER_ID | The ID of the user that took the action in BigPanda. | Varchar | |
FLAPPING_STATE | Whether or not the related incident is flapping. | Varchar | True indicates that the incident is currently flapping. False indicates that the incident was flapping at one point but isn’t currently. N/A indicates that the incident has never been flapping. |
INCIDENT_ID | The unique identifier of the incident. | Varchar | |
IS_INCIDENT_ACTIVITY | Whether or not the activity was taken on an incident. | Boolean | |
IS_LOGIN_ACTIVITY | Whether or not the activity indicated a login to BigPanda. | Boolean | |
LOGIN_ID | The unique session ID of the BigPanda login. | Varchar | |
PROCESSING_DATE | The date when the data was inserted into the data warehouse. This column is the cluster key for this table. | Date | |
PROCESSING_TIME | The date time when the data was inserted into the data warehouse. | Timestamp | |
SHARE_AUTO | Whether the related incident was AutoShared. | Boolean | |
SHARE_TARGET | The name of the system the related incident was shared to. | Varchar | |
SHARED_ACTIVITY_TARGET_SYSTEM_CODE | BigPanda’s unique identifier of the system the related incident was shared to. | Varchar | |
START_DATE | The start date of the activity or BigPanda login. | Timestamp |
INCIDENT_PROCESSING
Pre-aggregated metric totals for Time to Assign / Detect / Resolve (TTA, TTD, and TTR)
Column Name | Description | Data Type |
|---|---|---|
INCIDENT_ID | The unique identifier of the incident. | Varchar |
INCIDENT_START_HOUR | The unix time of when the incident started, in hours. | Number |
INCIDENT_START_MINUTE | The unix time of when the incident started, in minutes. | Number |
PROCESSING_DATE | The date when the data was inserted into the data warehouse. This column is the cluster key for this table. | Date |
PROCESSING_TIME | The date and time when the data was inserted into our data warehouse. | Timestamp |
RECORD_TIME | The date and time when the data was updated. | Timestamp |
_SYS_IMPORT_TIME | The time when the row was inserted or updated. | Number |
TIME_TO_ASSIGN_MINS | The number of minutes it took to assign the incident. | Number |
TIME_TO_ENGAGE_MINS | The number of minutes before action was taken on the incident. | Number |
TIME_TO_RESOLVE_MINS | The number of minutes it took to resolve the incident. | Number |
INCIDENT_START_DATE
This table is provided to enable multiple time zone support and is based on the incident start date.
Time Zones
Individual time zone fields are available for the DATE, DAY_NUM, DAY_NAME, and INCIDENT_START_FILTER columns.
The following time zones are available:
Time Zone Code | Time Zone Name | Time Offset |
|---|---|---|
UTC | Coordinated Universal Time | UTC |
EGT | East Greenland Time | UTC -1 |
HST | Hawaii Standard Time | UTC -10 |
SST | Samoa Standard Time | UTC -11 |
PMDT | Pierre & Miquelon Daylight Time | UTC -2 |
ART | Argentina Time | UTC -3 |
NST | Newfoundland Standard Time | UTC -3:30 |
AST | Atlantic Standard Time | UTC -4 |
EST | Eastern Standard Time | UTC -5 |
CST | Central Standard Time | UTC -6 |
MST | Mountain Standard Time | UTC -7 |
PST | Pacific Standard Time | UTC -8 |
AKST | Alaska Standard Time | UTC -9 |
CET | Central European Time | UTC +1 |
AEST | Australian Eastern Standard Time | UTC +10 |
NZST | New Zealand Standard Time | UTC +12 |
NZDT | New Zealand Daylight Time | UTC +13 |
LINT | Line Islands Time | UTC +14 |
EET | Eastern European Time | UTC +2 |
EAT | Eastern Africa Time | UTC +3 |
AMT | Armenia Time | UTC +4 |
PKT | Pakistan Standard Time | UTC +5 |
BST | Bangladesh Standard Time | UTC +6 |
ICT | Indochina Time | UTC +7 |
HKT | China Standard Time | UTC +8 |
JST | Japan Standard Time | UTC +9 |
India | India Standard Time | UTC +5:30 |
SGT | Singapore Time | UTC +8 |
INCIDENT_START_DATE Fields
Column Name | Description | Data Type | Notes |
|---|---|---|---|
DATE | The translated event time. Multiple time zones are available for this field. | Timestamp | |
DAY_NUM | The numerical day of the week that the system event occurred. Multiple time zones are available for this field. | Number | 0=Sunday - 6=Saturday |
DAY_NAME | The name of the weekday that the system event occurred. Multiple time zones are available for this field. | Varchar | Example: Monday, Tuesday, etc. |
MONTH_START_UTC | The first day of the month. | Timestamp | |
DATE_RANK_MONTH_UTC | The month of the incident start time (UTC) in numeric format. | Number | |
INCIDENT_START_FILTER | The translated event time. Multiple time zones are available for this field. | Timestamp | This field should only be used in filters, not dashboard widgets. |
UNIX_TIMESTAMP | The incident epoch unix start time. (UTC). | Number |
INCIDENTS
A single BigPanda incident.
Incident tags
Since custom incident tags can be added to the standard data model, each organization may have variations in the INCIDENTS table.
Column Name | Description | Data Type | Notes |
|---|---|---|---|
ALERT_ACTIONABLE_SCORE | Numerical score that determines whether an alert is actionable or not. | Number | The
|
ALERT_QUALITY_SCORE | The alert quality score. BigPanda categorizes alert quality based on the amount of enrichment or context available. | Number | The following scores are used: Low quality = null Medium quality = 0 High quality = 1 |
AUTO_SHARE_COUNT | Number of times an incident was AutoShared. | Number | |
BP_INCIDENT_ACTIONABLE | An incident that contains high quality alerts enriched with both technical and business context. | Varchar | The following criteria is used to determine if an incident is actionable: - Explicitly defined as actionable using bp_v_actionable tag - Enriched with business context using the bp_v_business_segment tag - Incident was acted upon - Not defined as noise using the bp_v_alert_noise tag |
BP_INCIDENT_CLOSURE | The workflow status of an incident. | Varchar | Based on actions, incidents are categorized as: - Shared - The incident was manually shared - Auto Shared - The incident was AutoShared - Auto-Resolved - The incident was resolved externally - Missed - The incident resolved itself without intervention, no action was taken on the incident - No Action - The incident was resolved manually in BigPanda with no other incident action taken - Resolved in BP - Action was taken on the incident, and the incident was resolved within BigPanda - Still Open - Incident is still open |
BP_INCIDENT_OUTLIER | Incidents are set as an outlier if: Assign time is over a day Engage time is over a day Resolution time is over a week If an incident isn’t an outlier, the setting is Valid | Varchar | |
BP_INCIDENT_QUALITY | BigPanda categorizes alert quality based on the amount of enrichment or context available. | Varchar | High - The most actionable type of alert with all important data needed for a team to triage and resolve the alert. High quality alerts usually include data on both technical and business context. Medium - An alert that contains the minimum level of information and technical context to support operator action. These alerts lack some valuable elements such as business context, dependencies, or resolution steps. Low - Alerts that lack key information or which were identified as irrelevant or misconfigured. |
BP_INCIDENT_RESOLUTION_BUCKET | Incidents are placed in resolution buckets depending upon the time to resolve. | Varchar | Resolution buckets include the following: Still Open Under 5 min 5 - 30 min 30 - 60 min 1 - 4 hours 4 - 24 hours 1 - 7 days Over a week |
ENVIRONMENT_IDS | The unique identifier of the BigPanda environments associated with the incident. | Varchar | |
FIRST_ACTION | The unix time when the first action was taken on the incident. | Number | |
FIRST_AIA_ACTION_DATE | The date when the first AIA action took place on the incident. | Date | |
FIRST_BILLABLE_ACTION_DATE | The date when the first billable action took place on the incident. | Date | |
FIRST_BILLABLE_ACTION_TYPE | The type of the first actioned incident. Billable actions include Comments, Assignments to a user, and Manual or Automated Shares. | Varchar | |
FIRST_MANUAL_ACTION_TIME | Unix epoch time of when the first manual action on the incident took place. | Number | |
FIRST_MANUAL_ACTION_TYPE | The type of action first manually taken on the incident. | Varchar | |
FIRST_MANUAL_ACTION_USER_NAME | The name of user who performed the first manual action on the incident. | Varchar | |
INCIDENT_CLOSURE | The numerical closure status of an incident. | Number | The following statuses are used: 0 = Still Open 1 = Shared 2 = AutoShared 3 = Resolved in BP 4 = Auto-Resolved 5 = No Action |
INCIDENT_END_DATE_TIME_UTC | The date/time of the incident resolution. | Varchar | |
INCIDENT_END_TIME_EPOCH | The unix time of the incident resolution. | Number | |
INCIDENT_HIGHEST_SEVERITY | The highest severity status that the incident reached. | Varchar | Can be used to differentiate incidents that were critical at any point |
INCIDENT_HYPERLINK | URL of your organization’s "All incidents" environment and the incident ID spliced. | Varchar | Can be used in tables or aggregated tables to provide hyperlinks to the incident. |
INCIDENT_ID | The incident identifier. | Varchar | |
INCIDENT_LAST_CHANGED_TIME_EPOCH | The unix time of the last status change. | Number | |
INCIDENT_RESOLUTION_BUCKET_SCORE | Score of the incident resolution in minutes. | Number | The following scores are used: 1 = less than 5min 2 = less than 30min 3 = less than 60min 4 = less than 240min 5 = less than 1440min 6 = less than 10080min 7 = more than 10080min |
INCIDENT_START_DATE_TIME_UTC | The date/time that the incident started. | Varchar | |
INCIDENT_START_TIME_EPOCH | The unix time that the incident started. | Number | |
INCIDENT_STATUS | The current status of the incident. | Varchar | One of: Ok, Critical, or Warning |
IS_ACTIONED | Whether or not the incident was actioned. | Boolean | |
IS_AIA_ACTIONED | Whether an AIA action took place on the incident. | Boolean | |
MANUAL_CORRELATION | Determines if a BigPanda user manually correlated the incident in the UI. | Varchar | |
NORMALIZED_PATTERN_TAGS | The tags used in the correlation pattern. | Varchar | |
NUM_OF_ALERTS | The number of unique alerts correlated with the incident. | Number | |
PATTERN_WINDOW | The time window in which this pattern will correlate alerts together. | Float | |
SINGLE_DISPOSITION_INCIDENT_ID | Shows the incident_id if the activity_type is one of the following: - split - merge - snoozed - commented - assigned - manual-resolve - shared | Varchar | |
SUGGESTED_BY_BIGPANDA | Whether the incident has a change suspected by BigPanda. | Boolean | |
_SYS_IMPORT_TIME | The time when the row was inserted or updated. | Number | |
TIME_TO_ASSIGN_MINS | The number of minutes it took to assign the incident. | Number | |
TIME_TO_ENGAGE_MINS | The number of minutes before action was taken on the incident. | Number | |
TIME_TO_RESOLVE_MINS | The number of minutes to resolve the incident. | Number | |
TOTAL_MERGE | Total number of incident merges. | Number | |
TOTAL_SPLIT | Total number of times an incident was split. | Number |
MAINTENANCE_EVENTS
BigPanda events associated with a maintenance plan.
Column Name | Description | Data Type |
|---|---|---|
EVENT_ID | System generated ID of the event. | Varchar |
MAINTENANCE_ALERT_ID | ID of the alert affected by the maintenance plan. | Varchar |
MAINTENANCE_PLAN_ID | Unique identifier of the maintenance plan. | Varchar |
PROCESSING_DATE | The date when the data was inserted into the data warehouse. This column is the cluster key for this table. | Date |
PROCESSING_TIME | The date and time when the data was inserted into the data warehouse. | Timestamp |
MAINTENANCE_PLANS
Maintenance plans used to silence alerts in BigPanda.
Column Name | Description | Data Type |
|---|---|---|
CONDITION | The BPQL condition used to define which alerts should be suppressed during the maintenance period. | Variant |
CREATED_AT | The date and time when the maintenance plan was created. | Timestamp |
CREATED_BY | The user who created the maintenance plan. | Varchar |
CUSTOM_TAGS | Custom tags used by your organization. | Variant |
DESCRIPTION | Description of the maintenance plan. | Varchar |
END_TIME | The unix time that the maintenance period ended. | Timestamp |
FREQUENCY | How often the maintenance plan has run. | Varchar |
MAINTENANCE_KEY | System generated unique identifier for the maintenance plan. | Varchar |
MAINTENANCE_PLAN_ID | System generated unique identifier for the maintenance plan. | Varchar |
PLAN_NAME | The name of the maintenance plan. | Varchar |
PROCESSING_DATE | The date when the data was inserted into the data warehouse. This column is the cluster key for this table. | Date |
PROCESSING_TIME | The date and time when the data was inserted into the data warehouse. | Timestamp |
START_TIME | The unix time that the maintenance plan started. | Timestamp |
UPDATED_AT | The unix time when the maintenance plan was last updated. | Timestamp |
UPDATED_BY | The user who last updated the maintenance plan. | Varchar |
MTBF
Mean Time Between Failures. Calculations to assist with querying the Alert Analysis Report.
This table represents aggregated results of the data in the Incident Metrics table. See Unified Analytics Key Metrics for more information about MTBF.
Column Name | Description | Data Type |
|---|---|---|
MTBF_CHECK | The check tag (not normalized). | Varchar |
MTBF_HOST | The host tag (not normalized). | Varchar |
MTBF_LAST_SEEN | The date/time that the mean time between failures was last seen. | Varchar |
MTBF_MEAN_TIME_BETWEEN_FAILURES_HRS | The mean time between failures, in hours. | Number |
MTBF_OCCURRENCES | The number of times mean time between failures occurred. | Number |
TAGS_JOIN_KEY | Field used to connect MTBF data to the alert. | Varchar |
USERS
Users who perform actions on an incident.
Column Name | Description | Data Type |
|---|---|---|
CREATED_AT | The date and time when the user was created. | Timestamp |
DELETED | Whether or not the user account was deleted. | Boolean |
The email address of the user who performed the action. | Varchar | |
FIRST_LOGIN | The date and time when the user first logged in to BigPanda. | Timestamp |
LAST_LOGIN | The date and time when the user metadata was last updated. | Timestamp |
NAME | The BigPanda UI name of the user who performed the action. | Varchar |
PROCESSING_TIME | The date and time when the data was inserted into the data warehouse. | Timestamp |
ROLES | The access roles assigned to the user who performed the action. | Varchar |
USER_ID | The unique identifier of the user who performed the action. | Varchar |