BigPanda Analytics
BigPanda Analytics help IT operations teams explore, analyze and share operational data. Ask questions in plain language, explore metrics on demand, and rapidly create visualizations. Users can explore, create, and share insights through governed data models. This makes analytics available to more teams without sacrificing consistent definitions or access controls.
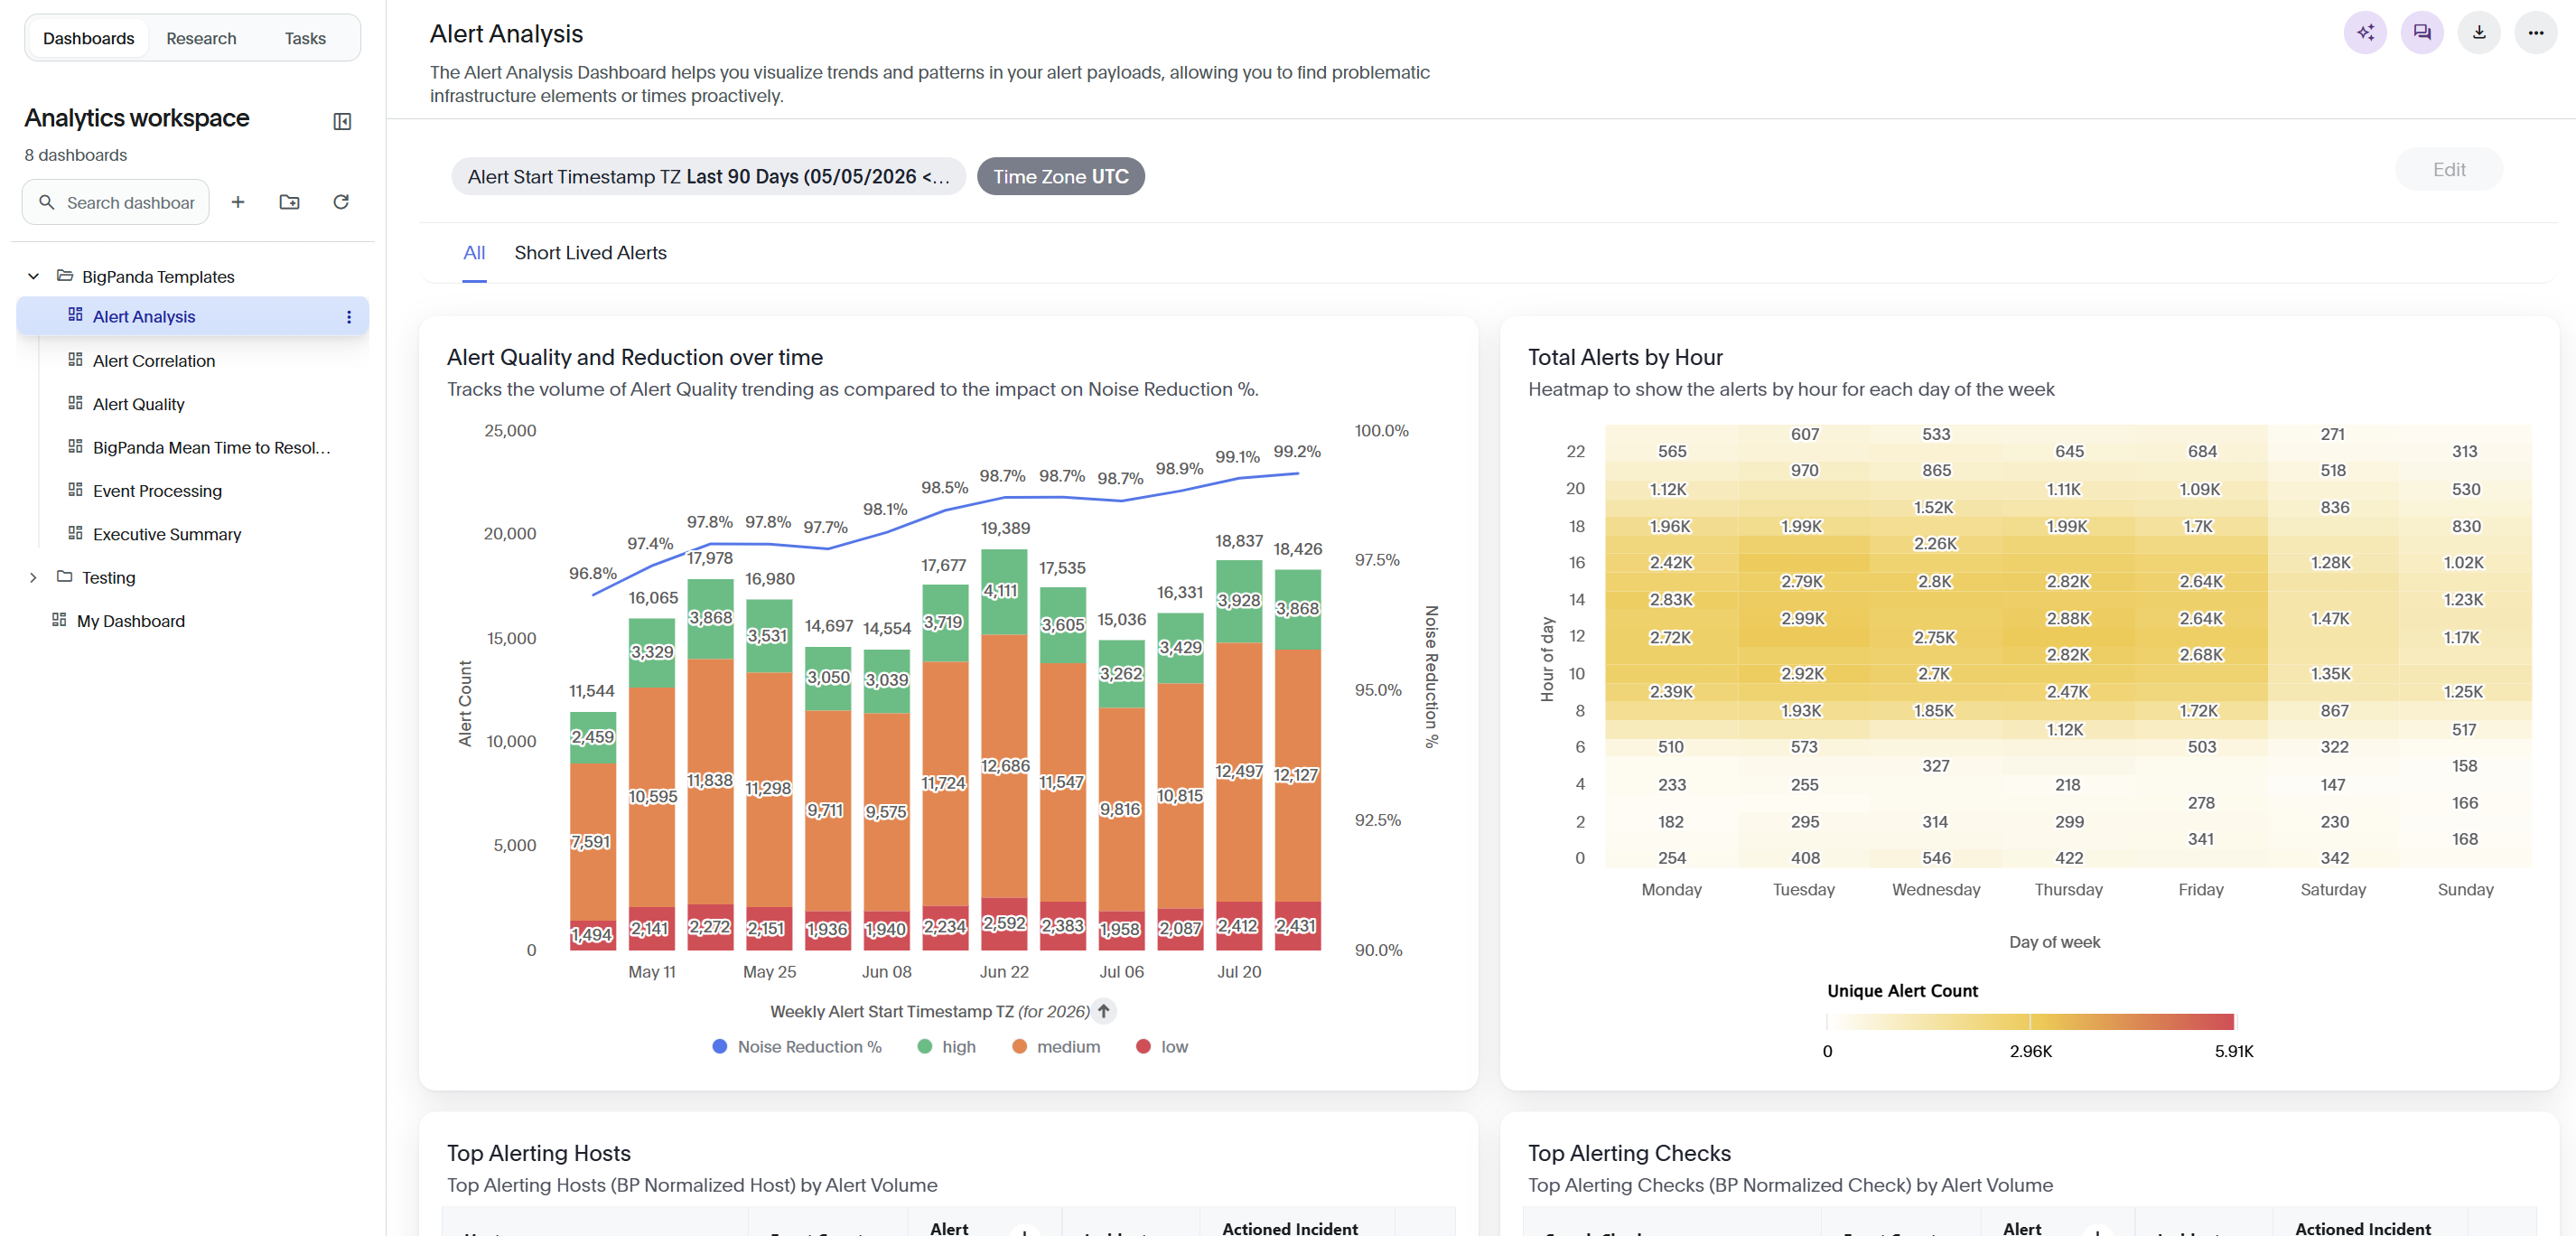
The platform combines a natural-language AI assistant, self-service analytics, and auto-refreshing dashboards built on a shared semantic layer.
Key features
View dashboards: Explore template dashboards built around common reporting needs, and drill into color-coded widgets to spot trends.
Create custom dashboards: Design your own dashboards and widgets that reflect the unique tags and configuration settings your organization uses in BigPanda.
Schedule and share reports: Email dashboard snapshots to stakeholders on a recurring schedule.
Research your data: Investigate analytics data directly to answer ad hoc questions and dig into specific trends.
View dashboards
Dashboards give your team insight and visualizations to take your IT Operations to the next level. Metrics are displayed in visually clear, color-coded widgets, making it easy to gain insight into hot spots in your environment and see how BigPanda correlates alerts into actionable incidents.
The dashboards are designed to help you recognize trends and patterns in your ITOps monitoring space. Users with access to the Analytics tab can toggle between dashboards with a single click. All dashboards can be filtered by date granularity, by source system, and by incident start time.
Dashboards are made up of widgets, or individual data visualizations such as charts, graphs, and tables. Depending on the widget, you can drill down into the data, open the widget in full screen, download a snapshot of the widget data, see when the data was last refreshed, and view relevant automatic data analysis directly in the BigPanda UI.
To learn more, see the View Dashboards documentation.
BigPanda template dashboards
Analytics includes pre-built dashboards that are designed around the unique reporting needs of a busy ITOps team and focus on data vital to maintaining monitoring efficacy.
The following template dashboards are available:
Alert Analysis
Alert Correlation
Alert Quality
BigPanda Mean Time to Resolve
Event Processing
Executive Summary
Create custom dashboards
BigPanda provides dashboard templates configured to cover the most common analytics needs.
A user with full analytics permissions can create custom dashboards that better reflect the unique tags and configuration settings your organization uses in BigPanda.
Create a custom dashboard using existing standard dashboards as a template, or from scratch.
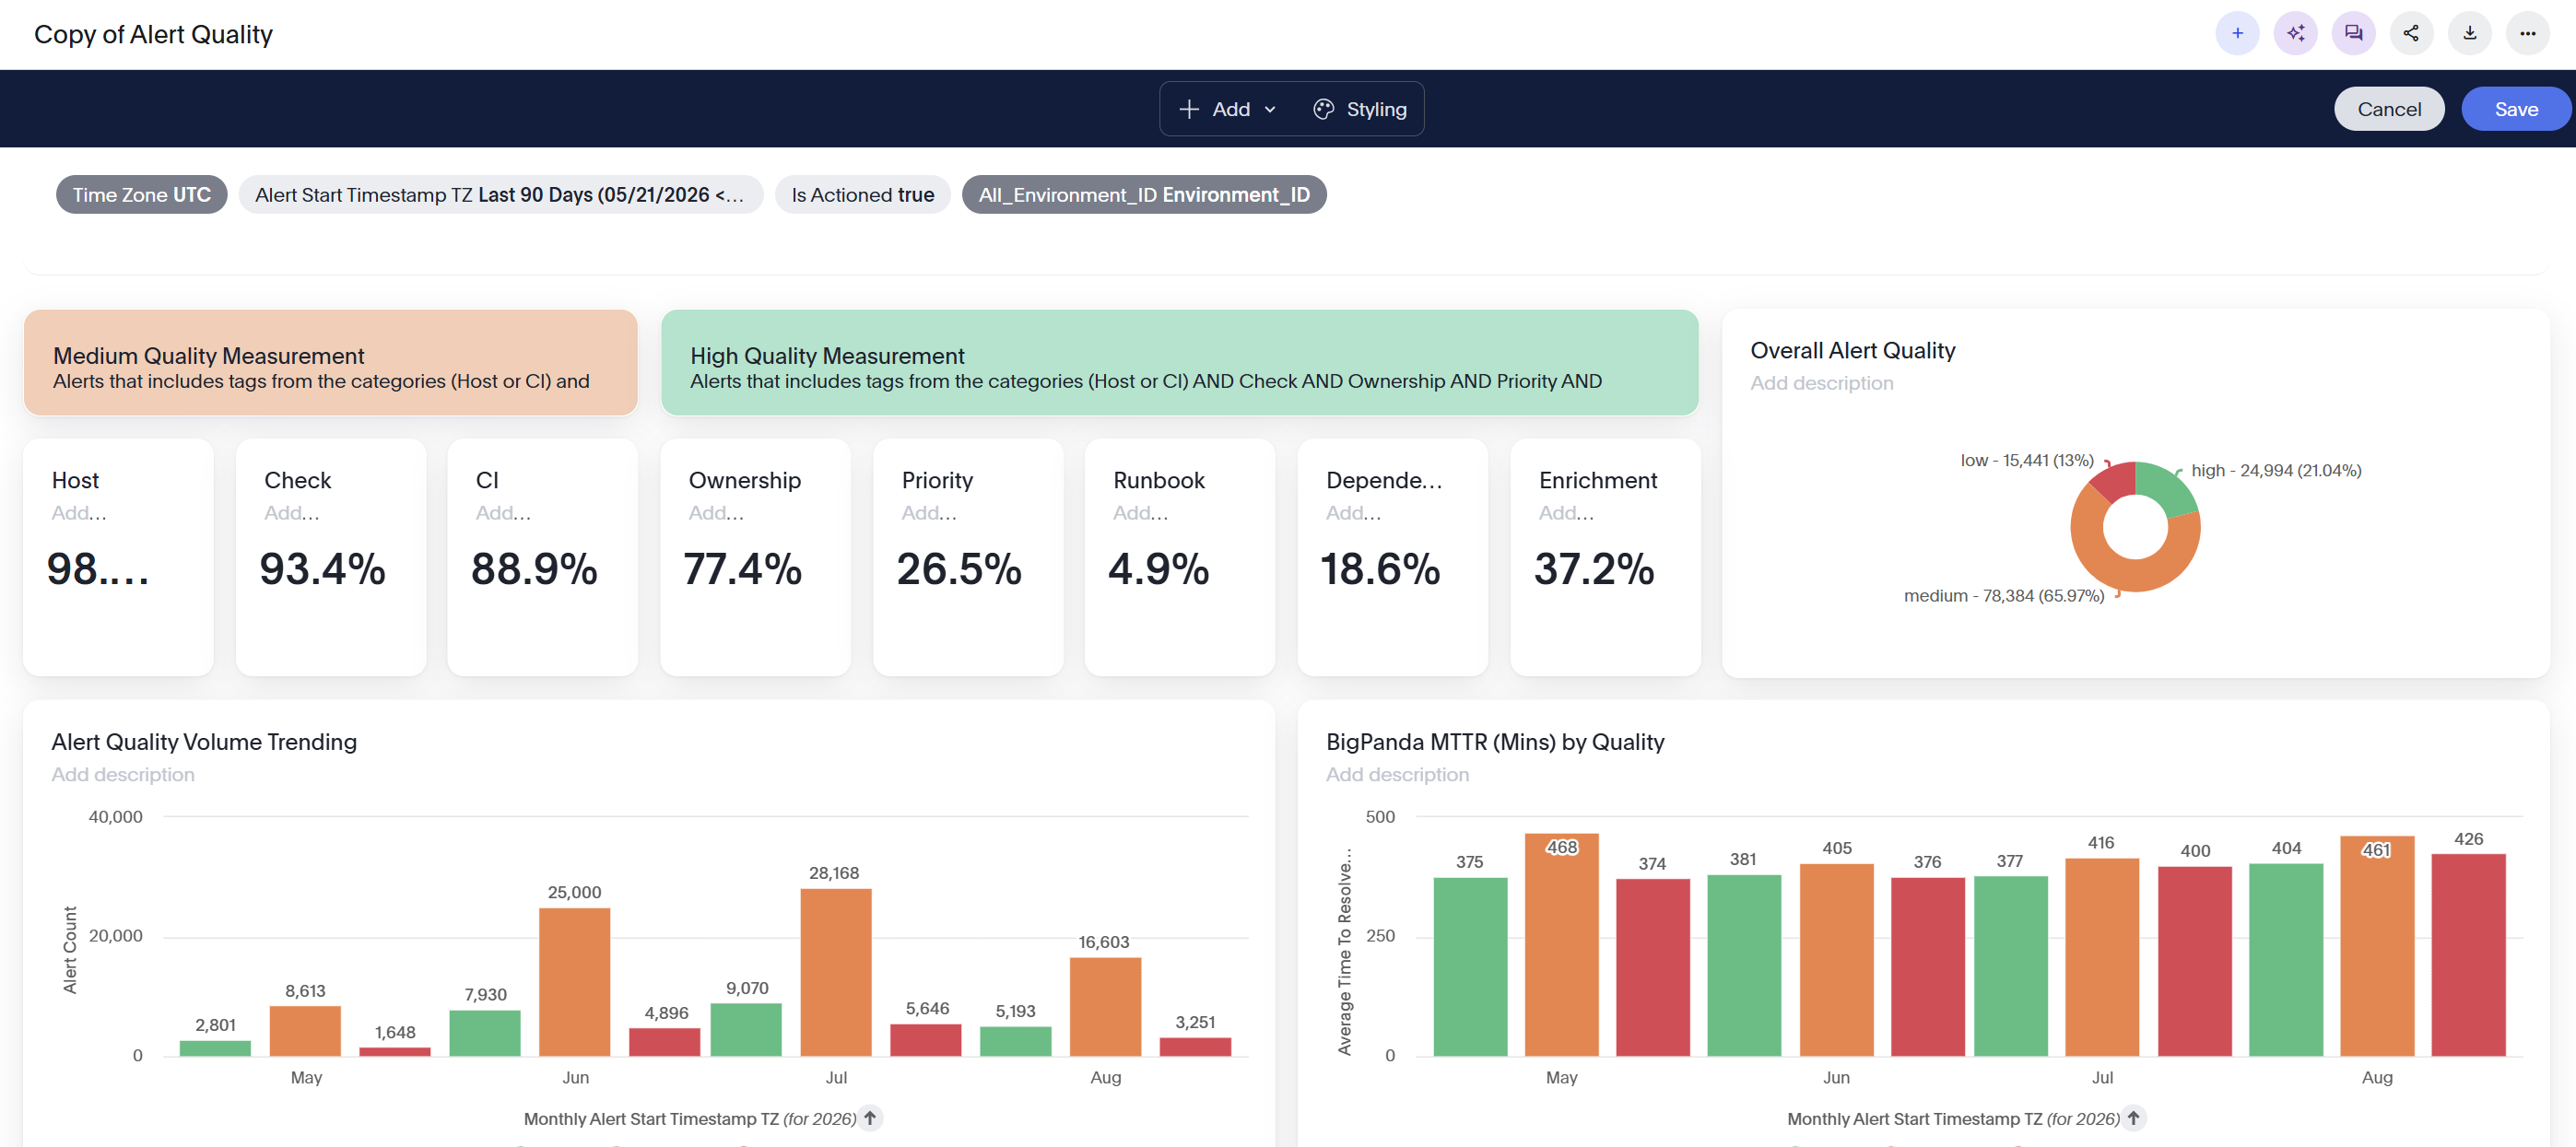
To learn more, see the Create Analytics Dashboards documentation.
Schedule and share reports
The Reports tab in Analytics lets you schedule and send dashboard snapshots to stakeholders via email, even if they don't have a BigPanda account. This allows stakeholders to see how KPIs and metrics are trending over time.
You can set up advanced reporting schedules, including hourly, daily, weekly, and custom options.
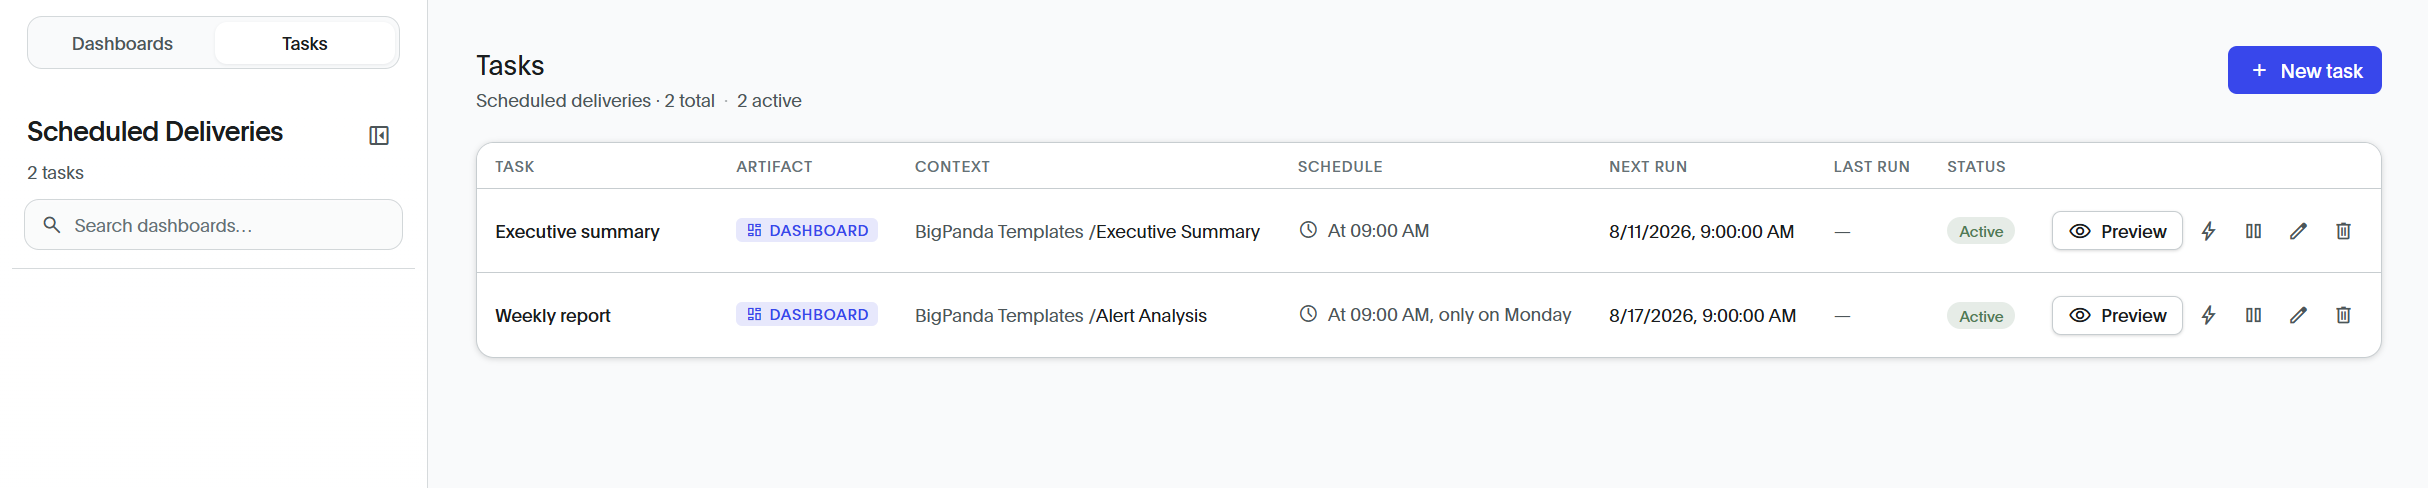
To create a report, navigate to Analytics and click the Reports tab.
To learn more, see the Analytics Reports documentation.
Research tab
The Research tab lets you explore your BigPanda operational data by asking questions in plain language, without building a dashboard or writing a query. Describe what you want to know, and the AI Assistant returns a written summary that explains the finding in context, along with a supporting visualization.
AI-powered analytics preview
We're actively making improvements. Specific features, limits, and availability may change as the product matures.
In the Research tab, you can:
Ask questions about your incidents, alerts, services, trends, and KPIs in natural language, such as
Why is MTTR climbing this quarter?orWhich services are degrading over time?.Review AI-generated answers that include a written summary, an explanation of the calculation, and suggested follow-up analyses.
Ask follow-up questions within the same session to break down a result by day, week, status, or another dimension, keeping earlier questions in context.
Open any result as a live, interactive visualization to change the metric, adjust filters, switch the chart type, or pin it to a dashboard.
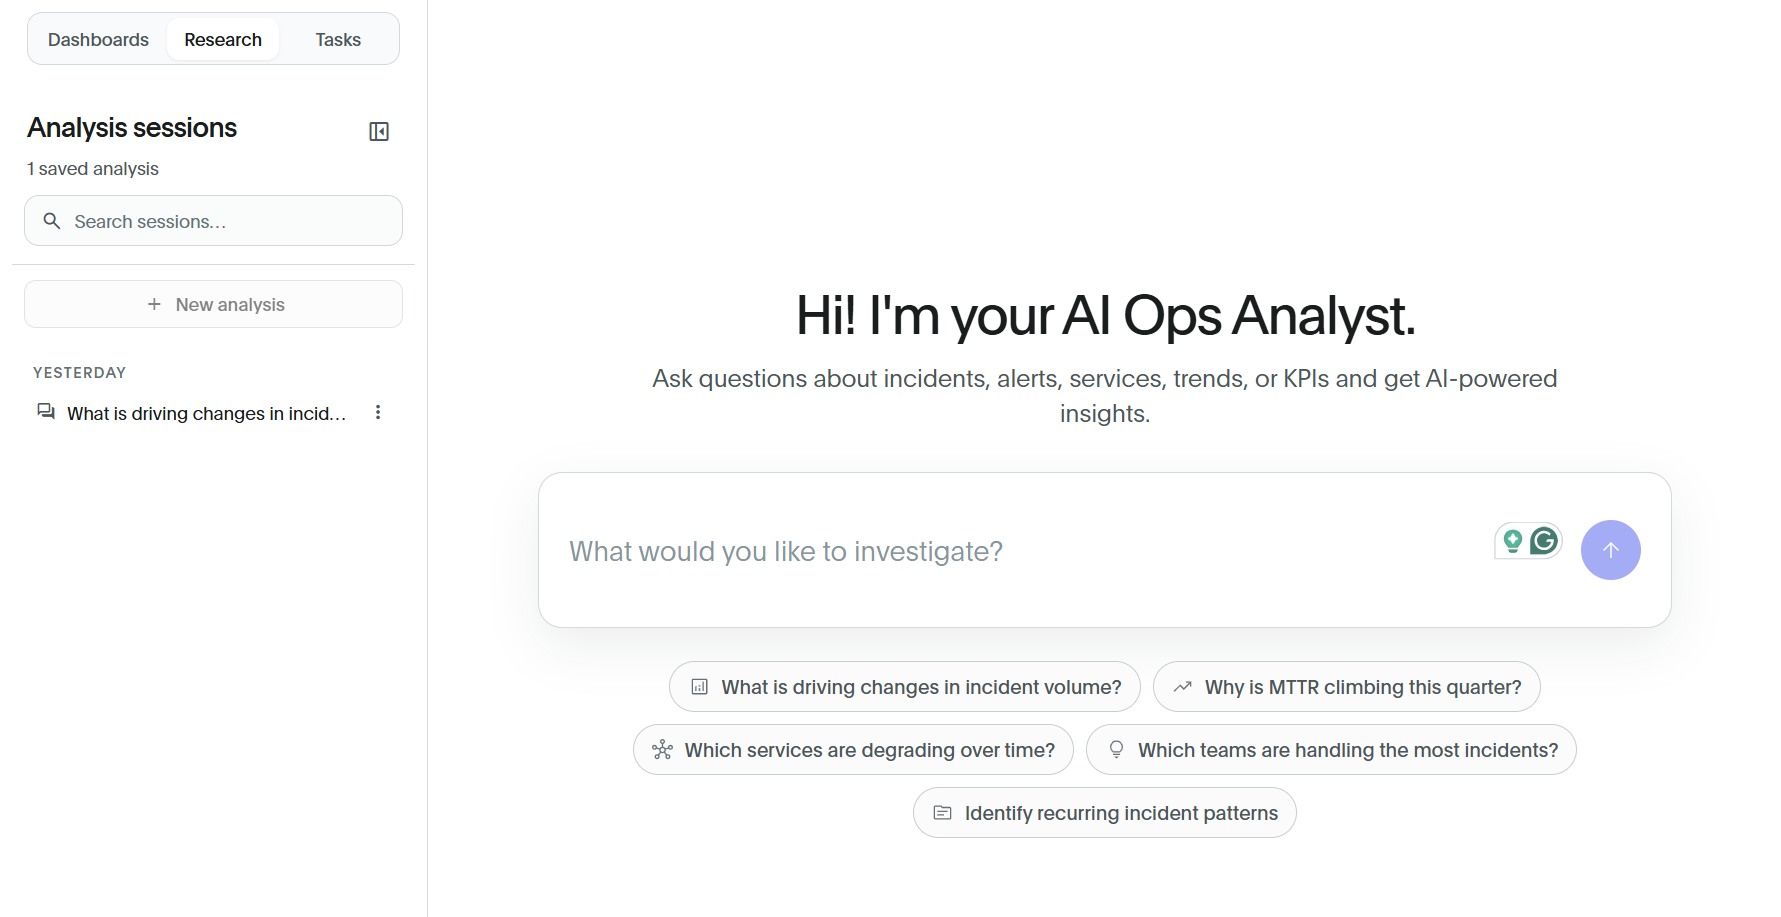
To learn more, see the Analytics Research Tab documentation.
The semantic layer
The Standard Data Model (SDM) is the foundation for every data point in Platform Intelligence. It defines key attributes, metrics, and relationships in business terms. This central model lets you work with clear concepts such as incidents, alerts, and impact, rather than database tables and schemas.
Consistent definitions: Metric and attributes use shared definitions across the platform, helping teams analyze data consistently.
Built-in data catalog: See available data points and their definitions directly in the interface. Select a field to view its description, sample values, and the dashboards that use it.
See the Standard Data Model documentation for more information.
FAQs
Analytics general FAQs
Is there a separate login for Analytics?
No. It's native inside BigPanda, no second sign-in and no separate analytics SSO.
What comes out of the box?
Six native dashboards are available, including Executive Summary, Alert Analysis, Alert Quality, Alert Correlation, Event Processing, and MTTR.
Is the data real-time?
No. The data is updated every six hours.
Is the number of alert tags limited?
The number of alert tags is limited to 5,000 per organization.
What user permissions are needed for Analytics?
BigPanda user accounts must have the Analytics permission to access Analytics.
Analytics migration FAQs
What happens on September 8th?
The new Analytics experience will be open for everyone. Customers who don't use the old analytics immediately get the new experience as their default. Everyone else keeps the old default until their migration is complete.
When does the default change?
As soon as your organization's migration is complete. This will occur between September 8th and November 16th.
Is there downtime at cutover?
No. The default flips once the migration is complete, and the old analytics remains and continues to work until November 16th.
What does read-only mean on Nov 16?
The old Analytics experience will be viewable only after November 16th. This means no new content, edits, or scheduled reports can be created in the old Analytics after this date.
When will the old Analytics experience be retired?
January 4, 2027. Anything not exported after that date will not be available, and saved links will stop working.
Do dashboards move across as-is?
Some dashboards may look or behave slightly differently after the migration.
How is "active" defined?
Dashboards with activity in the past 90 days, where activity means dashboard views, an active scheduled report, or both.
Why aren't the same fields, tags, or metrics that were in the old version of Analytics still available?
The standard data model was rebuilt rather than copied, so some fields and metrics are named or defined differently. Most fields have an equivalent, and where one is missing, the migration team can map it or add it.
AI Analytics features FAQs
Is AI available to everyone?
Yes, AI features are currently available to all customers as a preview. We're actively making improvements, so specific features, limits, and availability may change as the product matures.
Can a visualization from an AI conversation be pinned onto a dashboard?
Yes, from Research conversations.
What are Insights?
Insights are automatically generated summaries of a dashboard. It surfaces one to three short findings, each with a narrative, the supporting evidence, severity, and suggested follow-up questions. Clicking through takes you to the AI Analyst, where you can dig into that finding.
Do Insights update when I change filters or the time range?
Not automatically. Insights are cached, so changing the view offers a Refresh insights for this view option instead.
What is dashboard-level chat, and how is it different from the Research tab?
Dashboard chat is an AI Analyst pane scoped to the currently open dashboard, so questions are answered in the context of that dashboard's data. The Research tab is broader; it asks questions across the entire BigPanda semantic model rather than within a single dashboard.
Can AI features be disabled?
Yes. If you do not want to have AI features enabled, reach out to your BigPanda account team.
Analytics scheduled reports FAQs
What formats are supported in reports?
PDF, PNG, CSV, and XLSX.
Can a report go to someone without a BigPanda account?
Not currently. We plan to add this feature in a future release.
What happens to scheduled reports created in the old Analytics?
BigPanda will move scheduled reports as part of the migration.