Alert Quality
BigPanda measures alert quality by applying rules to check for attributes contributing to actionability. High quality alerts contain business and technical context that enables your team to effectively troubleshoot issues. Your alert quality impacts the amount of time it takes for your team to take action on issues, so sending high quality alerts to BigPanda is critical to giving operators the context they need to resolve incidents quickly.
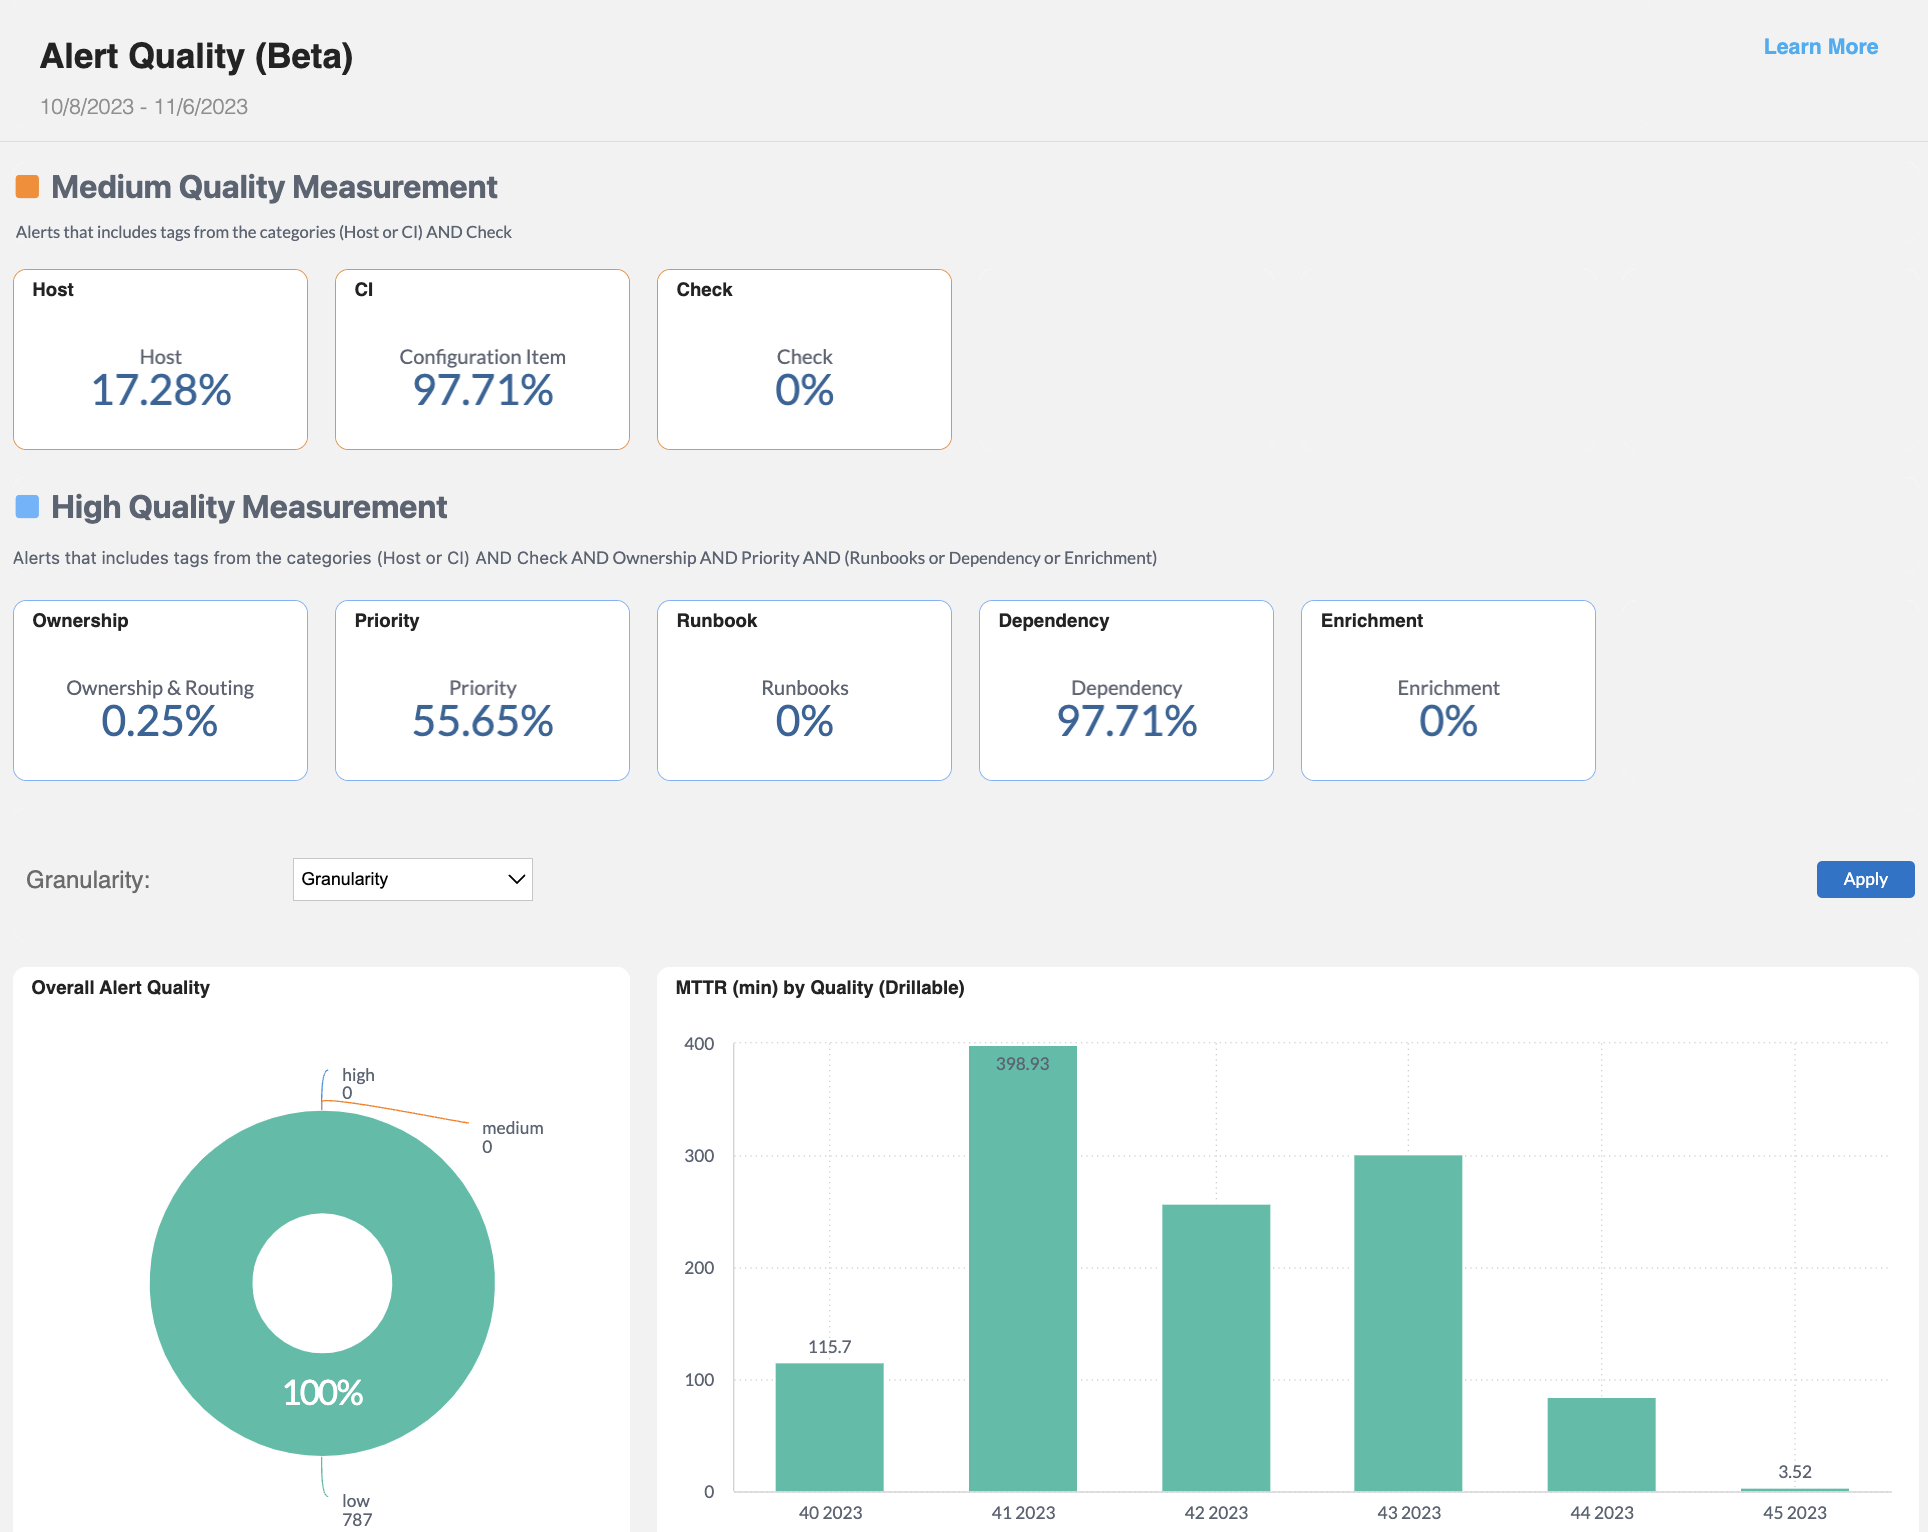
The Alert Quality Dashboard provides visibility into the quality of alerts sent to BigPanda and their impact on Mean Time to Resolve (MTTR). Use this dashboard to quickly evaluate your level of alert quality and identify key areas for improvement.
Dashboard duplication
This dashboard can be duplicated. See the Manage Unified Analytics documentation to learn how to create a new dashboard from a copy.
Key Features
See the overall quality measurement of incoming alerts.
View trends in alert quality broken down by week and hour.
Determine which source systems are sending high quality alerts and which need adjustments to increase alert quality.
Alert Quality Measurement
Alert quality measurement
The alert quality measurement defined here is specific to the Alert Quality Dashboard.
The Alert Quality Dashboard determines alert quality based on the amount of contextual information available.
Sending high quality alerts to BigPanda decreases MTTR by helping your team to easily understand the action needed to handle incidents.
The Alert Quality Dashboard separates alerts by the following quality levels:
Quality Level | Description | Requirements |
|---|---|---|
High | Contains important data needed to triage and resolve the alert. | Must contain alerts from the following categories: (Host or CI) AND Check AND Ownership & Routing AND Priority AND (Runbooks or |
Medium | Contains the minimal technical context to support action on the alert. These alerts have just enough information to be valuable. | Must contain alerts from the following categories: (Host or CI) AND Check. |
Low | Lacks key information or was identified as irrelevant or misconfigured. | Low quality alerts do not meet the logic criteria for Medium or High Quality Alerts. |
Alert Quality Categories
The following categories are used to define alert quality within this dashboard. Within each category, default tags are defined which come from monitoring tools, the Open Integration Manager, or enrichment.
Default tags
Your organization may have different default tags configured for each category. The example default tags listed in the table below are common tags many organizations use to define each category.
You can choose to include or exclude tags as needed. To adjust your alert quality configuration, contact BigPanda support.
Category | Definition | Example Default Tags |
|---|---|---|
Host | The name of the target system that generated the alert. | Host Hosts Bp_host Server Object Instance Switch Router Ip Ip_address Network_device Hostname Device Machine Node |
CI | Configuration Item | Config_item Application App App_Name Bp_application Service Bp_service srvc Bp_v_config_item Impacted_Ci Configuration_Item CI_Name CMDB_CI bp_ci |
Check | Name or title of the alert. | Check Bp_check Trigger Title Alert Sdesc Short_desc |
Ownership & Routing | The part of the business or team that should handle the alert. | Assignment_group Business_group Bp_v_business_segment Bp_assignment_group, Bp_group Support_team Owning_org Routing_group Escalation_group Support_group Escalation_group BP_Workgroup Workgroup |
Priority | Impact or severity of the alert. | Impact BP_Impact urgency Priority BP_Priority INC_Priority INC_Impact INC_Urgency |
Runbooks | Information about how the alert should be handled. | Kb Runbook_url Runbook_link KM BP_Runbook KB_article Support_link Wiki_url Knowledge_base Ki_article |
Dependency | The name of the service or application that was impacted by the alert. | Impacted_service application Service Impacted_App Bp_application Bp_service |
Enrichment | Whether or not the alert was enriched. | Enrichment enriched |
Alert Quality Widgets
The following widgets are available in the Alert Quality dashboard.
You can drill down into widgets marked Drillable to filter the entire dashboard by the selected field.
The Granularity drop-down menu allows you to select the time period for the MTTR (min) by Quality (Drillable) widget. Select from Years, Quarters, Months, Weeks, Days, or Hours.
Widget | Description |
|---|---|
Tag Coverage Widgets | Measures how well alerts are enriched with relevant information. Separate widgets display the percentage of alerts containing each of these tags:
|
Overall Alert Quality (Drillable) | A pie chart displaying the percentage of High, Medium, and Low quality alerts. Click an alert quality level to filter the dashboard based on the selected level. |
MTTR (min) by Quality (Drillable) | The average MTTR in minutes by the quality level of the alert, broken down by the selected time period. Click an alert quality level to filter the dashboard based on the selected level and time period. |
Top Alerting Sources (volume) by Quality (Drillable) | To view this widget, select the High-Level View option. A bar chart displaying the number of alerts from the sources that send the highest volume of alerts, separated by quality level. Click a field to filter the dashboard based on the selected source system. |
Top Alerting Sources (volume) by Quality (detail) | To view this widget, select the Detailed View option. A detailed view of the sources sending the highest volume of alerts, separated by quality level. Displays the number of alerts for each quality level. |
Monitoring Tool Assessment - Top 10 (Drillable) | A sankey diagram displaying the top 10 monitoring tools by volume of alerts sent, broken down by quality level and action type. |
Alert Quality by Source System | Displays the number of alerts and what percent of alerts contain the following categories, for each source system:
If a category is included in less than 50 percent of alerts, it will be highlighted in red. |
Alert Quality Attributes | Displays individual alerts, and their definition for the following categories:
|
Next Steps
View Unified Analytics dashboards.
Learn how to Manage Unified Analytics.
Find definitions of Unified Analytics key metrics.
Dive into potential reporting fields in the Standard Data Model documentation.