Event Processing
The Event Processing Dashboard provides early insight into the success of your BigPanda configurations, even if you just recently started using the platform. The dashboard shows metrics on your top source systems, and gives you visibility on how your integrations are performing.
The dashboard can be used as a tool to see the types of events that are currently being processed by BigPanda and determine ways to reduce the volume of events to help minimize costs. You can also see events that were not processed correctly, allowing you to fix issues in your integration settings and increase efficiency.
Dashboard duplication
This dashboard can be duplicated. See the Manage Unified Analytics documentation to learn how to create a new dashboard from a copy.
Key Features
Obtain onboarding success metrics quickly after configuration.
View details on integrations monitored by BigPanda.
Follow the events to incident creation flow from end to end.
Analyze the types of events processed by BigPanda, and find events that were not processed correctly.
Event Processing
The Event Processing dashboard displays information on how well BigPanda is performing.
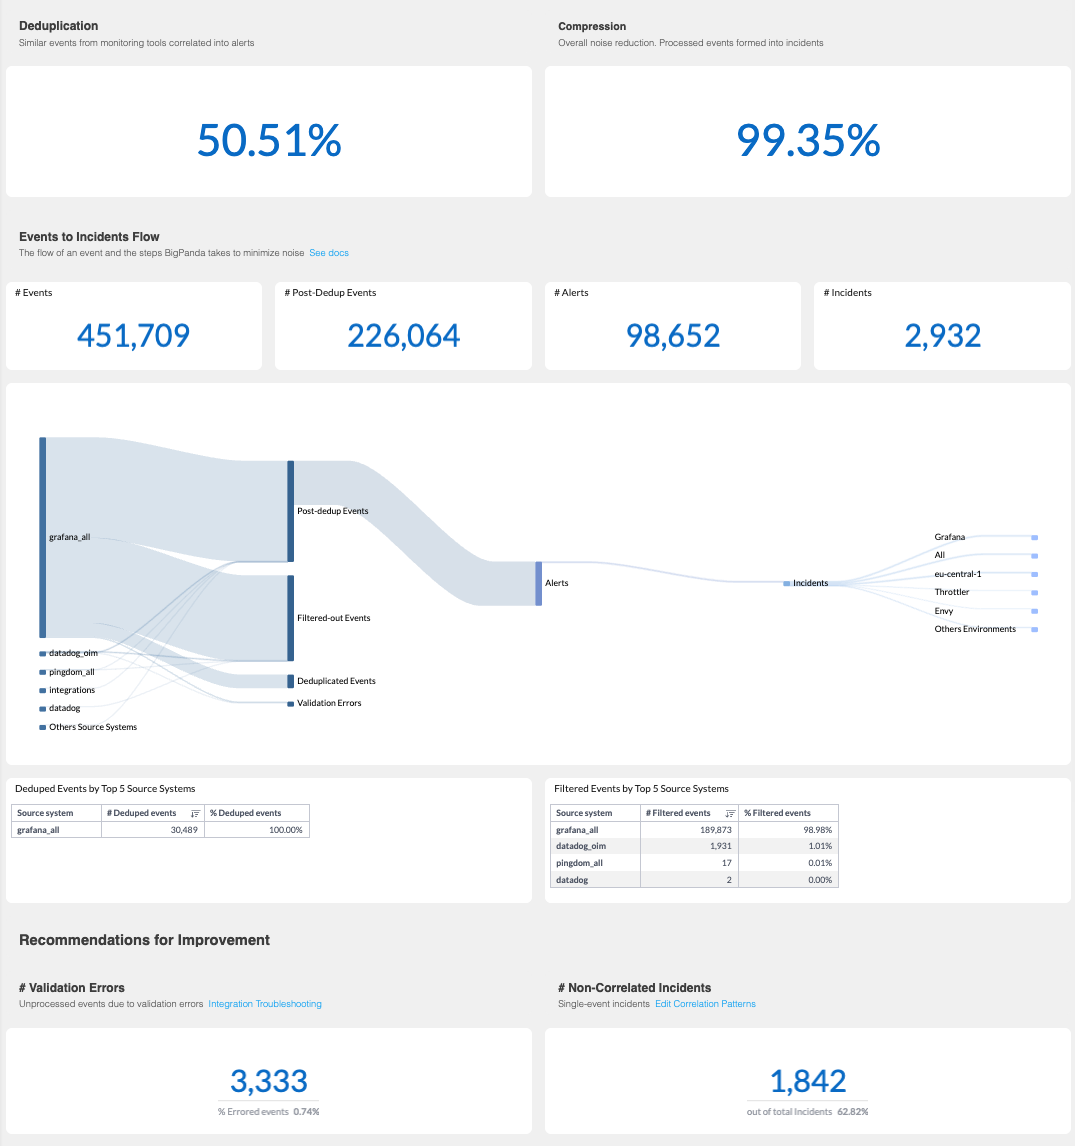
Event Processing Dashboard
Data refresh
The dashboard uses active incident data and may not be fully surfaced until the final incident event is received. Full data refresh occurs every 24 hours.
The following widgets are available in the Event Processing dashboard:
Widget | Description |
|---|---|
Deduplication | In BigPanda, events are grouped into alerts based on matching properties. This widget shows the percent of redundant events from the integrated tool that are deduplicated into alerts in BigPanda. The formula the dashboard uses for calculating the deduplication percentage is {1-[(total entities)/(total events)]} * 100. |
Compression | Displays the end-to-end noise reduction rate. This widget shows the percent of processed events formed into incidents. The formula the dashboard uses for calculating the compression percentage is {1-[(total incidents)/(total events)]} * 100. |
# Events | The total number of events that were ingested into BigPanda. |
# Post Dedup Events | The total number of events that exist after deduplication and event filtering has been taken into account. |
# Alerts | The total number of formed alerts. |
# Incidents | The total number of formed incidents. |
Event to Incident Creation | A sankey diagram displaying the flow of an event and the steps BigPanda takes to minimize noise. The diagram displays the following steps during the incident creation process:
For more information about this process, see the Events to Incidents Lifecycle documentation. |
Dedup Events by Top 5 Source Systems | The number of events deduplicated from the top 5 source systems, over time. |
Filtered Events by Top 5 Source Systems | The number of events filtered from the top 5 source systems, over time. If you are not using Alert Filtering, this widget will show no results. |
Recommendations for Improvement
The following widgets display areas that may require troubleshooting:
Widget | Description |
|---|---|
# Validation Errors | The number and percent of events ingested into BigPanda that were not processed due to errors. |
# Non-Correlated Incidents | The number and percent of incidents in BigPanda that did not have alerts correlated. These incidents only contain one alert. |
Validation Errors by Source System | Displays the number of errored events, broken down by source system. |
Non-Correlated Incidents by Source System | Displays the number of incidents in BigPanda that did not have alerts correlated, broken down by source system. These incidents contain only one alert. |
Filters
The Event Processing dashboard allows you to filter by Organization, Source System, Environments, or Dates.
Filtering by environment
When filtering by Environment, only events that were grouped into a specific environment will appear in the widgets, rather than all events that enter BigPanda.
Date filter
The date filter is by event creation time. Because of this, alerts and incidents created prior to the selected date may appear in the dashboard if the event creation date falls within the selected filter range.
Learn more about using filters and widget options in the Filter Dashboards documentation.
Next Steps
View Unified Analytics dashboards.
Learn how to Manage Unified Analytics.
Find definitions of Unified Analytics key metrics.
Dive into potential reporting fields in the Standard Data Model documentation.