The Analytics Tab
The Analytics tab provides you with powerful, interactive IT operations dashboards via Unified Analytics . These dashboards focus your data into widgets, which make it easy to see the impact of your monitoring tools and applications.
Within the Analytics Tab, you also have access to the Report Manager . Report manager allows you to schedule and send dashboard reports via email, even to users who do not have BigPanda accounts.
Unified Analytics
Field | Description |
|---|---|
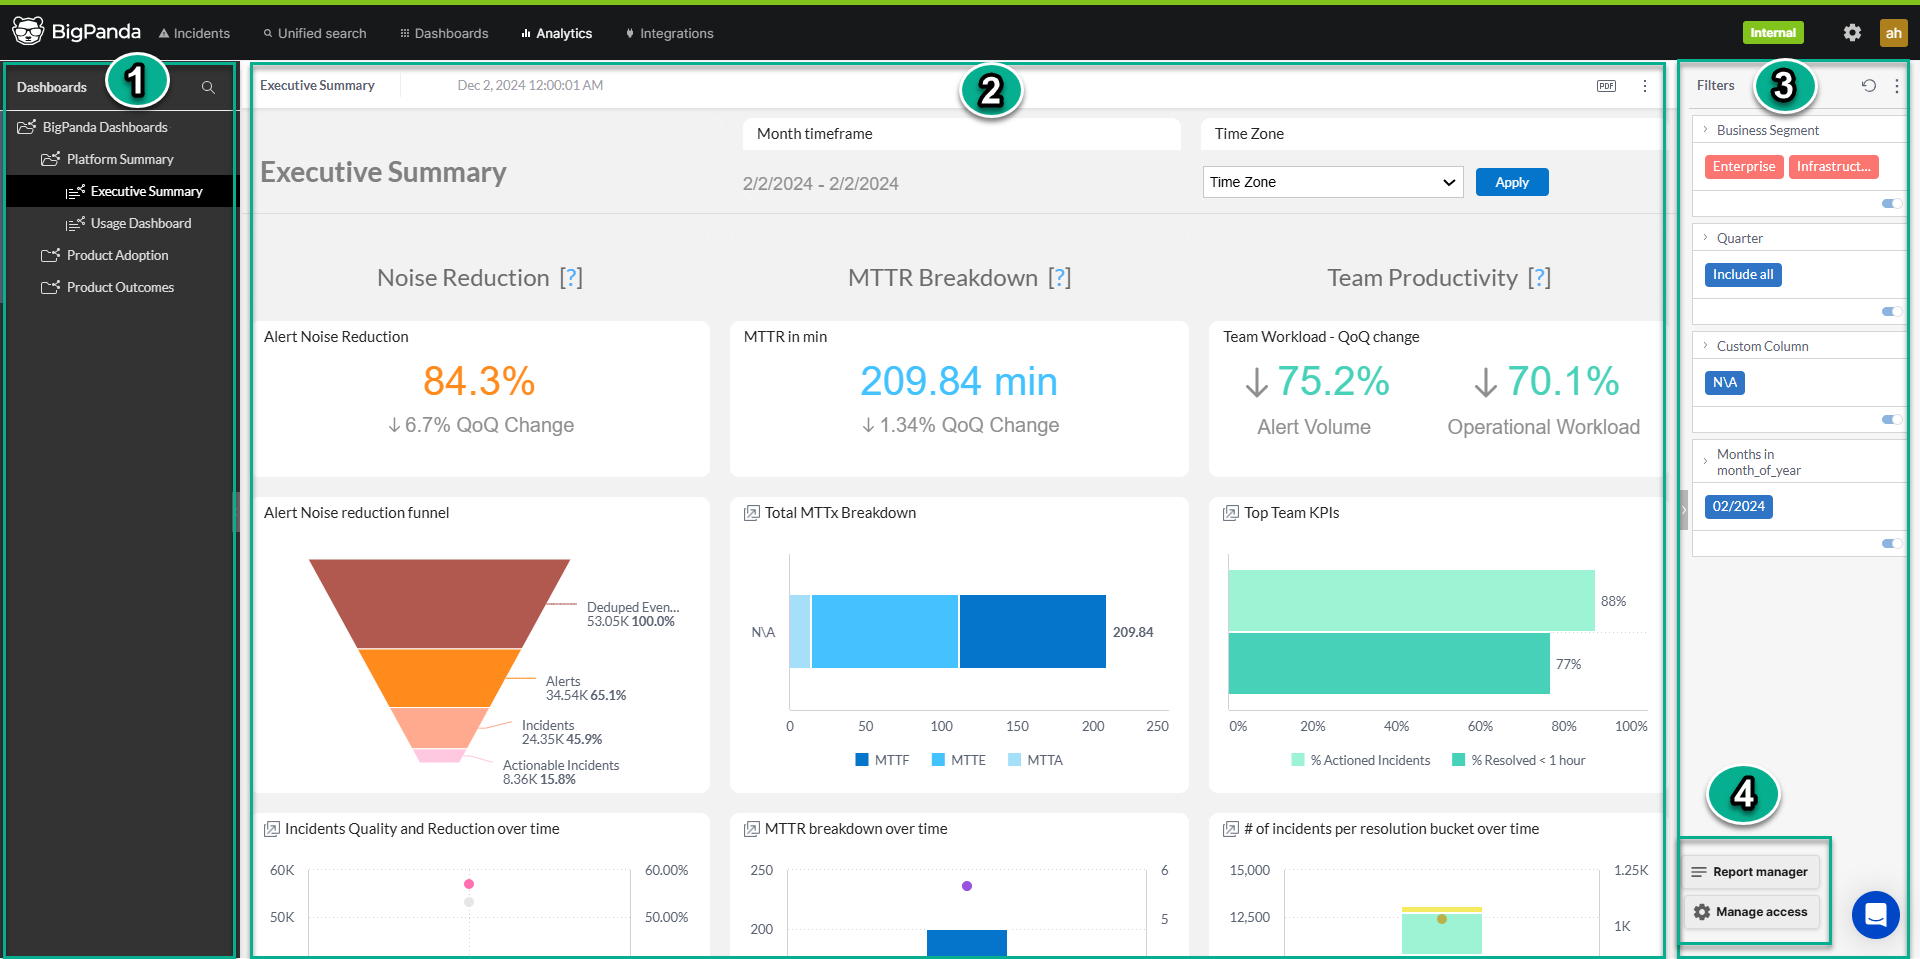
1 - Dashboards Pane | Use the Dashboards Pane to select dashboards to view. Dashboards can also be searched and downloaded from within this pane. |
2 - Dashboard | The selected dashboard appears in the middle of the screen. |
3 - Filters | Use the Filters pane to filter the selected dashboard. |
4 - Report Manager and Manage Access buttons | The Report Manager button is visible to users with the Dashboard Designer permission. Click the button to access the Report Manager , where you can schedule and send emailed reports. The Manage Access button is visible to users with the Dashboard Designer permission. Click the button to select which users have the Dashboard Designer permission. |
Navigation Pane
Your dashboards may be organized into folders in the left pane. Simply click a folder name to expand the list of dashboards in that folder. Click the folder name again to hide the individual report names.
 |
Navigation Pane
Field | Description |
|---|---|
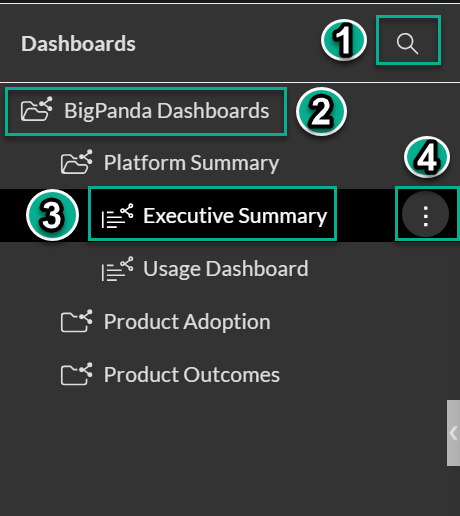
1 - Search | Search for a specific dashboard. |
2 - Folder | Individual dashboards are organized into folders. |
3 - Dashboard | The available dashboards appear within folders. Click a dashboard name to view the dashboard. |
4 - Options | Click the three dots icon to the right of the dashboard name to view options. From the options flyout, you can download a dashboard or restore a dashboard. |
Dashboards Screen
Unified Analytics organizes your data into focused dashboards, making it easy to see an overview of monitoring impacts, drill down into specific tools, or identify actionable incident trends. Each dashboard offers an on-demand snapshot of your data for a specific period of time, helping you visualize historical trends in your monitoring data and identify problem areas in your infrastructure.
 |
Dashboards View
Field | Description |
|---|---|
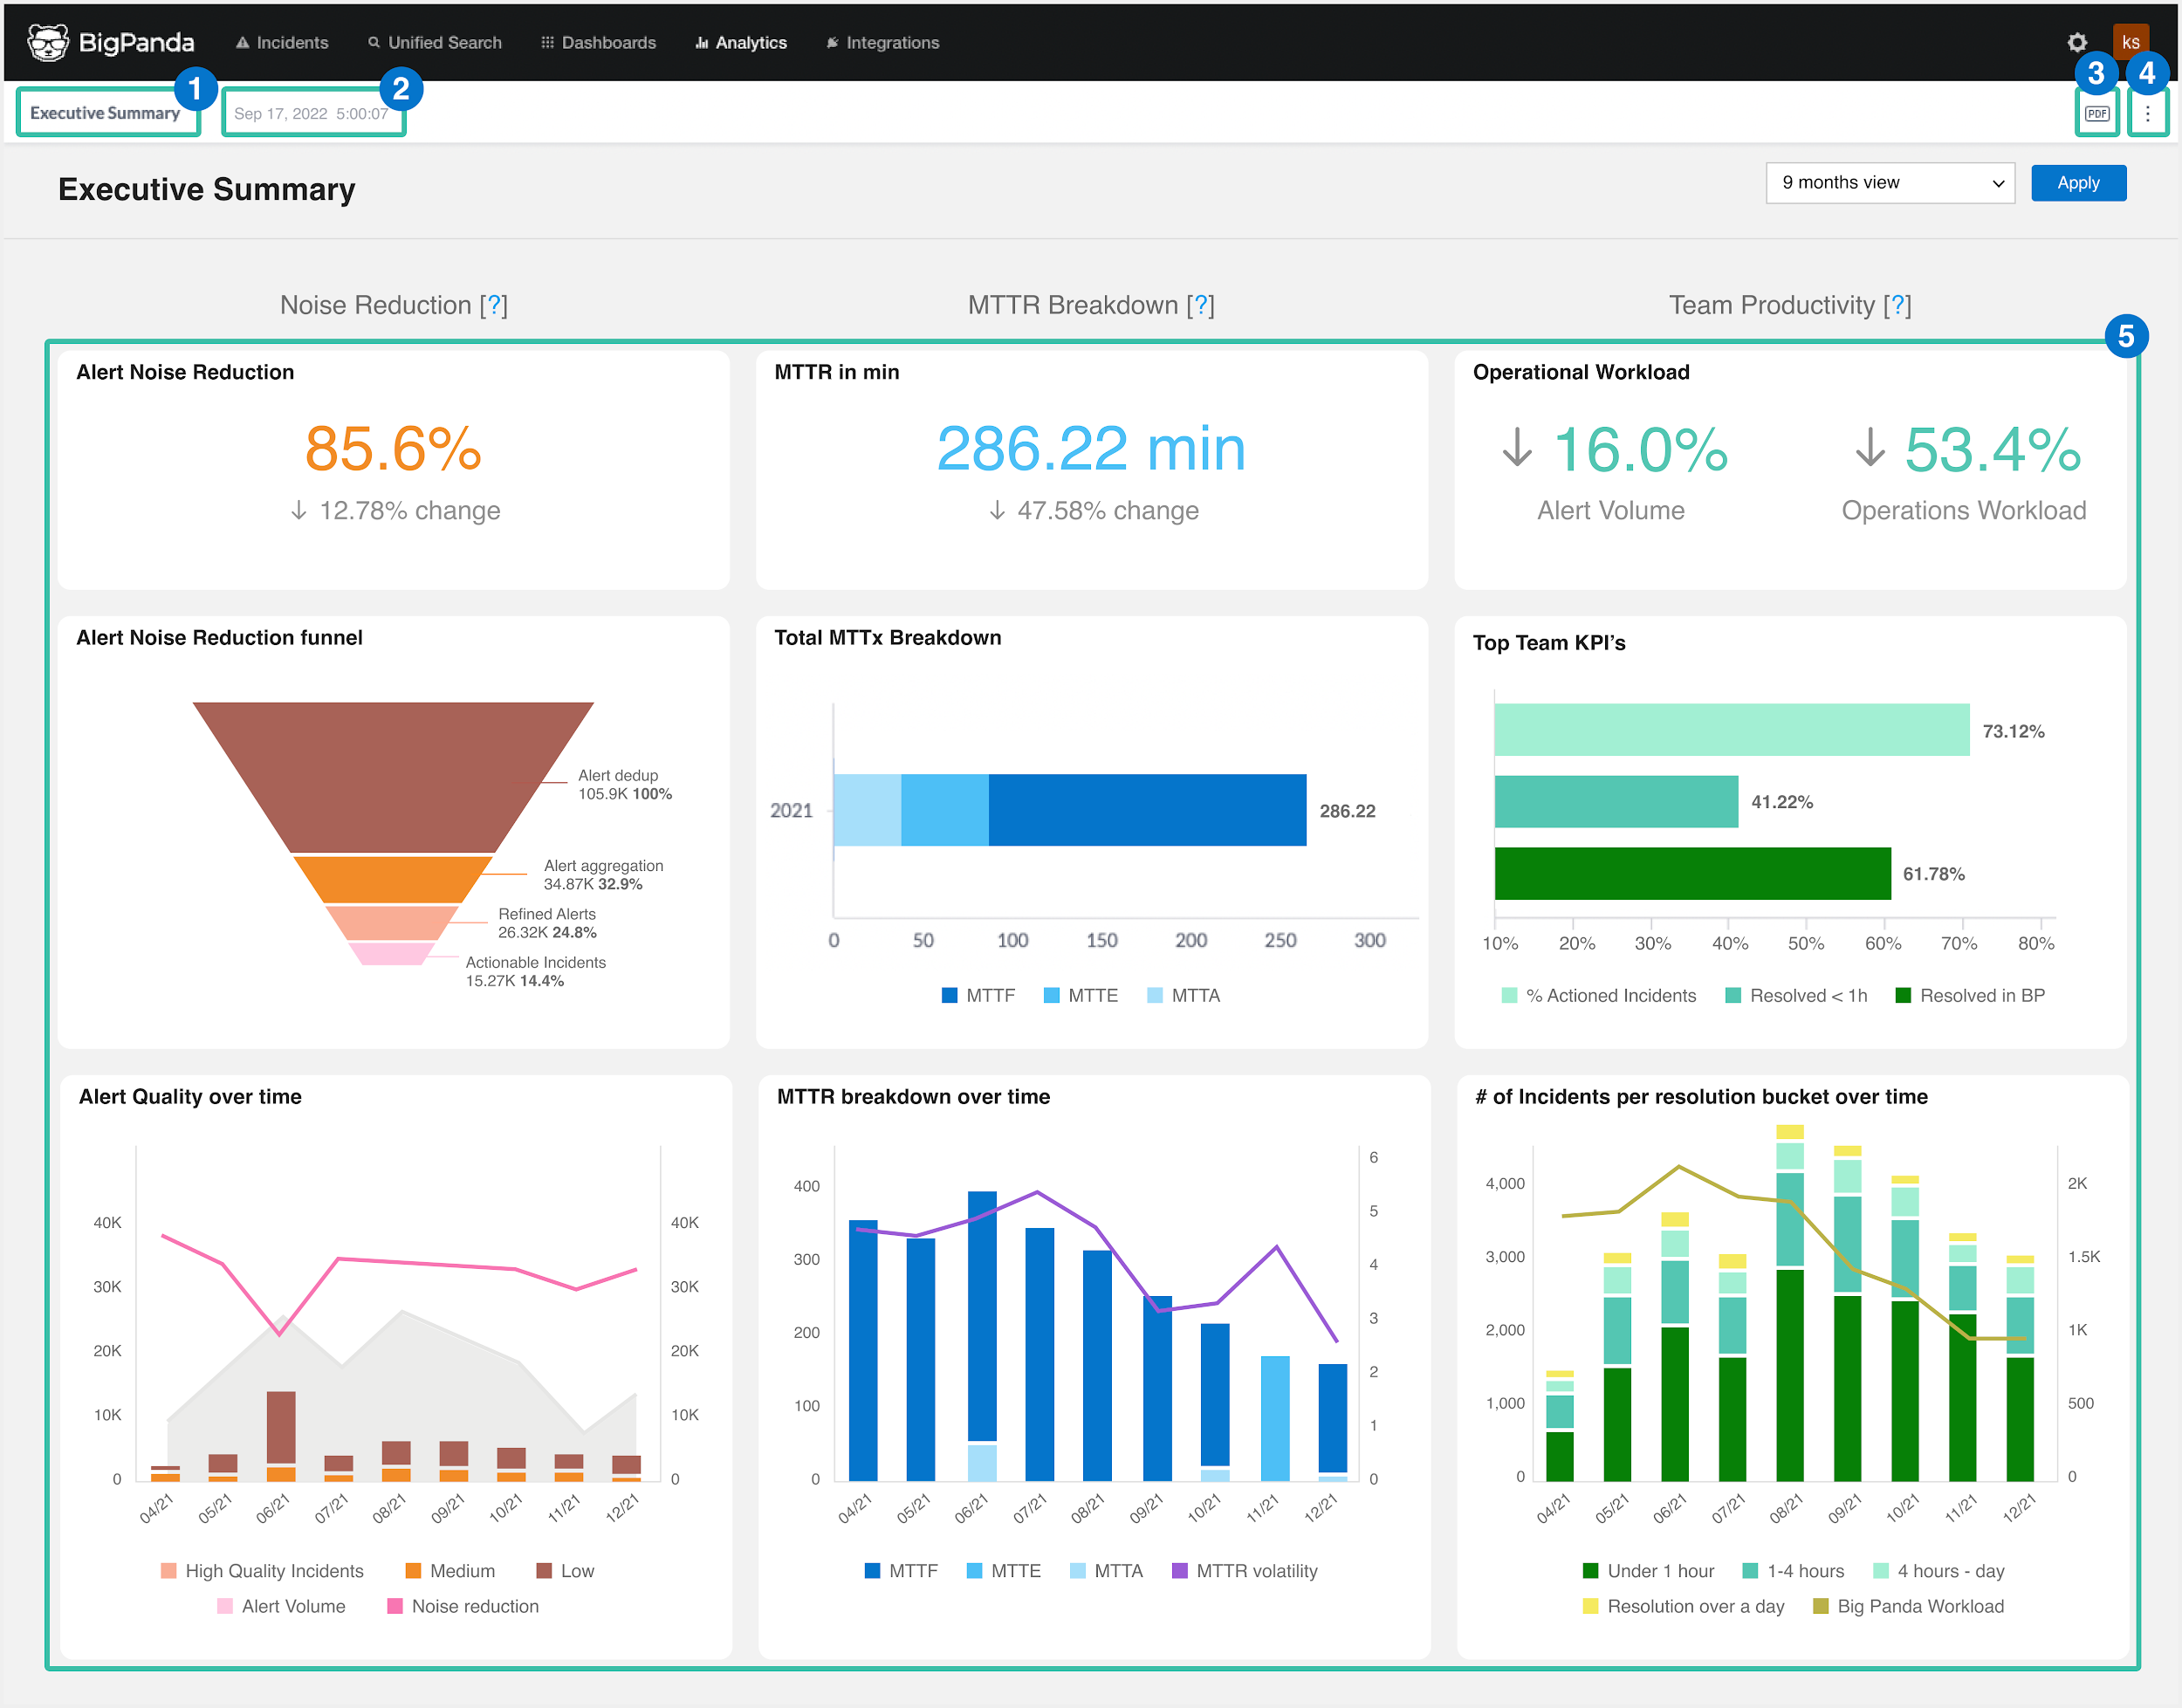
1 - Dashboard Title | The unique name of the dashboard. |
2 - Last Updated Date | The date and time that the dashboard was last updated. |
3 - PDF Report Settings | Click the PDF icon to open the PDF Report Settings screen. From this screen, you can edit the paper size, orientation, header settings, and footer settings. |
4 - Options | Click the three dots icon to view options. From the flyout menu, you can restore or download the dashboard. |
5 - Widgets | Widgets are easy to read, individually managed data visualizations within Unified Analytics. Widgets may include charts, graphs, and tables. |
Widgets
Dashboards are made up of widgets, or individual data visualizations. Widgets are easy to read, individually managed components within Unified Analytics. Widgets may include charts, graphs, and tables. Each dashboard is configured to show a specific group of widgets to make visualizing business impact easy.
 |
Analytic Widget
Field | Description |
|---|---|
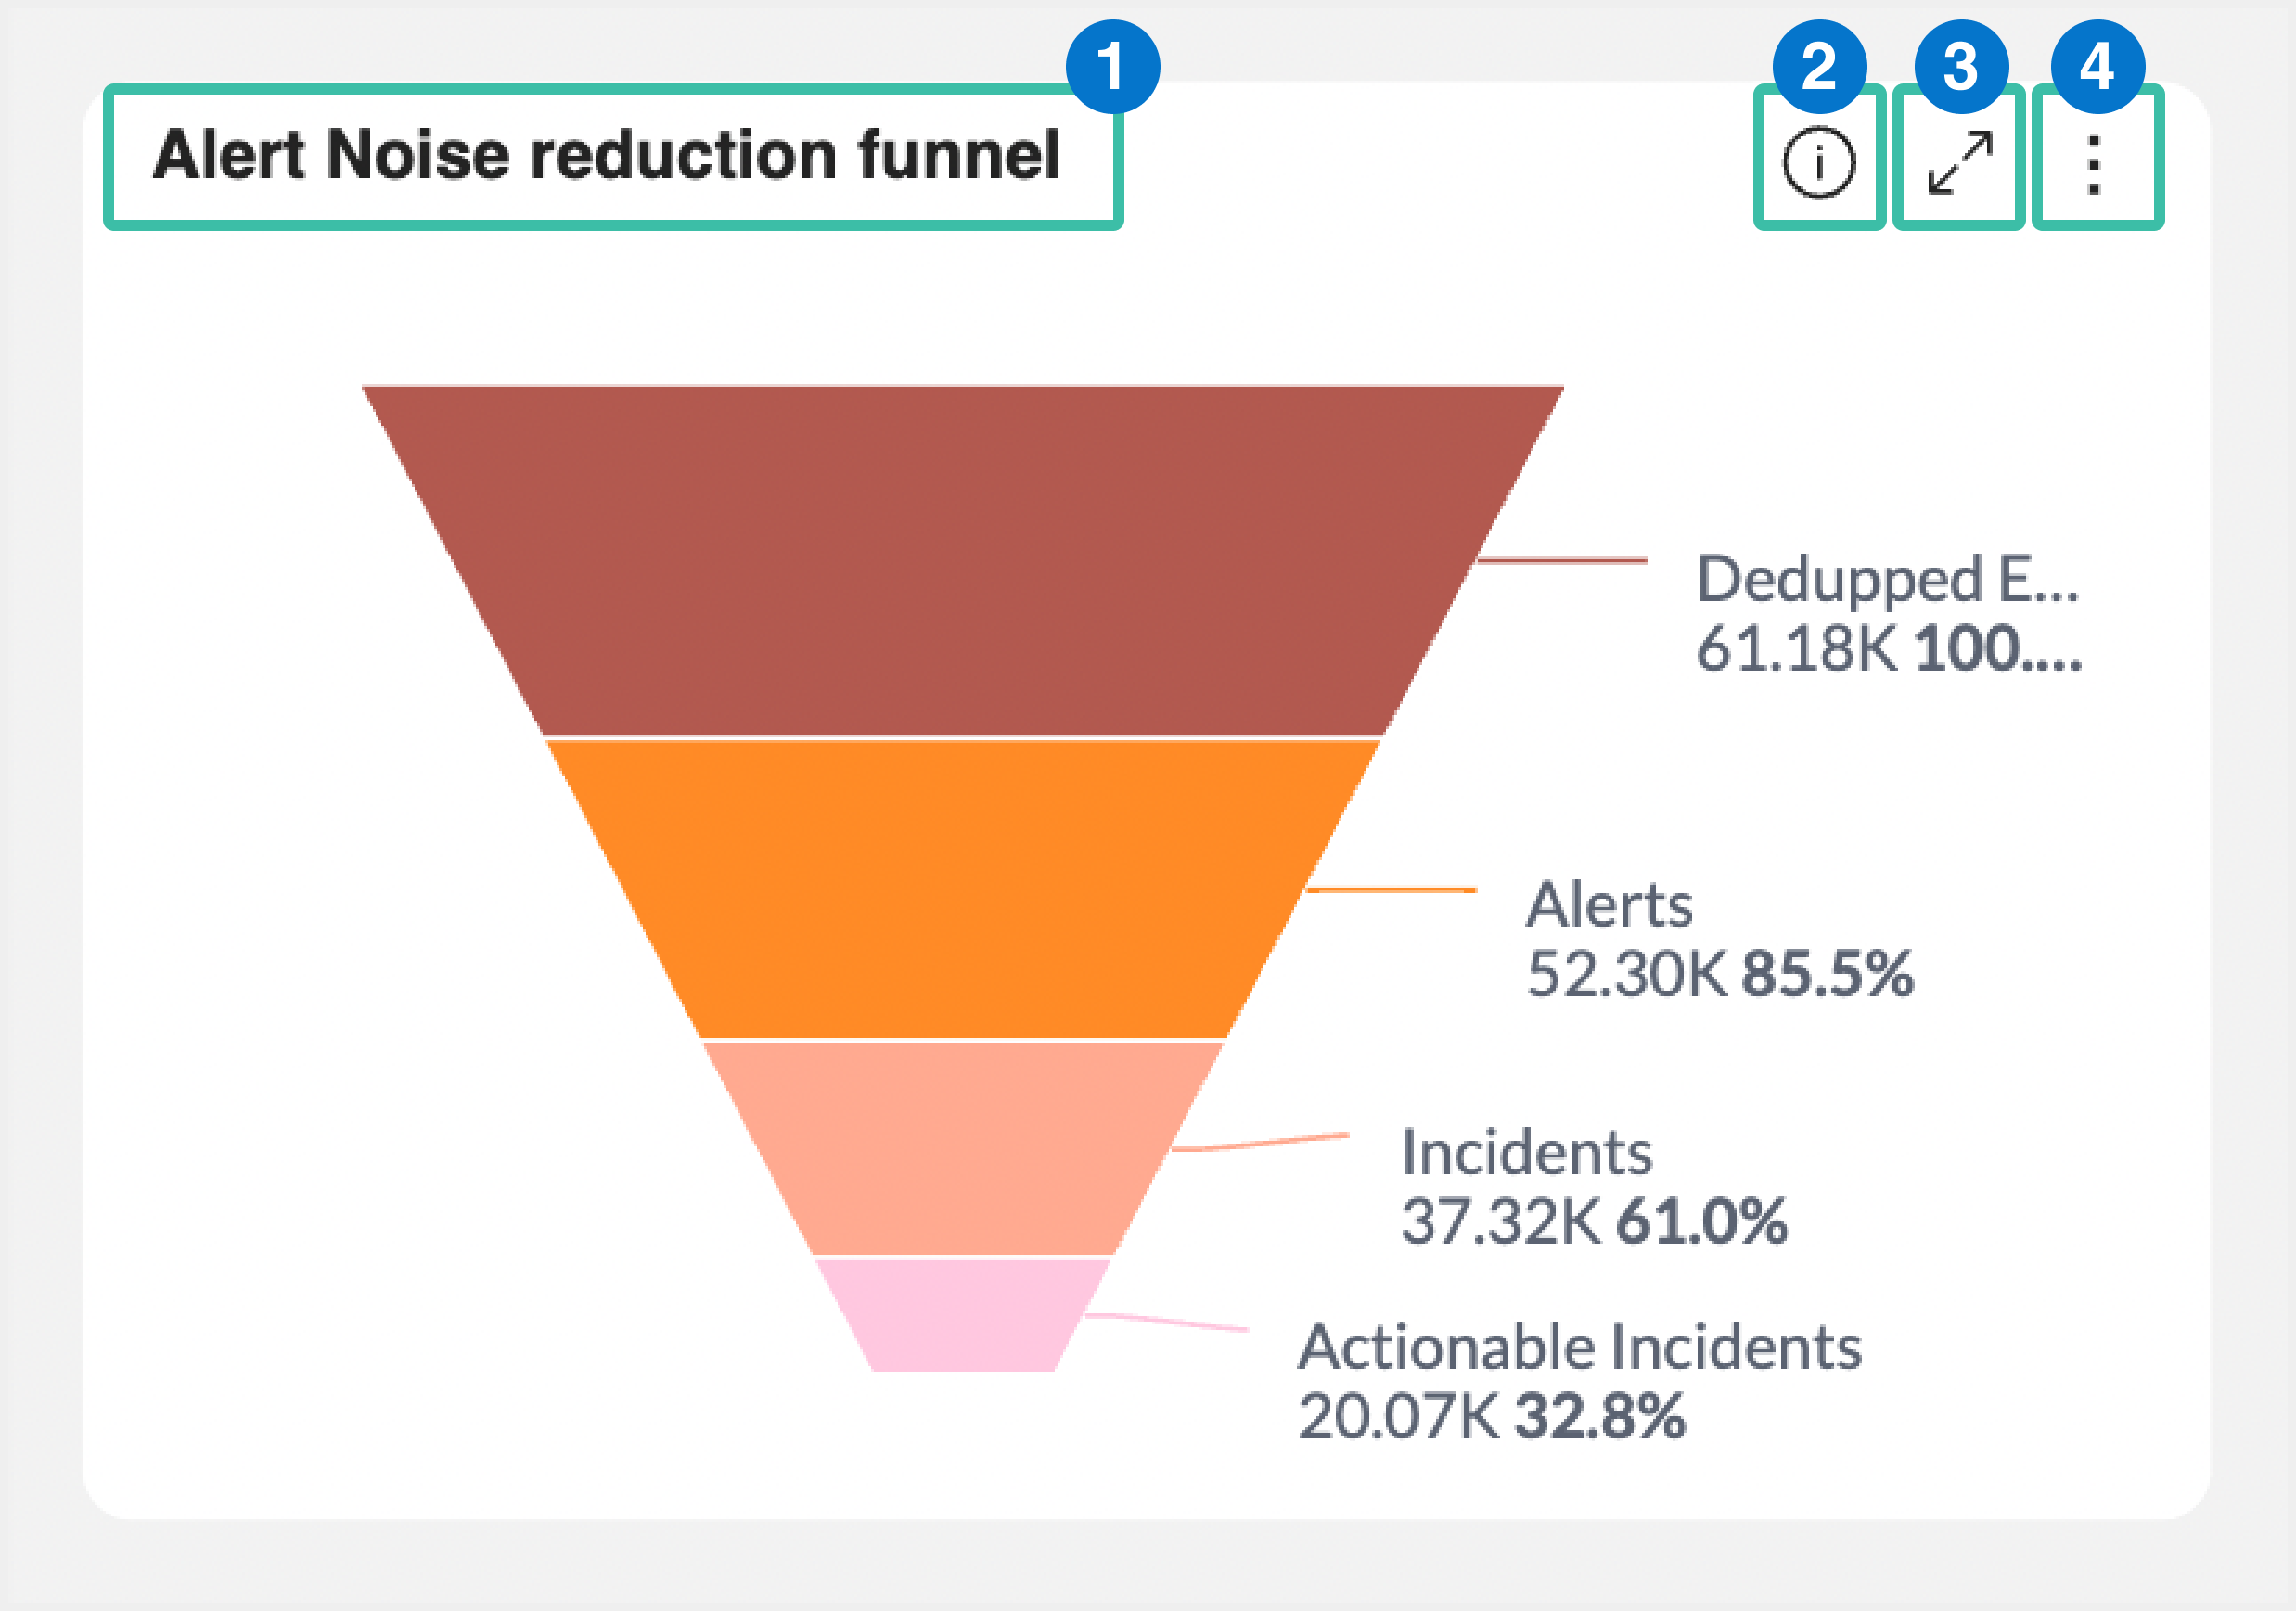
1 - Widget Title | The name of the widget. |
2 - Full Details | Click the information icon (i) to view the full details of the widget. The last refreshed date and tags used in the widget are displayed. Click the refresh icon to refresh the data. |
3 - Full Screen | Click the expand icon to view the widget in full-screen mode. |
4 - Options | Click the three dots icon to download the widget. The widget can be downloaded as either an image or CSV file. |
Filters Pane
Filters are managed in the right Filters pane. All filters currently configured for the dashboard appear in the filters list. Each filter shows the configured settings that will apply when the dashboard is published or shared.
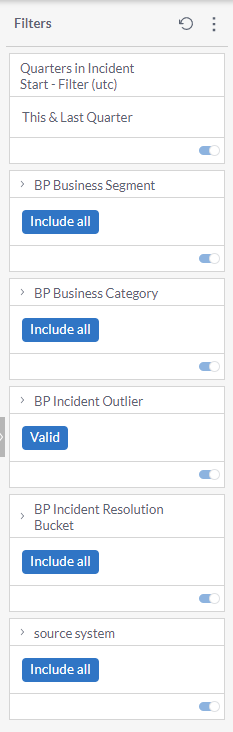 |
Filters Pane
Field | Description |
|---|---|
1 - Filter Options | Click the three dots icon to set the default filters. |
2 - Filters | The filters currently configured for the dashboard appear in the list. |
3 - Edit Filter | Click the pencil icon to edit the filter. |
4 - Disable Filter | Click the blue toggle icon to disable or enable a filter. |
Report Manager
Report Manager is a highly flexible centralized location where you can set up advanced reporting schedules, including hourly, weekly, and monthly reporting options with custom end dates. You can choose specific filters for your dashboards before sending them, and customize the email template and report format.
Users with the Dashboard Designer permission can access Report Manager within the Analytics tab. Navigate to the bottom right corner of the Unified Analytics screen and click the Report Manager button.
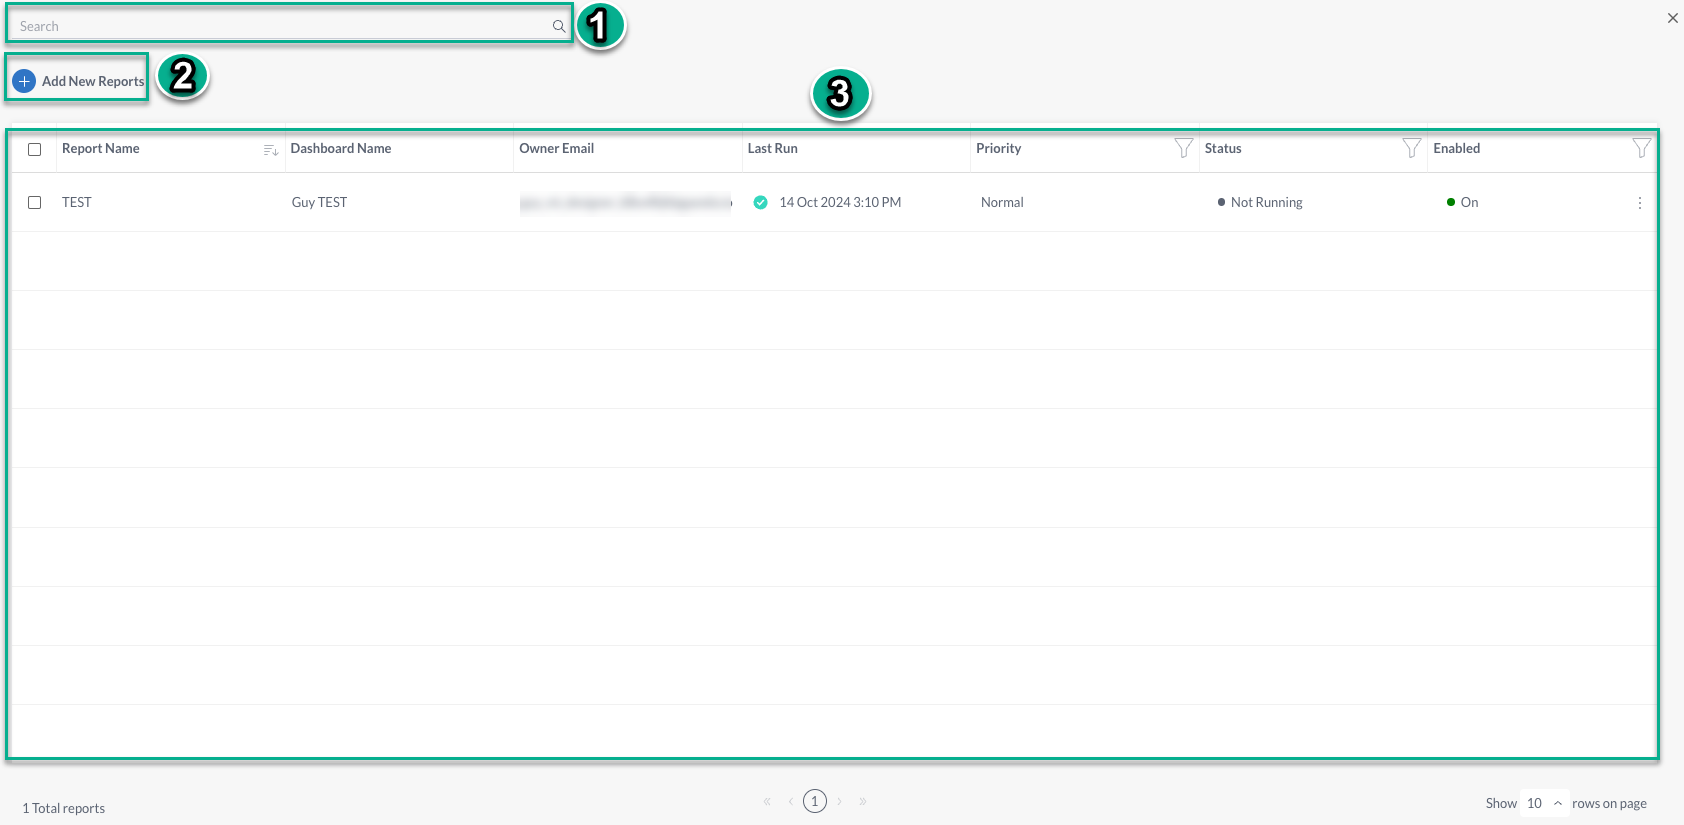
Report Manager
Field | Description |
|---|---|
1 - Search | Enter a term into the search bar to look for reports by keyword or name. |
2 - Add New Reports | Click the button to schedule and create a new report. |
3 - Report List | Displays the reports that have been created. You can sort or filter the list by clicking the top of each column. To edit a report or send an unscheduled report, click the three dots icon on the far right in the list. |
Next Steps
Learn more about using Unified Analytics
Learn about viewing dashboards in Unified Analytics
Dig into analytics options with BigPanda Analytics