Teams Efficiency
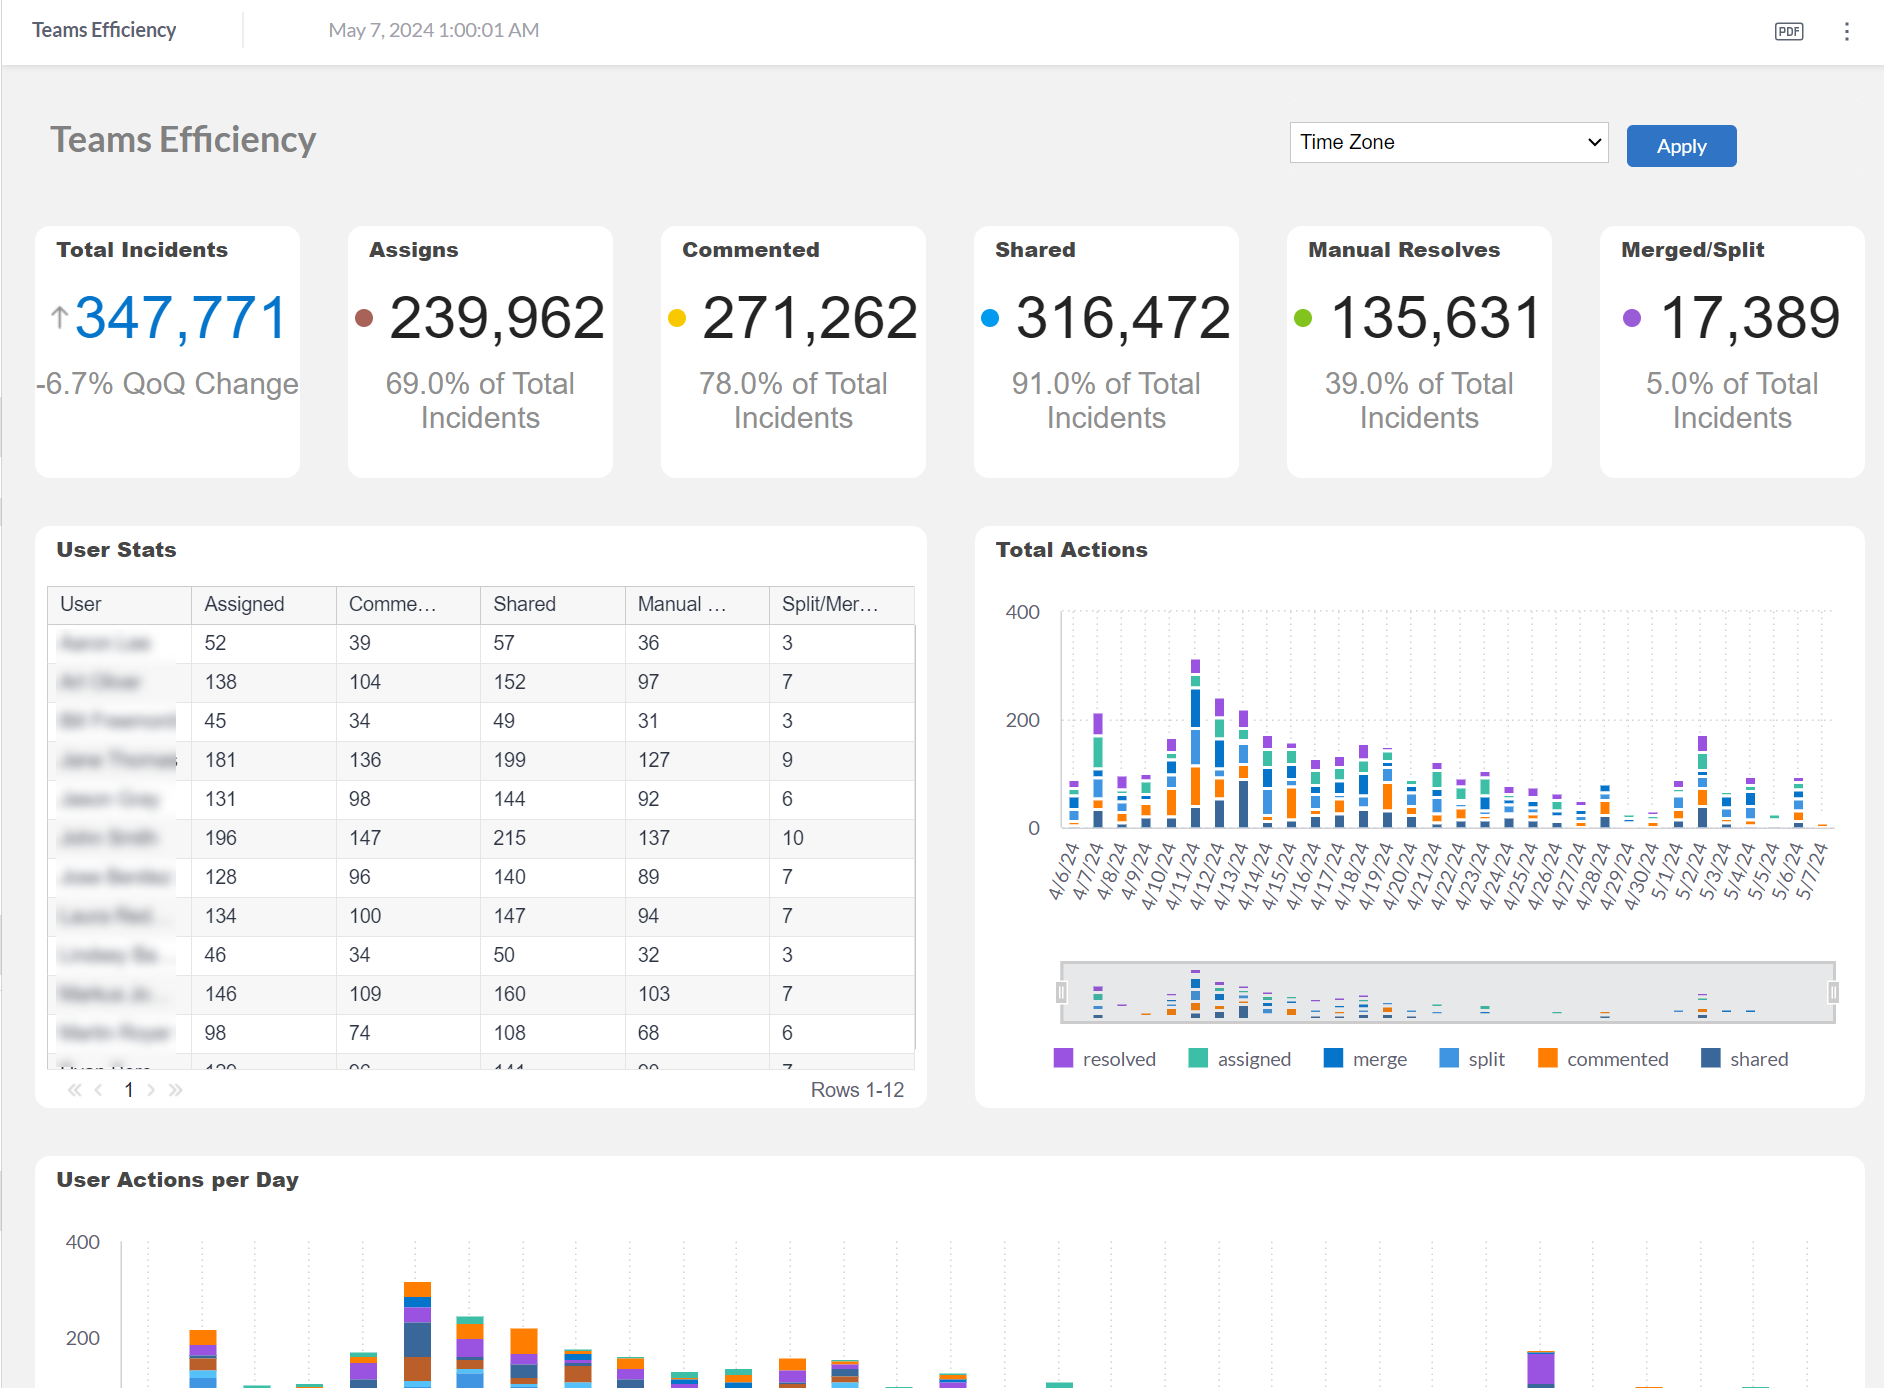
The Teams Efficiency Dashboard offers a comprehensive overview of the actions and behavior of users within BigPanda. Actions tracked include: Assigned, Comments, Manual Resolve, Shared, and Snoozed.
Dashboard duplication
This dashboard can be duplicated. See the Manage Unified Analytics documentation to learn how to create a new dashboard from a copy.
Key Features
Track all actions taken in the console
Measure adoption of BigPanda within day-to-day operations
View the percentage of incidents being timely actioned
Review individual users to ensure team members are acting according to role
Widgets
The following widgets are available in the Teams Efficiency dashboard:
Widget | Description |
|---|---|
Incident Count | The total number of incidents that entered BigPanda during the reporting time period. |
Assigned | The number of incidents that were assigned to a user during the reporting time period. |
Commented | The number of incidents that were commented on during the reporting time period. |
Shared | The number of incidents that were auto- or manually-shared during the reporting time period. |
Manually Resolved | The number of incidents that were manually resolved during the reporting time period. |
Merged/Split | The number of incidents that were merged or split during the reporting time period. |
% of Incidents | The percentage of incidents that entered BigPanda during the reporting time period. |
% Assigned | The percentage of incidents that were assigned to a user during the reporting time period. |
% Commented | The percentage of incidents that were commented on during the reporting time period. |
% Shared | The percentage of incidents that were auto- or manually-shared during the reporting time period. |
% Manually Resolved | The percentage of incidents that were manually resolved during the reporting time period. |
% Merged/Split | The percentage of incidents that were merged or split during the reporting time period. |
User Stats | The number of times each user took specific actions within BigPanda toward managing incidents. Only manual actions are counted. |
Total Actions | The number of times each action was taken on incidents per day. Only manual actions are counted. |
User Actions per Day | The number of actions performed by each user per day. |
Next Steps
View Unified Analytics dashboards.
Learn how to Manage Unified Analytics.
Find definitions of Unified Analytics key metrics.
Dive into potential reporting fields in the Standard Data Model documentation.