The Alerts Tab
The Alerts tab displays information about alerts associated with an incident. Within this tab, you can view alert details or take action on alerts.
Navigate the Alerts Tab
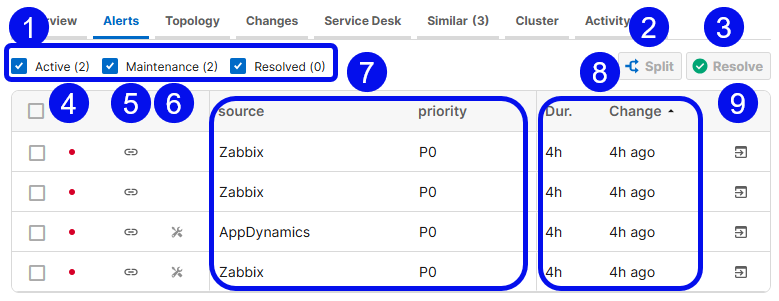
The Alerts Tab
Click any alert within the table to view additional details. The details that appear can be configured by your BigPanda administrator. See Manage Alert Views for information on tailoring the alert view.
Item | Description | Related Links |
|---|---|---|
1 - Alert Filters | Click a checkbox to filter the Alerts table. You can filter by Active, Maintenance, or Resolved alerts. Each checkbox displays the number of alerts that are currently in that state. Active alerts are currently in the Critical or Warning state. Maintenance alerts are alerts that are currently suppressed by a maintenance plan. Resolved alerts are alerts that have been either manually or automatically resolved. | |
2 - Split | Select one or more alerts and click the Split button to separate them into a new incident. | |
3 - Resolve | Select one or more alerts and click the Resolve button to resolve the alerts in BigPanda. | |
4 - Status Indicator | Displays a colored dot on the left to indicate the current status of a related alert. | |
5 - Link | If the alert contains links to more information, such as runbooks or time-series metrics, a clickable link icon will be displayed. | |
6 - Maintenance Icon | If the alert was matched to an active maintenance plan, the maintenance icon appears. Hover over the icon to see details about all matched maintenance plans for the alert. This column does not appear if no alerts in the incident were affected by maintenance plans. | |
7 - Alert Data | Displays the data for each related alert in a table. The column headers show the tag names and the rows show the tag values. You can drag the center divider to resize the incident feed, and columns are added, removed, or resized dynamically as space allows. Click the arrow icon at the far right of the Alerts table to open the Alert Info window, which contains full alert data. | |
8 - Duration and Last Change | The Duration column displays the amount of time since the first event for each alert. The Last Change column shows the time of the last status change for each alert. | |
9 - Open pane | Open the alert in a separate pane for easy viewing. |