The Analytics Tab
Use the Analytics tab to view data insights and KPIs.
The Analytics tab provides you with powerful, interactive IT operations dashboards. These dashboards focus your data into widgets, which make it easy to see the impact of your monitoring tools and applications.
Use BigPanda Reporting or Unified Analytics to understand and proactively monitor your infrastructure for increased up-time and reduced mean time to resolve (MTTR).
You may see slightly different elements in the Analytics Tab if your organization is still using the BigPanda Reporting feature.
Unified Analytics
With improved visualizations and customizable options, Unified Analytics can help you see the metrics you need to monitor and improve your IT Operations.
See the Unified Analytics documentation for more information on features and improvements, or reach out to your BigPanda Account Manager to learn about the rollout.
BigPanda Reporting will be deprecated following the migration to Unified Analytics.
For more information, see the BigPanda Reporting Unified Analytics documentation.

The Unified Analytics Tab
| Field | Description |
|---|---|
| 1 - Dashboards Pane | Use the Dashboards Pane to select dashboards to view. Dashboards can also be searched and downloaded from within this pane. |
| 2 - Dashboard | The selected dashboard appears in the middle of the screen. |
| 3 - Filters | Use the Filters pane to filter the selected dashboard. |
Navigation Pane
Your dashboards may be organized into folders in the left pane. Simply click a folder name to expand the list of dashboards in that folder. Click the folder name again to hide the individual report names.
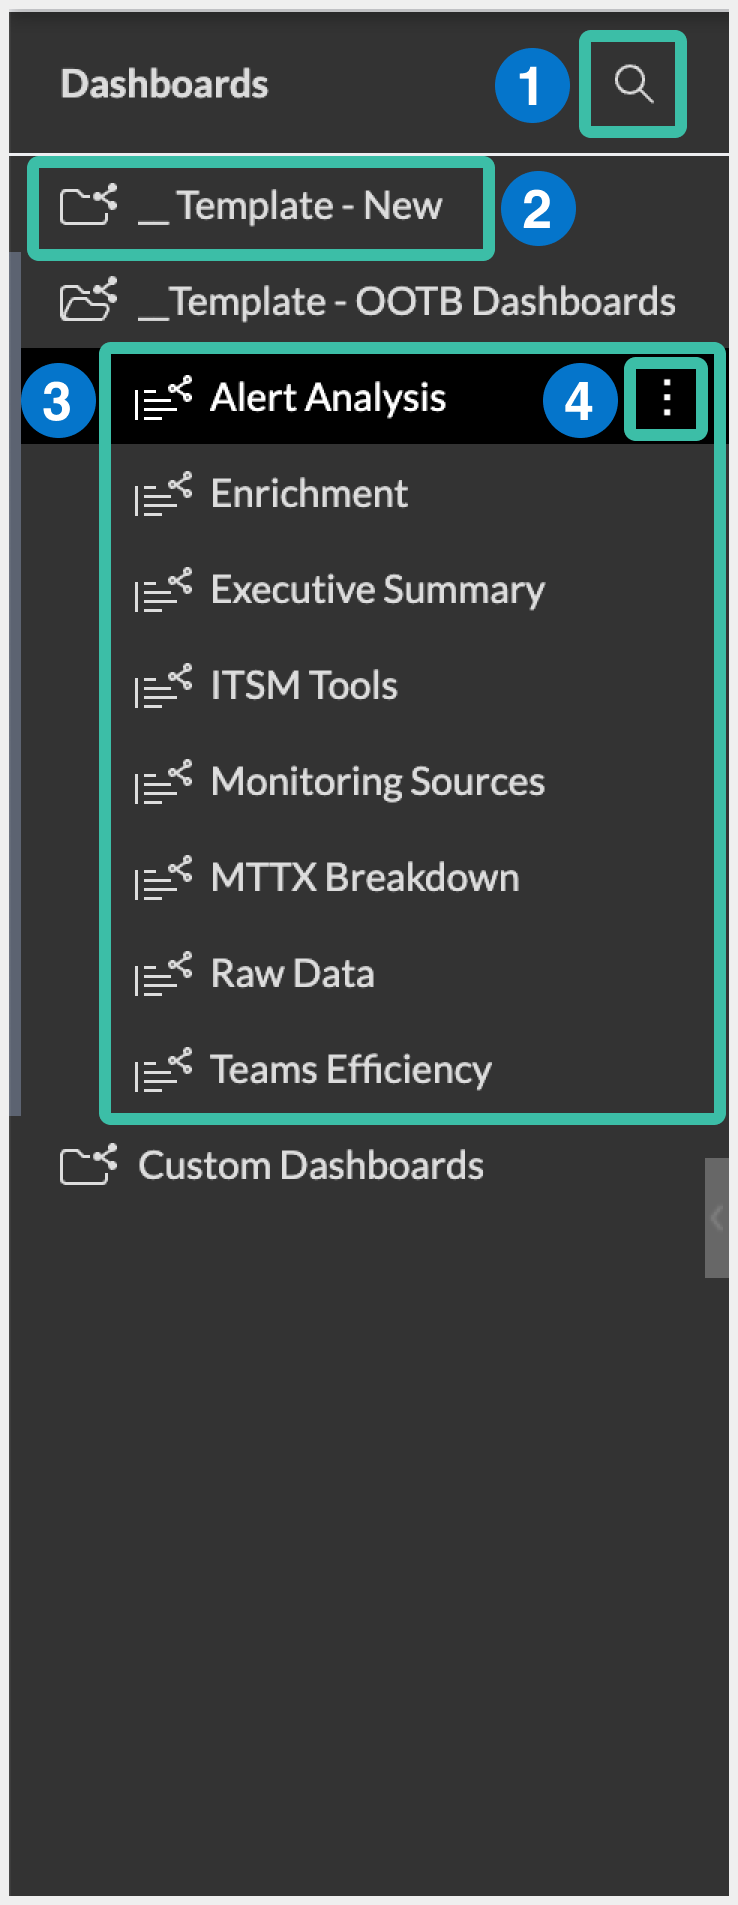
| Field | Description |
|---|---|
| 1 - Search | Search for a specific dashboard. |
| 2 - Folder | Individual dashboards are organized into folders. |
| 3 - Dashboard | The available dashboards appear within folders. Click a dashboard name to view the dashboard. |
| 4 - Options | Click the three dots icon to the right of the dashboard name to view options. From the options flyout, you can download a dashboard or restore a dashboard. |
Dashboards Screen
Unified Analytics organizes your data into focused dashboards, making it easy to see an overview of monitoring impacts, drill down into specific tools, or identify actionable incident trends. Each dashboard offers an on-demand snapshot of your data for a specific period of time, helping you visualize historical trends in your monitoring data and identify problem areas in your infrastructure.

Dashboards View
| Field | Description |
|---|---|
| 1 - Dashboard Title | The unique name of the dashboard. |
| 2 - Last Updated Date | The date and time that the dashboard was last updated. |
| 3 - PDF Report Settings | Click the PDF icon to open the PDF Report Settings screen. From this screen, you can edit the paper size, orientation, header settings, and footer settings. |
| 4 - Options | Click the three dots icon to view options. From the flyout menu, you can restore or download the dashboard. |
| 5 - Widgets | Widgets are easy to read, individually managed data visualizations within Unified Analytics. Widgets may include charts, graphs, and tables. |
Widgets
Dashboards are made up of widgets, or individual data visualizations. Widgets are easy to read, individually managed components within Unified Analytics. Widgets may include charts, graphs, and tables. Each dashboard is configured to show a specific group of widgets to make visualizing business impact easy.

Analytic Widget
| Field | Description |
|---|---|
| 1 - Widget Title | The name of the widget. |
| 2 - Full Details | Click the information icon (i) to view the full details of the widget. The last refreshed date and tags used in the widget are displayed. Click the refresh icon to refresh the data. |
| 3 - Full Screen | Click the expand icon to view the widget in full-screen mode. |
| 4 - Options | Click the three dots icon to download the widget. The widget can be downloaded as either an image or CSV file. |
Filters Pane
Filters are managed in the right Filters pane. All filters currently configured for the dashboard appear in the filters list. Each filter shows the configured settings that will apply when the dashboard is published or shared.

Filters Pane
| Field | Description |
|---|---|
| 1 - Filter Options | Click the three dots icon to set the default filters. |
| 2 - Filters | The filters currently configured for the dashboard appear in the list. |
| 3 - Edit Filter | Click the pencil icon to edit the filter. |
| 4 - Disable Filter | Click the blue toggle icon to disable or enable a filter. |
Next Steps
Learn more about Using BigPanda Reporting or Unified Analytics
Learn about viewing dashboards in Unified Analytics
Dig into analytics options with BigPanda Analytics
Updated 5 months ago