Usage Dashboard
The Usage Dashboard in Unified Analytics gives visibility into processing and platform use.
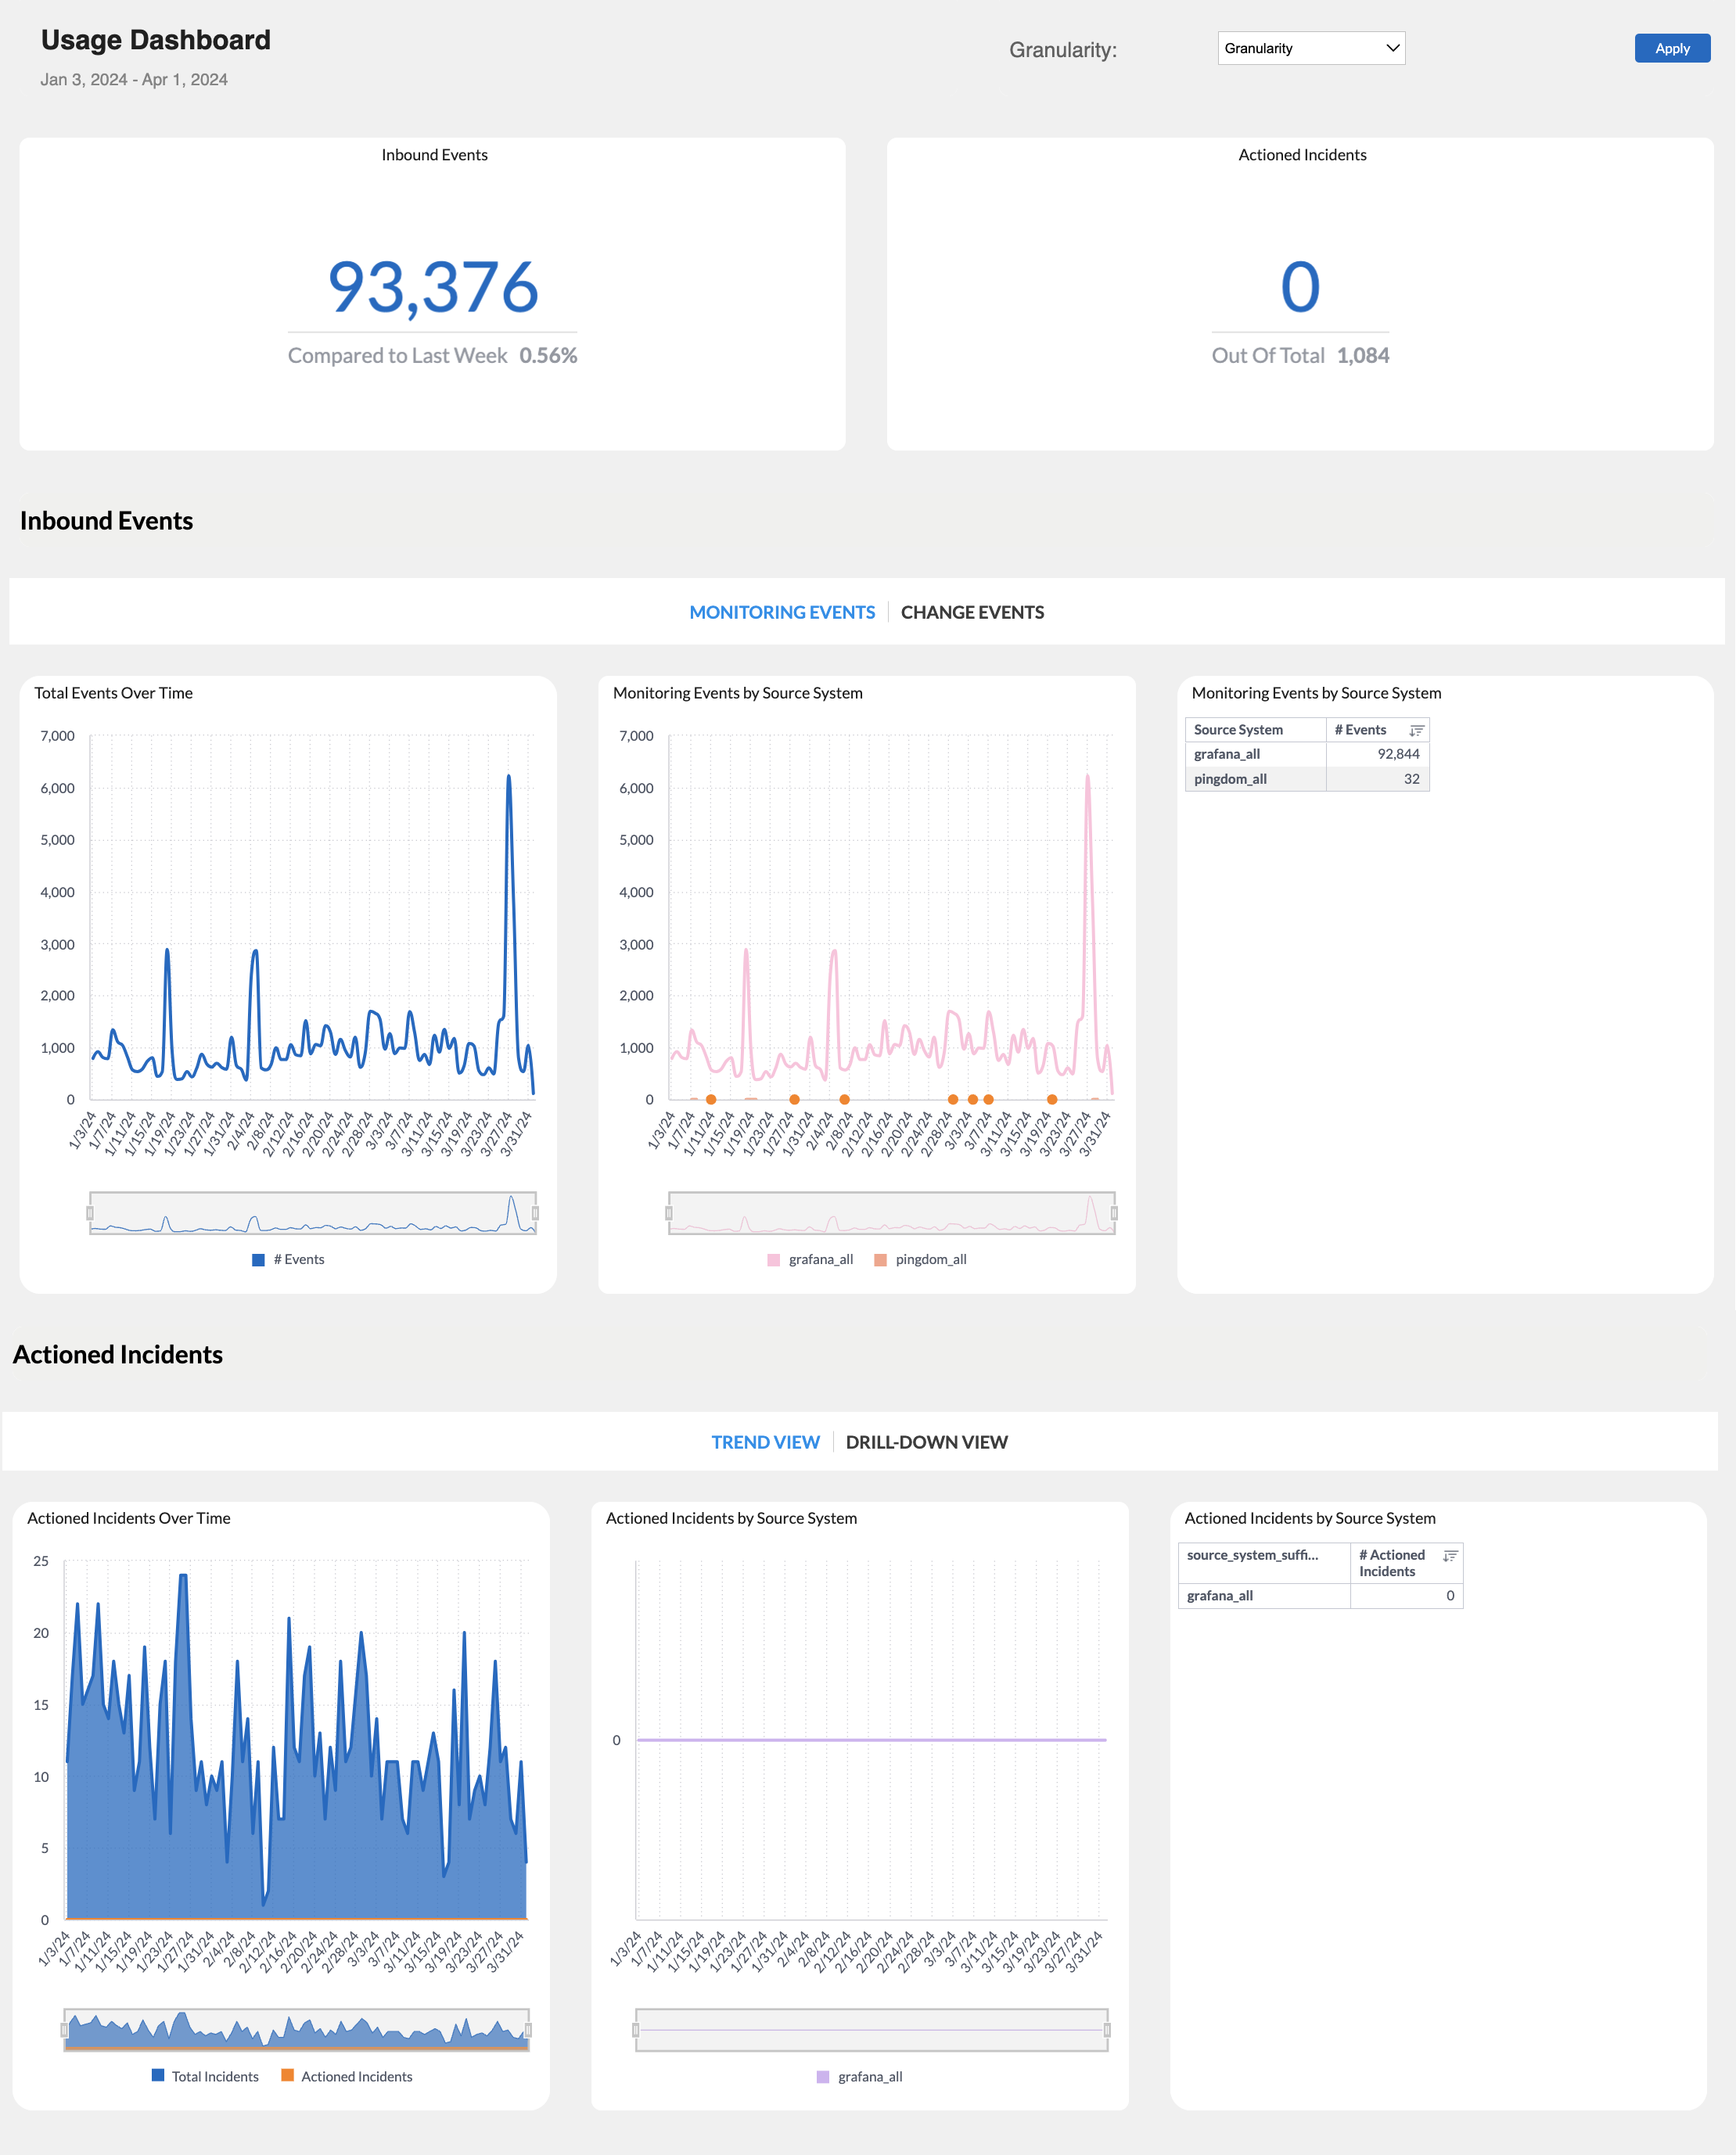
The Usage dashboard provides a clear line of sight into the volume of events and incidents within BigPanda. You can use this dashboard to quickly view at a glance the number of events ingested into BigPanda, and the number of actioned incidents across your platform.

Usage Dashboard
Dashboard Duplication
The Usage dashboard cannot currently be duplicated. See the Unified Analytics Dashboards documentation for a full list of duplicable dashboards.
Key Features
The dashboard allows you to:
- Visualize and track usage statistics across your organization.
- Filter by Source System and by date-range.
- Use the Granularity dropdown to break results out by hour, day, month, or year.
- Get detailed visibility of your incidents by action type.
For more information about working with this and other Unified Analytics dashboards, see the View Unified Analytics documentation.
Consumption Pricing Insights
For organizations on a consumption-pricing model, this dashboard also gives visibility into how credits are being consumed. Use the Usage dashboard to monitor your usage to prevent surprises and help determine when you need to obtain additional credits.
Credits are typically consumed based on:
- Inbound Events - A monitoring or change event sent to BigPanda from an external system. Events may include metric changes, status change, an email, a change event, and more. Events are counted before deduplication, alert filtering, and suppression from maintenance plans within BigPanda. Events are not counted if they are filtered within the integration itself before reaching BigPanda.
- Actioned Incidents - A group of one or more Events that has had a qualifying action performed on it. Qualifying actions include Comments, Assignments to a user, and Manual or Automated Shares.
Actioned Incidents
Incidents are classified as Actioned once a single qualifying action has occurred. BigPanda usage counts the number of incidents that have been actioned, but does not count individual actions. For detailed statistics on incident actions, see the Unified Analytics dashboards.
For details on pricing, events, or actioned incidents, refer to your BigPanda contract.
Widgets
The dashboard includes several widgets.
Each widget shows data based on the overall dashboard filters. Some widgets leverage a unique time or date-range setting and will not update with the overall dashboard.
| Widget Name | Explanation |
|---|---|
| Inbound Events | The number of inbound events, and the percent changed compared to the past week. |
| Actioned Incidents | The number of actioned incidents, and the total number of incidents. |
Inbound Events
The Inbound Events section can be updated to display information related to either monitoring events or change events. To change the widgets displayed, select Monitoring Events or Change Events.
If your organization is not sending change data to BigPanda, no widgets will appear when clicking the Change Events option.
| Widget Name | Explanation |
|---|---|
| Total Events Over Time | This widget appears when the Monitoring Events option is selected. The trend of how many events were ingested per hour, day, or month. |
| Monitoring Events by Source System (Graph) | This widget appears when the Monitoring Events option is selected. The number of monitoring events ingested for each of the source systems sending the highest number of events. |
| Monitoring Events by Source System (Table) | This widget appears when the Monitoring Events option is selected. A detailed breakdown of the number of monitoring events ingested per source system. |
| Change Events by Source System (Graph) | This widget appears when the Change Events option is selected, and if your organization is sending change data to BigPanda. The number of change events ingested for each of the source systems sending the highest number of change events. |
| Change Events by Source System (Table) | This widget appears when the Change Events option is selected, and if your organization is sending change data to BigPanda. A detailed breakdown of the number of change events ingested per source system. |
Actioned Incidents
The Actioned Incidents section can be updated to display either trends or detailed information. To change the widgets displayed, select Trend View or Drill-Down View.
| Widget Name | Explanation |
|---|---|
| Actioned Incidents Over Time | This widget appears only when the Trend View option is selected. The trend of how many incidents were marked as actioned per hour, day, or month. The line represents the number of actioned incidents. The grey section is the total number of incidents. |
| Actioned Incidents by Source System (Graph) | The number of actioned incidents for each of the source systems sending the highest number of events. If an incident is associated with more than one source system, it will be counted for each source. |
| Actioned Incidents by Source System (Table) | A detailed breakdown of the number of actioned incidents per source system. |
| Actioned Incidents Breakdown | This widget appears only when the Drill-Down View option is selected. |
Next Steps
View Unified Analytics dashboards
Learn how to Manage Unified Analytics
Find definitions of Unified Analytics key metrics
Dive into potential reporting fields in Unified Analytics Reporting Tables
Updated 26 days ago
