Suspected Changes Analysis
Use the Suspected Changes Analysis dashboard to view data on suspected root cause changes in BigPanda.
Root Cause Changes (RCC) dramatically speeds up the process of identifying the changes that cause issues and outages. First, RCC collects change information through inbound change integrations. Then, BigPanda's AI technology analyzes these changes against your existing incidents in real-time, to identify and surface the suspected root cause right alongside that incident.
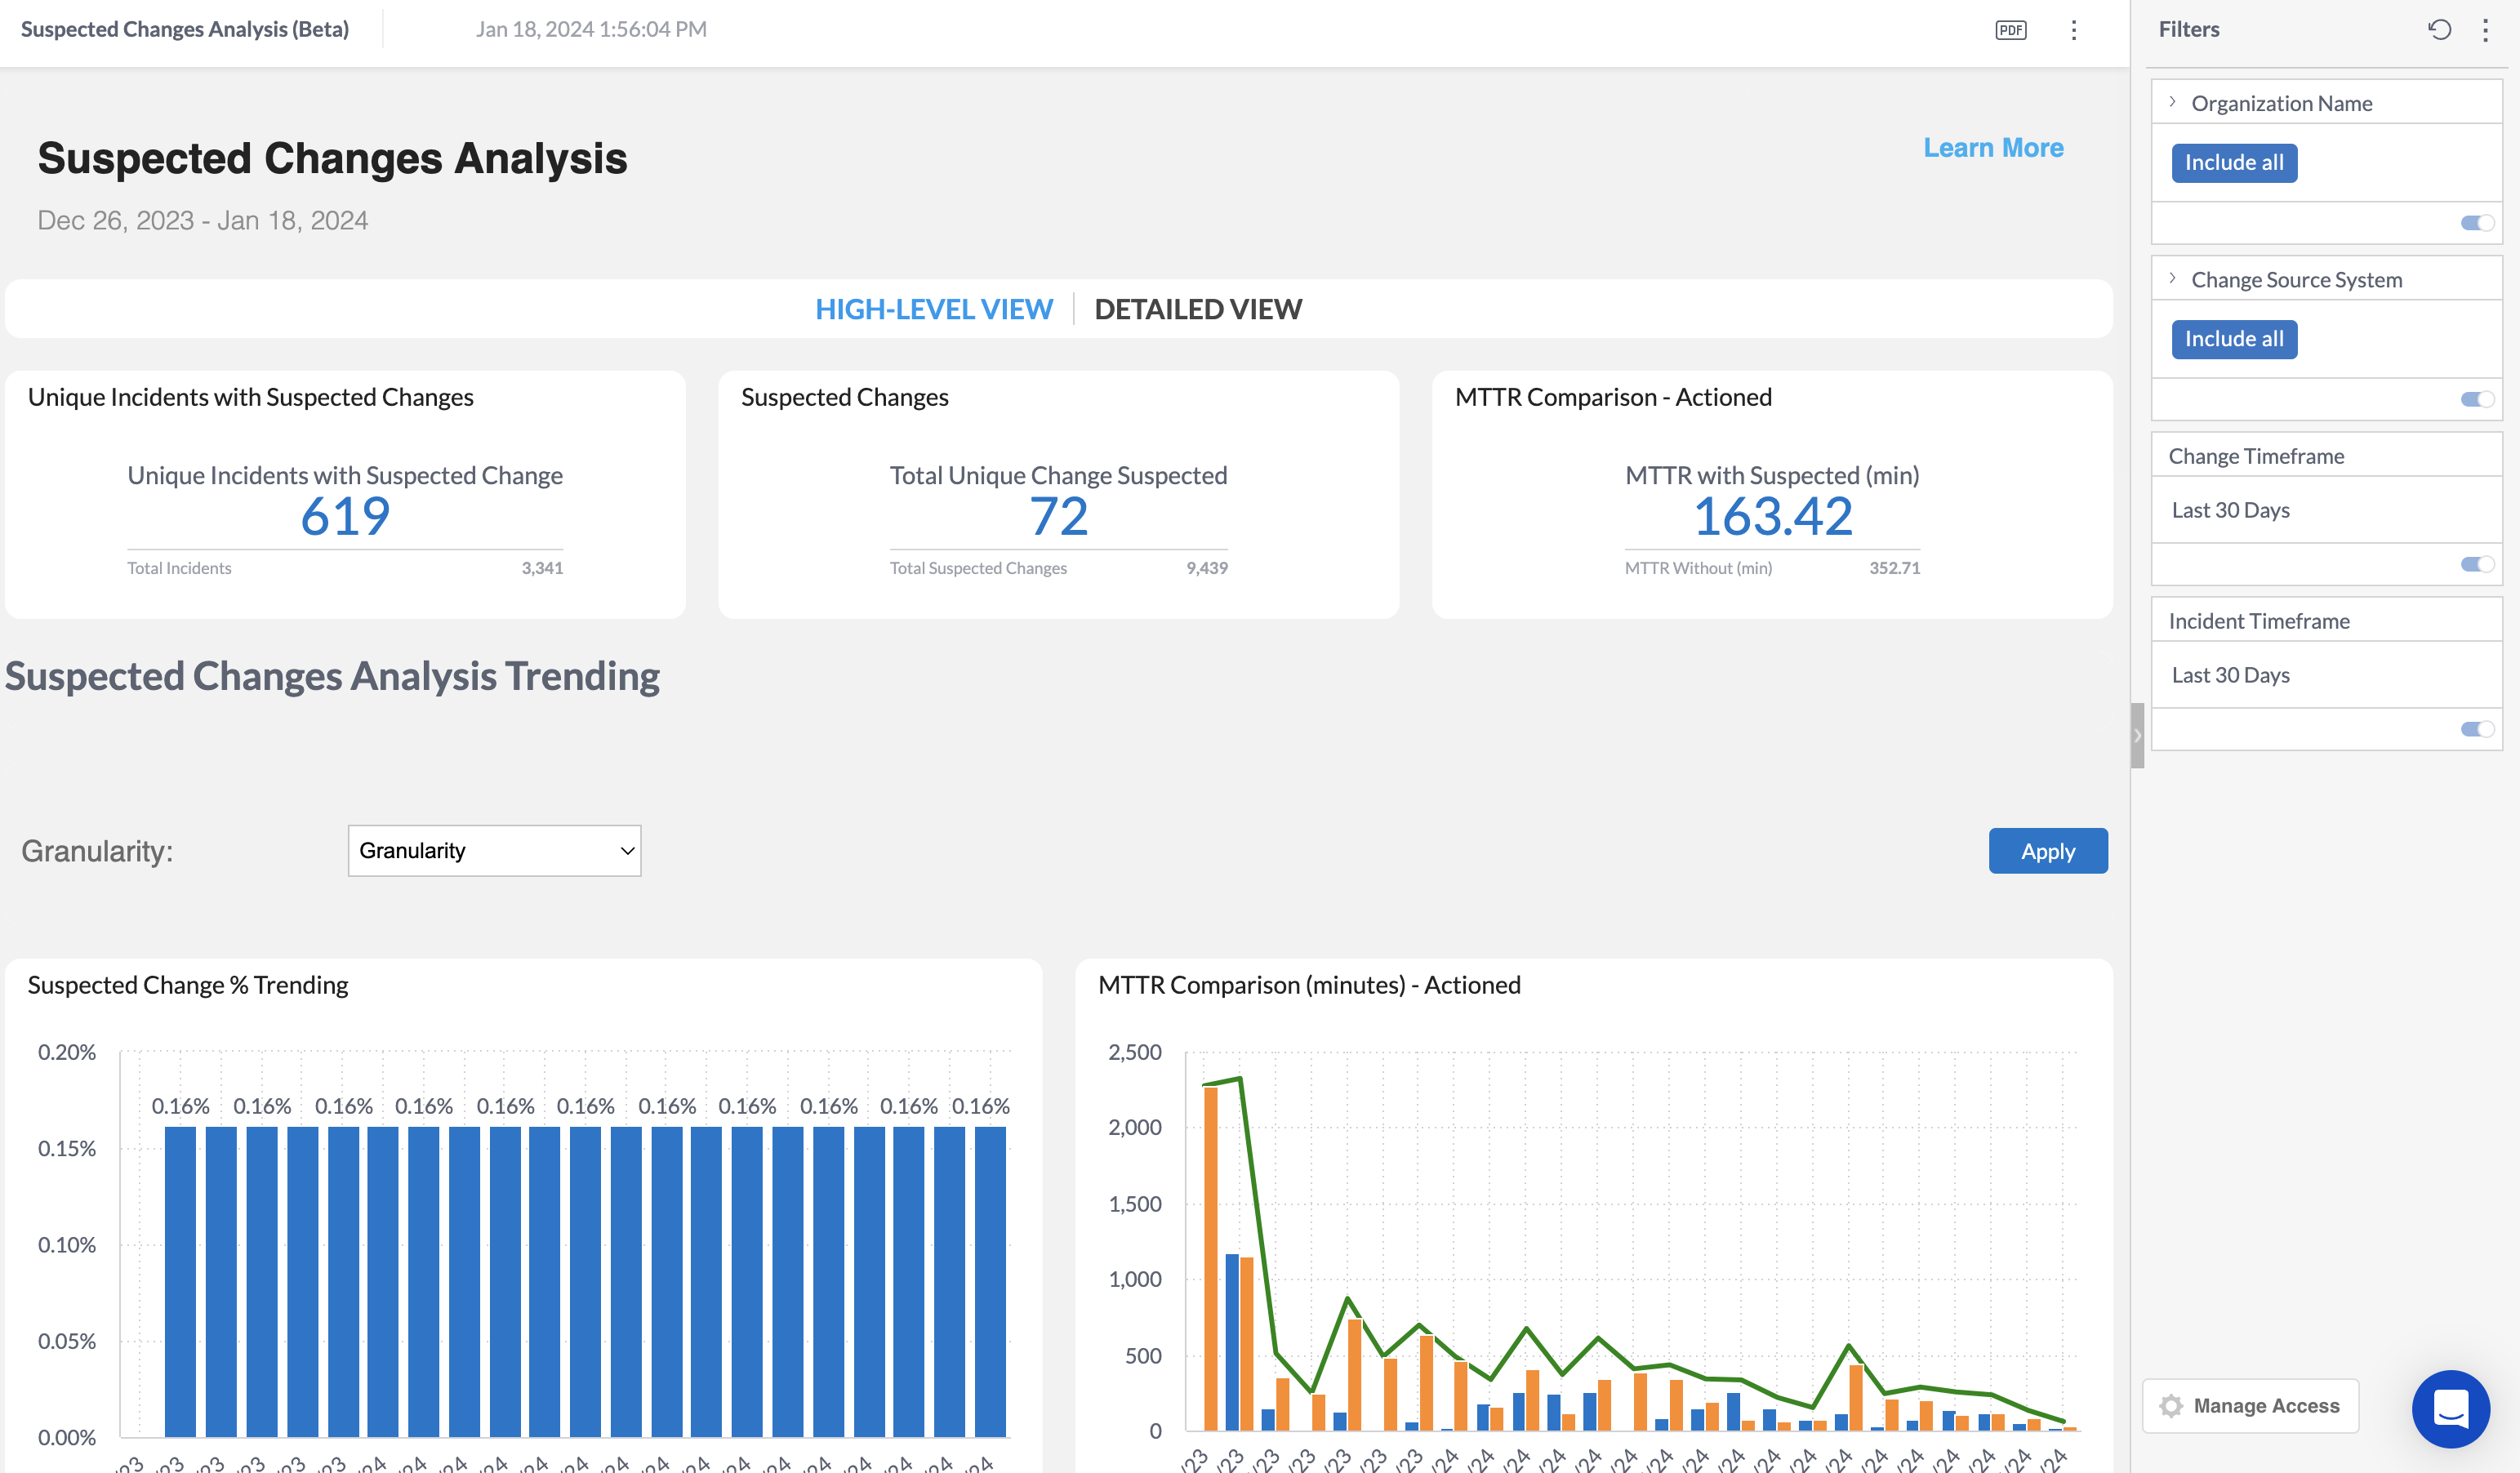
The Suspected Changes Analysis dashboard shows you the number of change suspects across incidents in BigPanda, as well as the impact on incident Mean Time to Resolve (MTTR). This information can help you fine-tune your RCC configuration, so your team can work even more quickly and effectively.

Suspected Changes Analysis Dashboard
Dashboard Duplication
The Suspected Changes Analysis dashboard cannot currently be duplicated. See the Unified Analytics Dashboards documentation for a full list of duplicable dashboards.
Key Features
- View the percent of incidents that contain a suspected change.
- Measure the effect that changes are having on MTTR.
- Assess the top change categories and change tag matches
- Determine the overall quality of changes sent to BigPanda.
Widgets
The top section of the Suspected Changes Analysis dashboard can be updated to display either high level or detailed information. To change the widgets displayed, click High-Level View or Detailed View.
| Widget | Description |
|---|---|
| Unique Incidents with Suspected Changes | To view this widget, select High-Level View. Displays the number of unique incidents containing a suspected change, and the total number of incidents. |
| Suspected Changes | To view this widget, select High-Level View. Displays the total number of unique change suspects, and the total number of all change suspects. |
| MTTR Comparison - Actioned | To view this widget, select High-Level View. Displays the average MTTR in minutes of actioned incidents with change suspects, and the average MTTR in minutes for incidents without change suspects. |
| Change Suspect Score | To view this widget, select Detailed View. A table displaying details about each category value. The following information about each tag is displayed: - Change tag name - Number of unique changes with the tag - Average change score |
| MTTR Comparison by Source System | To view this widget, select Detailed View. A table displaying the average MTTR in minutes of incidents with change suspects and without change suspects, broken down by source system. |
Suspected Changes Analysis Trending
The Granularity drop-down menu above the Suspected Changes Analysis Trending widgets allows you to select the time period for the widgets in this section.
Select from Years, Quarters, Months, Weeks, Days, or Hours.
| Widget | Description |
|---|---|
| Suspected Change % Trending | A bar chart showing the percent of incidents containing a unique suspected change, over the selected time period. |
| MTTR Comparison (minutes) - actioned | A bar chart comparing the MTTR in minutes of incidents with and without a change suspect, and the average MTTR of all incidents over the selected time period. |
| Suspected Change Score (average) | A bar chart showing the average suspected change causation score over the selected time period. Each incident-change match is given a causation score based on the RCC logic configured. Higher scores indicate a more likely suspect. See Manage the Root Cause Changes Configuration for more information. Changes with a high causation score are surfaced in the Incident Details pane as RCC Suspects. |
Suspected Change Analysis
The following widgets are available in the Suspected Changes Analysis section:
| Widget | Description |
|---|---|
| Alert Tag Value Match | A table displaying the number of suspected changes based on the combination of alert tag value matching logic. |
| Change Tag Category Match | A table displaying the number of suspected changes belonging to a specific change tag category. |
| Changes Suspected | A table displaying details about each unique change suspect. The following information about each change is displayed: - Change Key (URL) - Num. Incidents - Change Start - Change End - Source System - Summary |
| Incidents with a Suspected Change | A table displaying details about incidents that contain a suspected change. The following information about each incident is displayed: - Incident URL - Incident Start (date) - Incident End (date) - Status - Number of Changes |
Filters
The Suspected Changes Analysis dashboard allows you to filter by Organization, Change Source System, Change Timeframe, and Incident Timeframe.
The Change Timeframe filter allows you to filter by the creation date of a change. This filter only affects widgets that count changes, which includes the following:
- Suspected Changes
- Change Suspect Score
- Suspected Change % Trending
- Suspected Change Score (average)
- Change Tag Category Match
- Alert Tag Category Match
- Changes Suspected
- Incidents with Suspected Change
The Incident Timeframe filter allows you to filter by the creation date of an incident. This filter only affects widgets that count incidents, which includes the following:
- Unique Incidents with Suspected Changes
- MTTR Comparison - Actioned
- MTTR Comparison by Source System
- MTTR Comparison (minutes) - Actioned
Learn more about using filters and widget options in the Filter Dashboards documentation.
Updated 2 months ago
