Remediate Incidents
Remediation steps enable you to communicate with your team and quickly resolve incidents within BigPanda.
After an incident has been investigated and triaged, remediation steps allow you to quickly resolve the incident. The remediation process can help your team see what happened within the incident, allowing you to take the steps needed to prevent further events from the same tools.
During the remediation process, you can:
- Add comments, allowing other team members to view information about steps taken on the incident.
- Add incident tag values to enrich the incident with additional context.
- Correlate changes with incidents to help determine the root cause of an issue.
- Search for incidents within BigPanda.
- Resolve the incident within BigPanda.
For more information about the incident management process, see the Incidents in BigPanda and Triage Incidents documentation.
Comment on Incidents
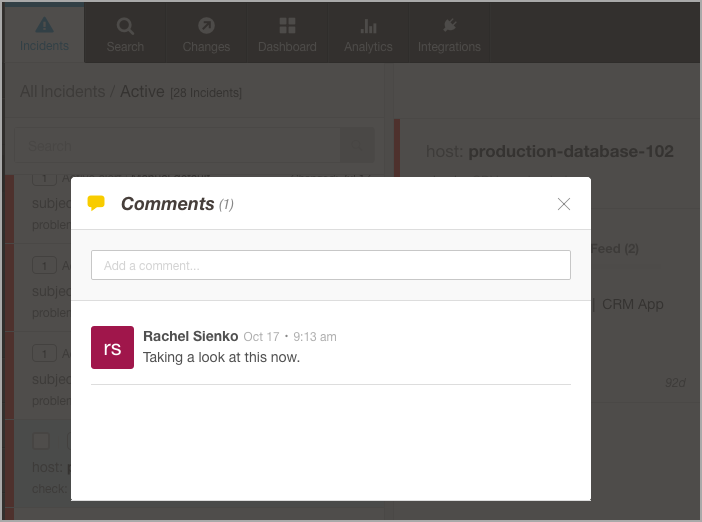
Comments Popup
Collaborate with team members by viewing and contributing to comments on an incident.
- Within an incident, click the Comments icon or, in the Incident Details pane at the top right, click the Comments icon.
- Add a comment or view previous comments from your colleagues.
Search for a specific comment using the Search bar at the top of the incident feed or in BigPanda's Search tab.
Character limit
The total length of comments for a single incident cannot be over 100,000 characters. Additional comment characters may be trimmed or have unreliable functionality.
Incident Tags
Incident tags add context and details to your BigPanda incidents, enabling better correlation and faster troubleshooting.
BigPanda takes the raw data from your systems and normalizes it into key-value pairs, called tags. Each tag has two parts: the tag name and the tag value. Tags are the fundamental data model for your alerts and incidents and provide vital incident enrichment.
In BigPanda, tags enable alert correlation, provide incident information in the UI, help you configure environments, perform searches, collect analytics, and configure AutoShare for certain integrations.
Incident tags are key-value pairs that allow you to quickly see summary information for a particular incident rather than needing to review all of the related alerts.
Relevant Permissions
Roles with the following permissions can access Incident Tags:
| Role Name | Description |
|---|---|
| Environments | View, create, edit, and delete Environments in the UI and view the incidents within them. |
| Incident Enrichment | View, create, and edit Incident Tags in BigPanda Settings. |
Permission access levels can be adjusted by selecting either View or Full Access. To learn more about how BigPanda's permissions work, see the Roles Management guide.
Use Incident Tags
Incident tags will appear on both the Incident Feed and in the Overview tab of the Incident Details pane.
Incident tags add key enrichment to your BigPanda incidents, helping you see key information about the event.
Information about the user who edited the tag, and the time and date of the change can be accessed by hovering over the name of the incident tag. Tags that have not been manually edited will show the last date and time that automatic incident enrichment occurred.
Users are able to manually assign or remove incident tags. To learn more about using incident tags with incidents, please see the Add or Edit Tag Values and Prioritize Incidents documentation.
You are able to create, edit, or inactivate incident tags to fit the needs of your organization. To learn more about configuring incident tags, please see the Manage Incident Enrichment documentation.
Incident tags may also be configured to automatically add values to specific incidents based on incident or alert criteria. To learn more about configuring automatic tags, please see the Automatic Incident Tags documentation.
If an incident has been manually split, the new incident will be created without any incident tag values. If incidents are manually merged, only the incident tags from the destination incident will appear on the merged incident. Source incident tag values will not be added to the destination incident.
Incident Tag Types
Incident tags may take the form of Priority, Free Text, or Multi-value tags.
Priority Tags

Priority Tag
By default, your environment will have Priority tags enabled, with pre-configured settings. These settings can be customized to better fit the needs of your organization. To learn more about customizing tags, please see the Manage Incident Enrichment documentation.
Priority tags are visible at the top left of incidents in both the feed and the details Overview tab, next to the incident severity. Incidents that have not been prioritized will not show the priority icon.
Priority can be assigned from the incident feed or from the Overview tab of the incident details pane. To learn more about using priority tags, please see the Prioritize Incidents documentation
Free Text and Multi-value Tags
Free Text and Multi-value tags add data sets with additional information, details, or other enrichment to your incidents. Each tag is made up of a customized value pair similar to BigPanda alert tags.
Free Text and Multi-value tags appear at the top of the Overview tab of the incident details pane.

Free Text and Multi-Value Tags
Each tag is made up of the name of the tag, and the tag value (for example: Source System: Nagios). For free text tag types, the value is a single text string. For multi-value text tag types, the value is one or more individual text tags. These appear as individual items beside the tag name.
The incident tags available in the Incident Details pane are configured by your BigPanda admin. To learn about creating incident tags, see the Manage Incident Enrichment documentation.
Closed-List Tags (Single-Value and Multi-Value List)
With closed-list tags, you can add or update values for an incident tag by selecting one or more values from a list defined by your BigPanda administrator.
There are two closed-list tag types: single-select and multi-select. Single-select tags allow you to select one value from a closed list, while multi-select tags allow you to select multiple values.
To learn about creating closed-list incident tags, see the Manage Incident Enrichment documentation.
Add or Edit Tag Values
Incident tags may already be populated with automatic tag values, or they may be empty. You’re able to add or edit tag values to update the incident with the latest information about the ongoing issue.
Not all tags can be edited. If a tag cannot be manually changed, a lock icon will appear to the right of the incident tag.
To add or edit tag values:
- In the Incidents tab, select an incident you wish to review.
- In the Incidents Details pane navigate to the Overview tab to view incident tags.
- Select a tag you wish to edit and click the pencil icon.
- In the Edit Incident Tag pop-up, enter the appropriate values in the editable field.
- Click Update to save.
Manually changing tag data will stop automated enrichment for this tag.
Tags can be single-select, multi-select, free text or multi-value text, and can have a typing field or a preset dropdown.
Free text tags allow you to include a single text string up to 256 characters. In typing field tags, type the full string of the value. For preset dropdowns, type to filter, and select the item from the list.
Multi-value text tags allow you to add several individual text strings. In typing field tags, type each value, and tap Enter or Tab on your keyboard to add another value. For preset dropdowns, type to filter, and select the desired items from the list.
Closed-list tags can be single-select or multi-select and will have a preset dropdown. For single-select tags, select one item from the dropdown. For multi-select tags, select any number of items from the dropdown. For either tag type, you can type to filter the dropdown list.
The name of the user who edited a tag and their changes can be viewed by hovering over the tag in the Incident Details pane and within the Activity feed. When hovering over the tag, tags that have not been manually edited will show the last date and time that automatic incident enrichment occurred.
Configuration Changes When Editing or Deleting Tag Values
Incident tag values are leveraged in many key features of BigPanda. Alert correlation, incident information in the UI, environments, analytics, saved searches, and AutoShare for certain integrations rely on incident tag values for configuration.
Changing what incident tag values are applied to incidents may have negative effects on dependent configurations. Before making changes to incident enrichment, we recommend consulting with your BigPanda administrator.
Manage Incident Tags
Incident tags can be configured to fit the specific needs of your organization. To learn more about configuring incident tags, please see the Manage Incident Enrichment documentation.
Correlate Changes with Incidents
Identifying the root cause of an outage or a poorly performing application is one of the biggest challenges that IT organizations face today, and the fast-changing nature of modern dev only makes that more difficult.
BigPanda’s Root Cause Changes (RCC) feature simplifies this process by collecting change data right into the incidents dashboard, and then leveraging BigPanda’s algorithms to identify changes that may have led to incidents.
Advanced Insights Module
This feature is part of the Advanced Insights Module. If your organization has not purchased this module, you may not have access to the feature.
If you are interested in upgrading to the Advanced Insights Module, contact your BigPanda account team.
Use the Changes section and suggested matches to search and mark suspect changes and collaborate with other users to investigate which change caused the incident.
Marking changes as the suspected or matched root cause change of an incident is a vital tool in identifying historically problematic changes.
See Incidents in BigPanda for more information about the Changes tab.
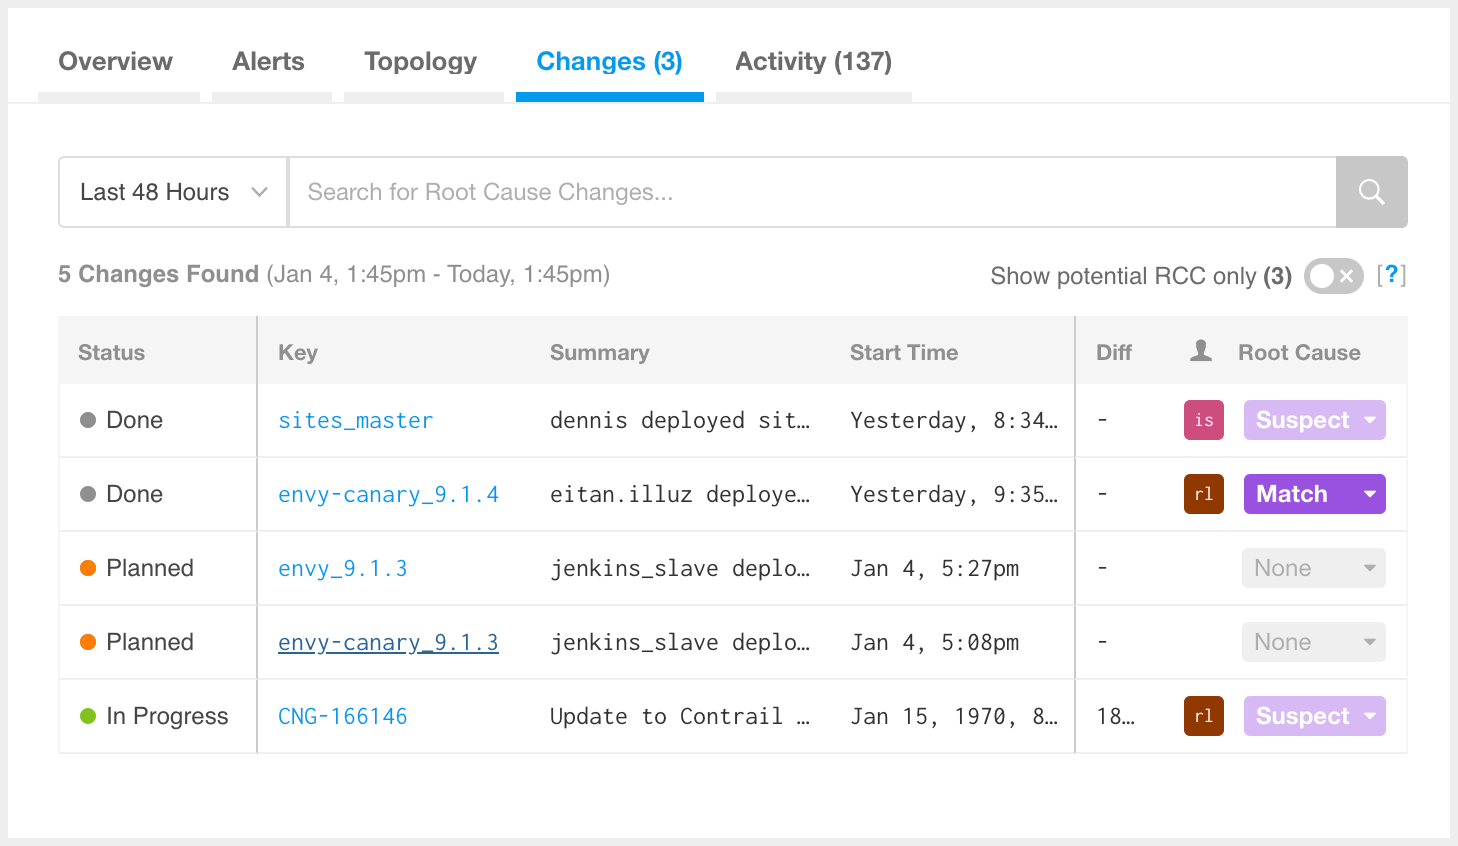
Changes Table
Search For Specific Changes
You can search the change table for changes that meet specific criteria and fall within a selected time frame. Use the time frame selection tool or the search bar at the top of the change table to find specific types of changes.
Select a Time Frame
By default, the Change Table displays changes that were active in the one hour before the incident started. You are able to select a different time frame from a set of options, or select a custom date range.
- To change the change table’s time frame, click the current time frame. From the dropdown, select the desired time window
- To filter by specific dates, select Custom Dates Range and enter the relevant dates and times in the dialogue box
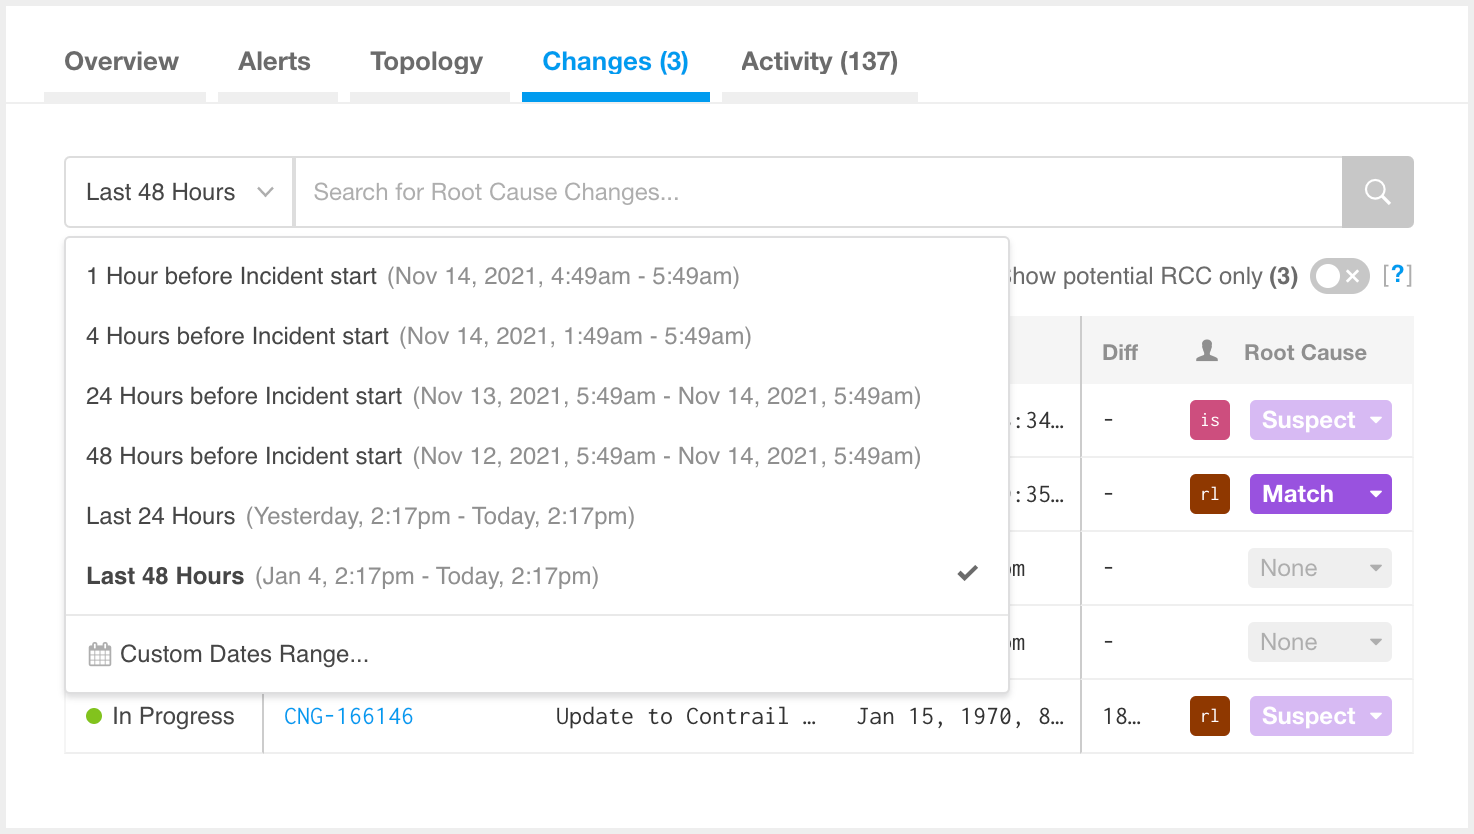
Time Frame Dropdown
The table displays changes that are active during a specified time frame. Changes are considered active if they:
- Start within the specified time frame
- End within the specified time frame
- Start before and remain active after the specified time frame
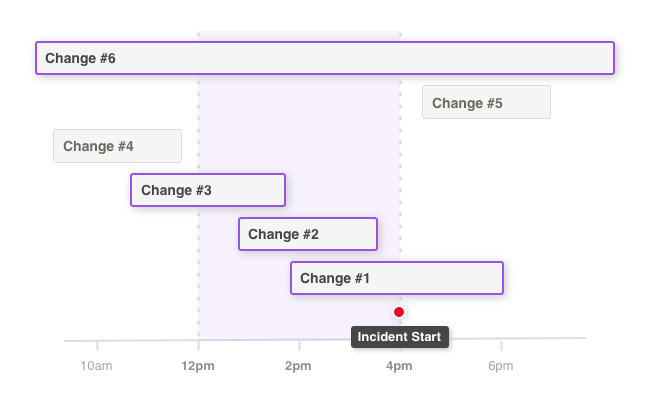
Change Time Frame Rules
When calculating time ranges, the root cause change algorithm rounds start times up and end times down to the nearest hour. When searching changes based on expected matches, you may see different results than the algorithm.
Search Changes
Changes can be searched using BigPanda Query Language (BPQL) to find specific tag values. Use free text, tag values, boolean, or regex queries to narrow the list of changes to only those that meet that requirement.
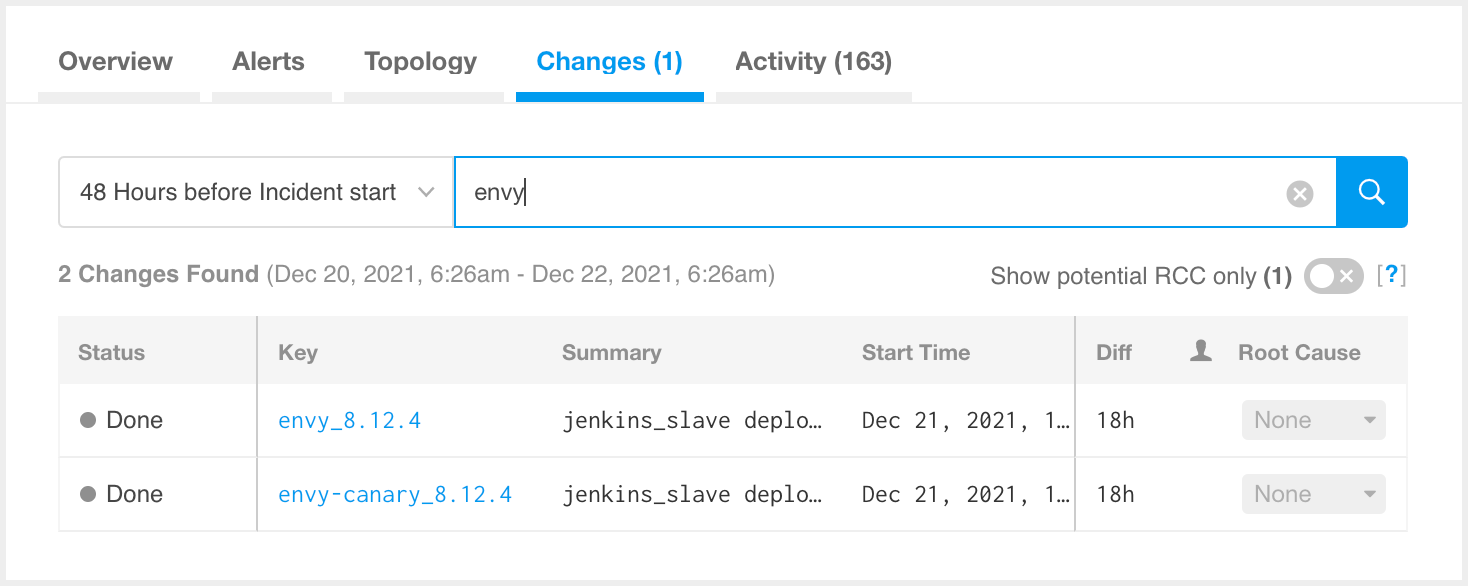
Searching the Changes Table
When searching for incidents using BPQL, the Query Assist feature is available to help you build a query. See Query Assist for more information.
View RCC Status Details
The Root Cause Change (RCC) status column lists whether a change has been identified as a suspected or matched cause of the incident.
Click on the RCC status for a change to see a popup that contains info about the user that set the status, the most recent activity, and its date/time. Any comment the user added when setting the status will be included in the popup.
If the RCC status was set by BigPanda’s algorithms, the blue BigPanda icon will appear in the user field. Hover over the information icon to get more details about why BigPanda suspects the change is the potential root cause of the incident.
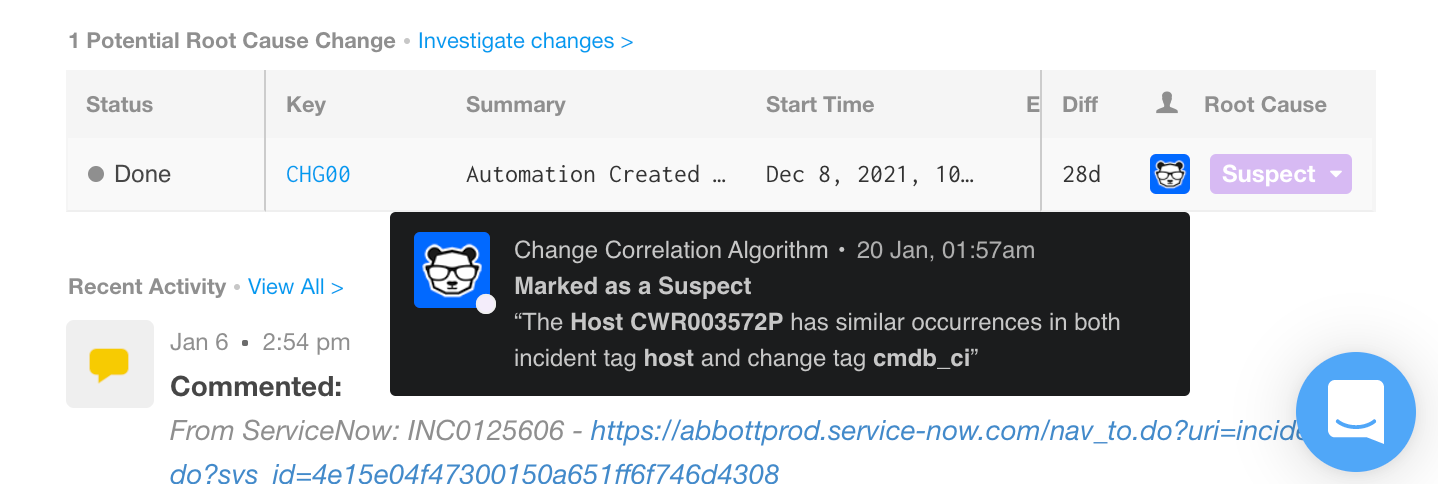
Details on Suggested Change
Mark Changes
Mark changes as suspected or matched root causes to record the connection between the change and incident for your team, analytics, and BigPanda’s algorithm.
Marking changes as Suspect or Match is a vital tool in training BigPanda to recognize patterns between incidents and changes in your system
All changes can be marked with 1 of 3 statuses related to an incident. Select the status that best describes the change’s relationship to the cause of the incident:
- None - The change is likely not the cause of the incident. This is the default RCC status.
- Suspect - The change may have been related to the cause of the incident. If BigPanda’s RCC algorithms believe there is a strong connection between a change and incident, it will automatically mark the change as Suspect.
- Match - The change is likely the cause or related to the cause of the incident. BigPanda will never automatically mark matches - changes can only be marked as a match by a human teammate.
To set a change RCC status:
- In the Change table, click the status dropdown for the change.
- Select the desired status.
- Click the status to enter a comment to add details or reasoning to the RCC status.
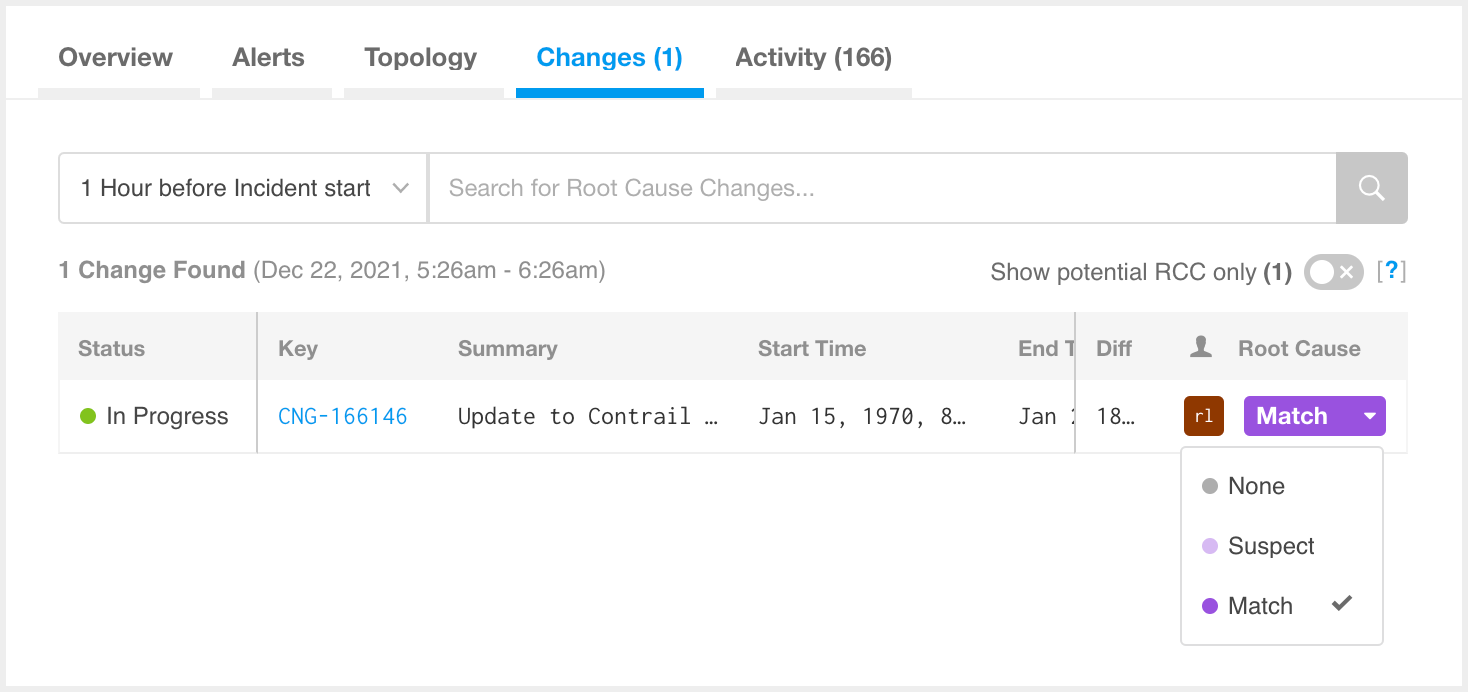
Marking a Change as Match
Comments can be a great foundation for collaboration and post-outage review.
When a different status is selected for a change, a record of the activity is created with information about who set the change status, when, and any comment associated with it.
In addition, activities related to RCC (ie: type and time of correlation, comments, latest interaction, etc.) are listed chronologically in the activity feed.
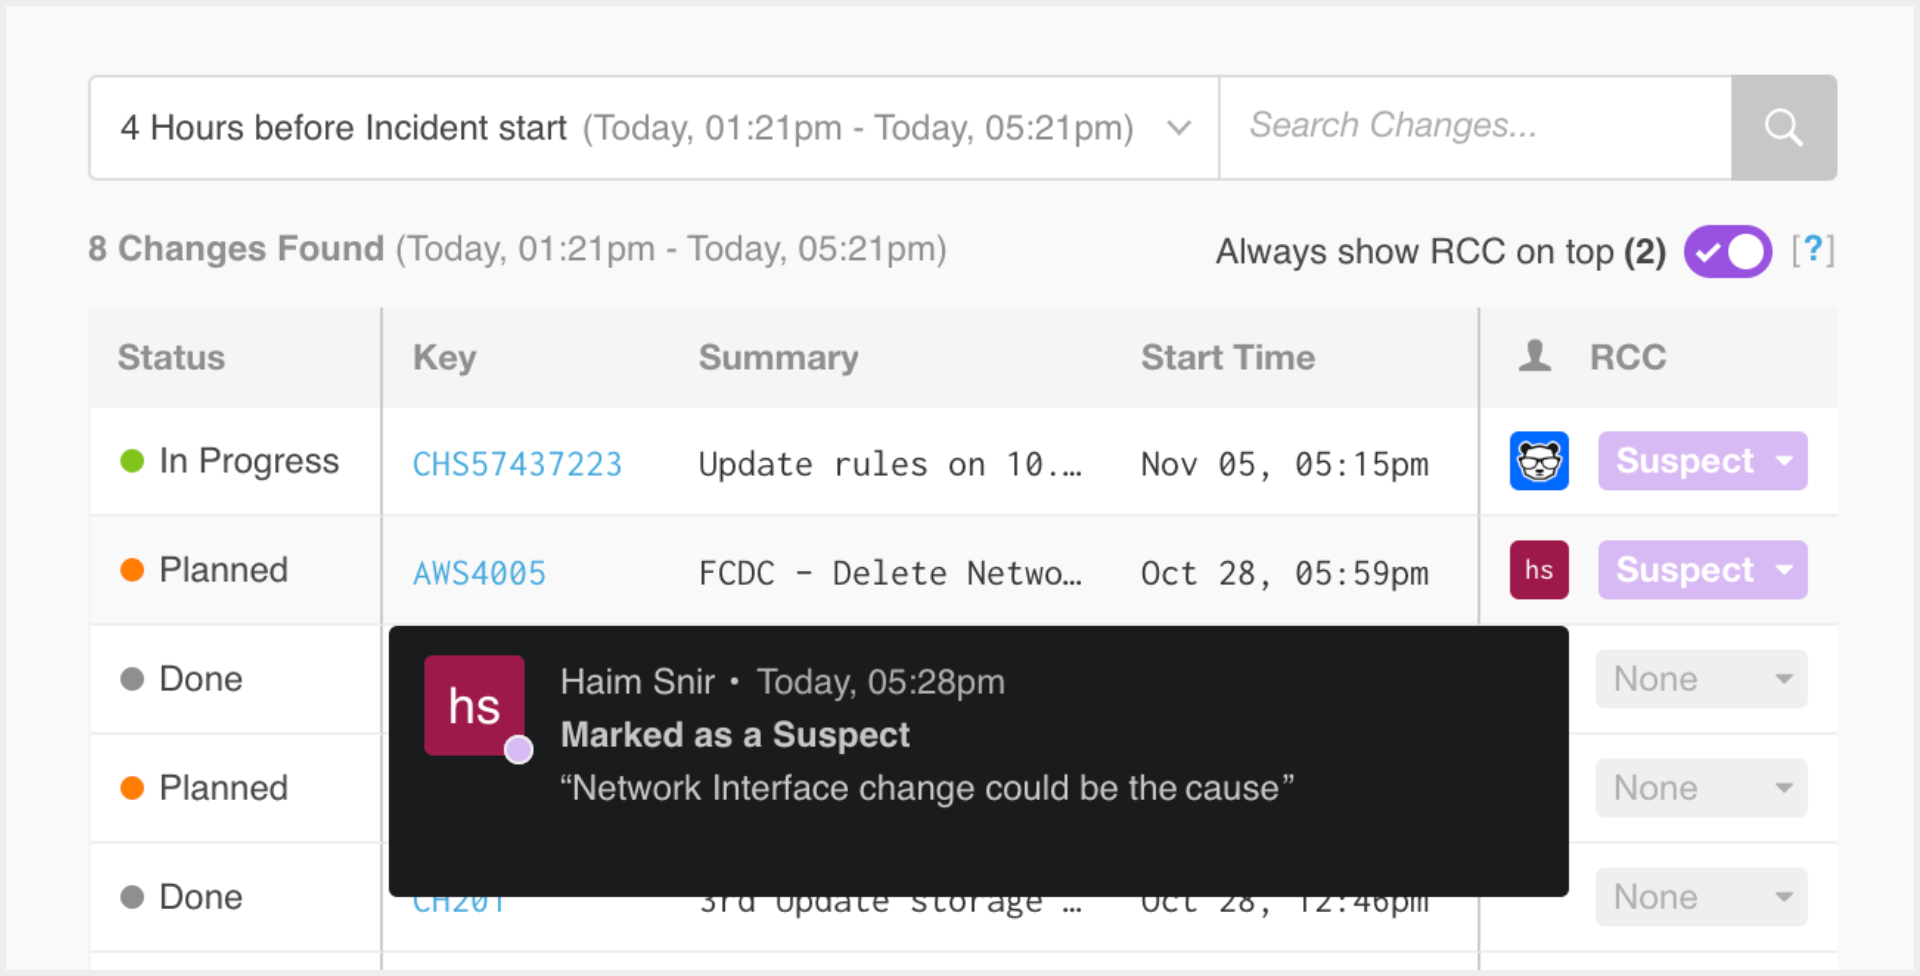
Marked as Suspect Note
Suggested Changes
BigPanda's algorithms automatically detect connections between changes made to the system and incidents.
As new incidents are created or new alerts join an existing incident, BigPanda calculates their match potential with each past change.
If a change with high match potential is found, BigPanda marks the change as Suspect and adds a comment to the info popup explaining why the change was marked. Suspected changes will appear on the Overview tab as well as at the top of the Changes table. Filter the table to show only suspected and matched changes by clicking the Show potential RCC only toggle.
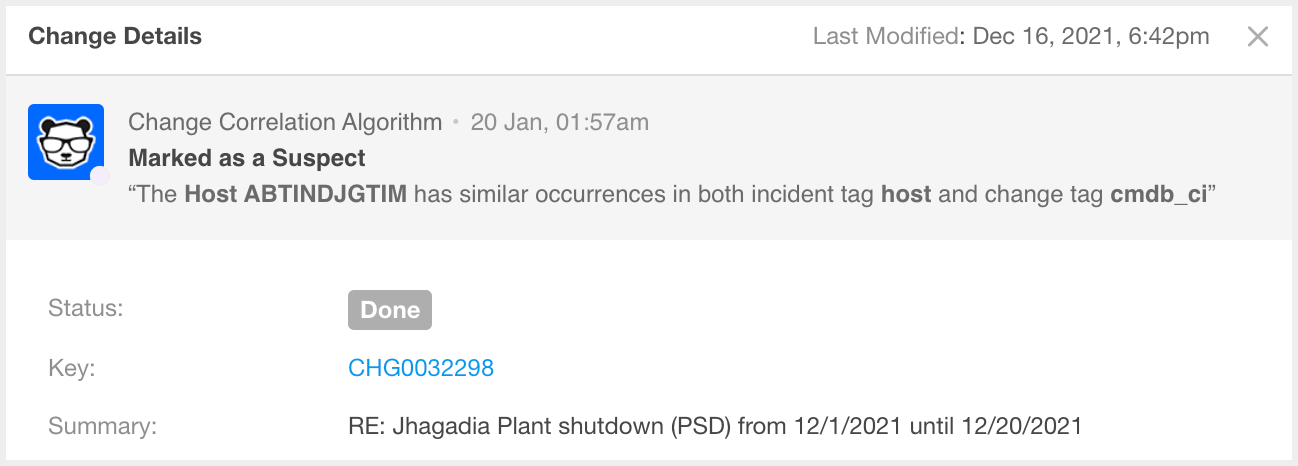
Suggested Suspect Change Reasoning
Suggested changes can rapidly speed up the root cause investigation process by identifying potential problems right at incident detection.
BigPanda will only mark changes as Suspect (not Match) to give users the final say on whether the change is the root cause of the incident
Search for Incidents
In BigPanda, you can use the Unified Search tab to investigate current and historical incidents across all of your integrated monitoring systems, which can help you find, solve, and prevent problems. Enter a keyword search or query, and apply filter criteria to narrow results. BigPanda finds all incidents with alerts that match your search criteria.
Use Unified Search
To search for incidents:
- At the top of the screen, click the Search tab.
- Enter a keyword search (term or exact phrase in quotes) or a query in BigPanda Query Language (BPQL)
Both keyword search and BPQL support regular expressions. - Select the filter criteria or leave the default settings.
- Click the search icon or press Enter.
The results page shows the total number of matching incidents and lists up to the first ten matches. - (Optional) Scroll down to view more results.
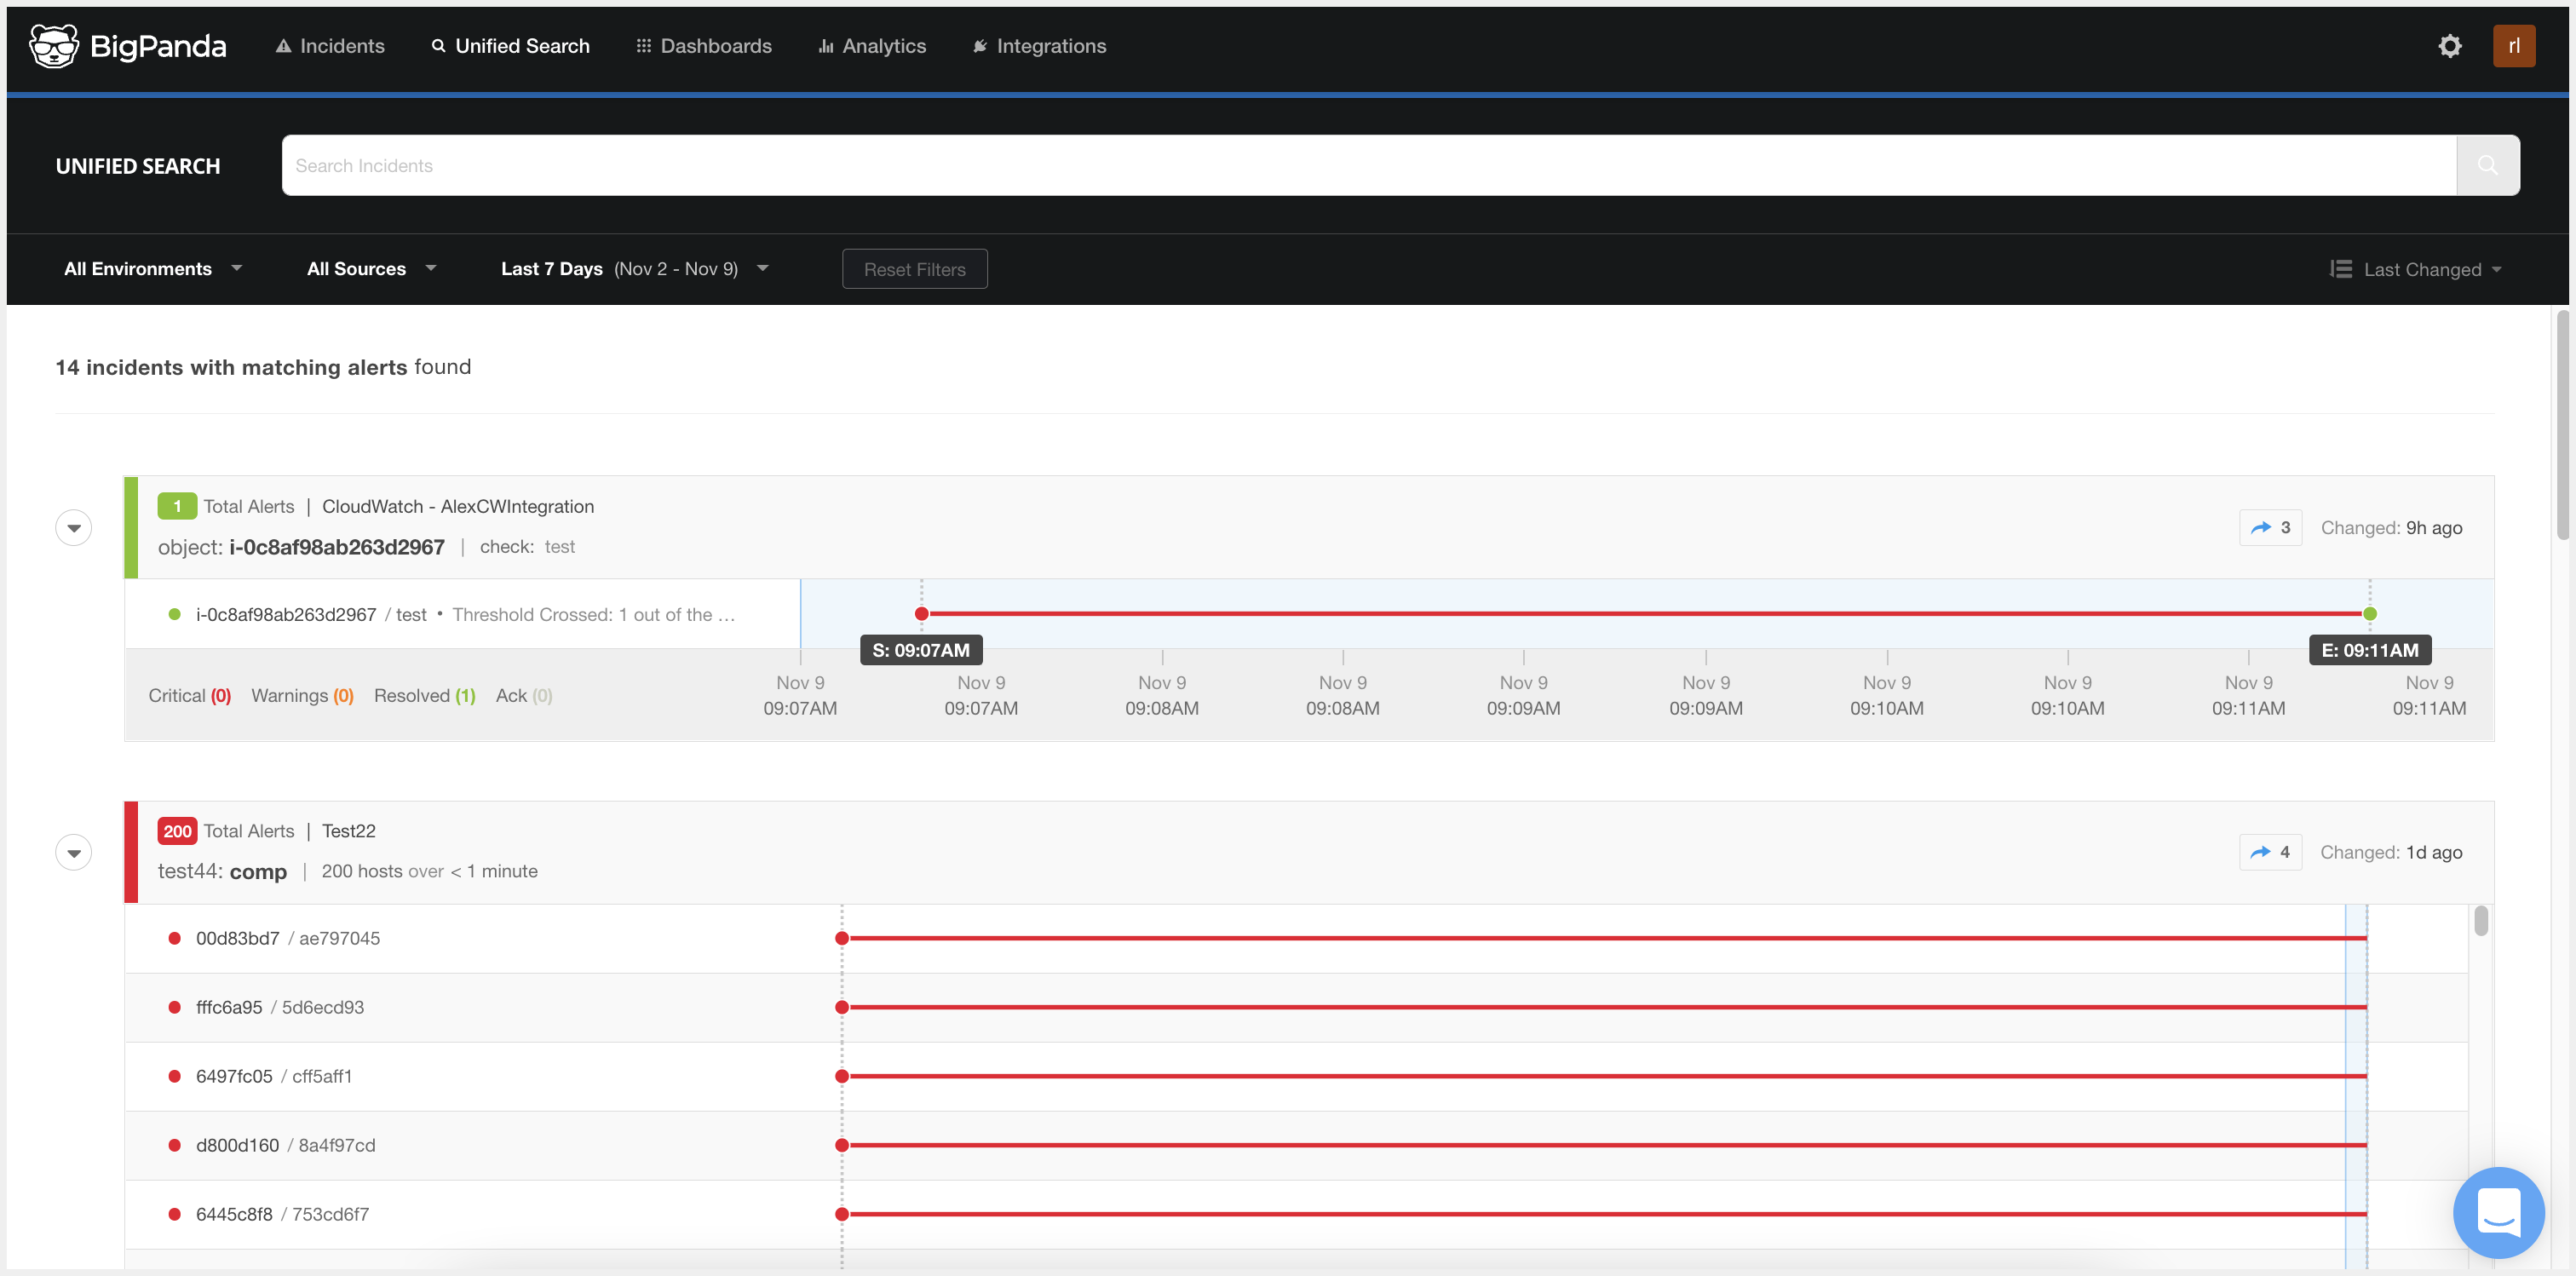
Unified Search
Tag Names In Different Monitoring Systems
If you don't see the results you were expecting, try adding OR conditions in your BPQL query to include similar values that may have different tag names in different monitoring systems (ie:
hostin Nagios andobjectin SolarWinds).
Keyword Searches
A keyword search looks for a value in descriptions, source system names, and in any tag—in contrast to a BPQL query, which looks for a value in a specific tag. For tags that contain multiple values, a keyword search will return a match if any of the values match the search term.
Examples of Keyword Search Queries
- Use an asterisk as a wildcard to match multiple values with a common element, ie:
phx*db - Add Quotes (" or ') around an exact phrase that contains spaces (spaces are allowed only between quotes), ie:
"CPU over 90*" - Add a slash (/) as the first and last character to search for values that match a regular expression (case sensitive and limited to 32,000 characters), ie:
/...Phx[0-9]{3}/
Keyword searches can find exact search terms between special characters without using wildcards. For example, if you search for
api, it matches all tags, source system names, and descriptions whereapiis present between special characters, such asprod-api-1andweb-api. You do not need to use wildcards; for example,_api_.
BPQL queries are in <tag> <operator> <value> format, using AND, OR and parenthesis to separate and/or prioritize multiple queries. For example:
host=srv-1 AND (check=chk-1 OR (check=chk-2 AND status=critical))
Filter Search Results
You can apply any of these filter criteria to narrow the results of your searches:
- Select the Environment.
- Select the source.
You can include all results from a source type (such as Nagios or New Relic). Or, you can include results only from a specific instance of the source type (for example, Nagios-US-EAST1). - Select a timeframe, or select Pick Date Range to enter specific dates and times.
The results will include all incidents that were created, updated, or ended in the time frame. An event sent to BigPanda that is deduplicated and correlated into an alert will not be included unless it also includes a state change.
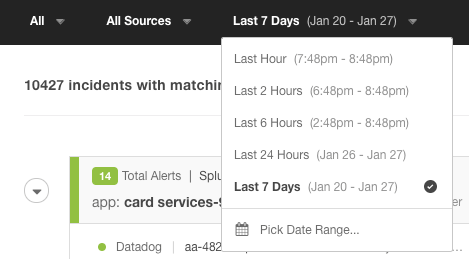
Search Results Filter
Default Filter Criteria
By default, search results display incidents in All Environments, from All Sources, that were active during the Last 7 Days. If you selected custom criteria, you can click Reset Filters to return to the default filter criteria.
Sort Search Results
You can change the sort order so that the results you want to see most are listed first. By default, incidents are listed in order by when they were last changed, with the most recently changed incident on top.
- On the top right of the results, click the Sort menu.
- Select the desired sort option:
- Last Changed - Time of the last change to the incident
- Status - Current status of the incident (Critical, Warning, Resolved or Acknowledged)
- Created - The time the first alert in the incident was received
- No. of Alerts - Number of active alerts in the incident(s)
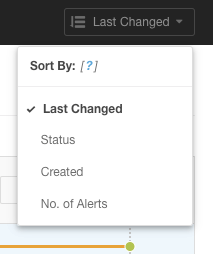
Sort-By Options
Review Search Results
The search results show basic information about incidents with matching alerts, including:
- Incident title and subtitle.
- Number of active alerts.
- Source system.
- Current status.
- List of the alerts that the incident contains, along with a timeline of status changes for each alert.
- Number of shares per incident.
- Number of comments per incident.
When searching for specific comments, the search results show all the information for each associated incident, not just the relevant comment. Click on the incident’s Comments icon to view the comments containing your search term(s).
Use the Timeline
The timeline shows the time frame for the filter criteria, highlighted in blue. It also shows the time when the first alert was received (incident start time) and the time when the incident was resolved (incident end time) or the current time if the incident is still active.
- To see the complete details for an alert at any point in its life cycle, click a dot on the timeline. Then, click the arrows to step through the details of every status change for the alert.
- To collapse the list of alerts and the timeline, click the arrow beside the row.
Link to Unified Searches
When you use Unified Search, the search parameters are appended to the URL of the results page. You can use this feature to share a link to your search with your teammates or to save a commonly run search as a bookmark.
To link to a Unified Search:
- At the top of the screen, click the Search tab.
- Run a search and apply filter criteria, as desired.
- To share the link, copy the URL in the browser address bar and send it to the desired recipients.
- To save the link, add a bookmark in your browser to the search results page.
Viewing Search Results
You must be logged in to BigPanda to view search results.
Search URL Parameters
BigPanda search URLs use standard formatting for each query parameter.
Syntax
The overall query syntax is built using parameter value pairs:
https://a.bigpanda.io/#/app/investigator?<parameter 1>=<value 1>&<parameter 2>=<value 2>
For example, a search for all Nagios events containing the value phx*db that were active at some time within the last hour, would have this URL:
https://a.bigpanda.io/#/app/investigator?query=phx*db&source=nagios.*&timeframe=-1h
Syntax Rules
- Use URL encoding to escape spaces and other unsafe characters.
- Parameters and values are case sensitive.
Parameters
| Parameter | Description | Example |
|---|---|---|
| query | Keyword or query in BPQL | query=host%3Dphx_db%20AND%20check!%3D_cpu* |
| environment | BigPanda Environment filter | environment=production |
| source | Source type or integration filter, in the following format:.: all integrations of the same source type- .: a specific integration | source=nagios.* source=nagios.nagios_us_east1 |
| timeframe | Time frame filters: -1h: last hour -2h: last 2 hours -6h: last 6 hours -24h: last 24 hours -7d%2Fd: last 7 days from, to: custom time frame with specific start and end times, in Unix Epoch timestamp (milliseconds) format. | timeframe=-7d%2Fd from=1456610400000&to=1458684000000 |
Environment and Source Values
The values for the
environmentandsourceparameters are unique, internal names that may be different from the descriptive names shown in the UI. If the URL parameters are not returning the expected results, try adjusting the filters on the Search tab and note the parameter values in the URL.
Search Incident Assignments
You can use Incident Assignments in Unified Search to search through current and historical incidents. Search for either the assignee or for the user who last changed the assignment (the assigner).
On the Search tab, enter a keyword searchfor the user's email address or type a more complex query using BigPanda Query Language (BPQL).
- For incidents assigned to a specific person, use the format: assignee =
- For unassigned incidents, use: *assignee != **
- For incidents where a specific person changed the assignee, use the format: assigner =
For more information, see The Unified Search Tab documentation.
Search Specific Tags
BigPanda normalizes alert data into attributes called tags. Use BPQL to search for values in any standard or custom tag and to create advanced queries. As you type, the search bar displays suggested tags and monitoring system names that are relevant to your search.
Search with Incident Tags
Incident tags and some incident metadata can be used to search and filter incidents. Standard incident tags that can be searched include source_system, status, assignee, assigner, severity, zero_impact, is_active, comment. See the Tag Naming documentation for a list of system limitations tied to specific tags.
To search or define BPQL conditions using incident tags, you need to use the Incident Tag ID rather than the incident tag name.
To see the incident tag ID, click an incident tag name in Query Assist. The tag ID is then populated in the search bar or input field.
Resolve Incidents
Most BigPanda incidents will resolve automatically when all alerts within the incident are marked OK by the monitoring system. If an alert never receives an OK status from the monitoring system, the incident will remain open within BigPanda.
If an incident is tied to a resolved issue, but has not been resolved in BigPanda, you can manually resolve incidents within BigPanda. Resolving incidents keeps your BigPanda dashboard clean and keeps your team focused on active issues.
Incidents can be resolved from the Incident Details pane on the Incidents tab.

Resolving Incidents
To resolve an incident:
- Select the incident.
- Click the Resolve incident checkmark icon in the top right of the incident feed or incident details pane.
- (Optional) Add a note to let your team know why you are resolving this incident.
- Click Resolve.
The incident will be resolved in BigPanda, updating any share recipients of the new status, and adding a Resolved Manually note to the activity log.
If any of the alerts within the incident are reopened, the incident will also reopen as normal. Learn more about what triggers incidents and alerts to reopen in the Incident Lifecycle documentation.
Resolve Alerts
Most BigPanda alerts are resolved automatically through an OK update from the monitoring system that created the alert.
If an alert isn’t resolved automatically, you can manually resolve alerts. Resolving alerts enables you to remove outliers, clean up outstanding events, and ensure that BigPanda incidents best match the real state of ongoing issues.
Alerts can be resolved individually or in bulk from the incident details pane on the Incidents tab.

Resolving Alerts
To resolve an alert:
- Select the incident that has the alerts to be resolved.
- In the incident details pane, locate the alert(s) to be resolved in the Active Alerts section of the Overview tab, or on the Alerts tab.
- Use the selection boxes to select the alert(s) to be resolved.
- Click the Resolve Alerts icon to the top right of the alerts table.
- (Optional) Add a note to let your team know why you are resolving this alert.
- Click Resolve.
The alert(s) will be resolved in BigPanda, and the activity log will show the alert(s) as Resolved Manually. If the alert resolution changes the status of the incident, shared recipients will be updated of the new status. If the alert was the only open alert for the incident, the incident will resolve as normal.
If the monitoring system sends an update that would reopen the alert, the alert and any related incidents will reopen as normal. Learn more about what triggers incidents and alerts to reopen in the Incident Lifecycle documentation.
Alerts can also be resolved through the Batch Alert Resolution API
Next Steps
Start Triaging Incidents in BigPanda
Learn more about Navigating the Incidents Tab
Dig into The Incident Life Cycle
Updated 9 days ago
