The Incident Console
The BigPanda Incident Console delivers an incident feed with intuitive usability and performance. The console allows you to accelerate your incident management workflow and surface more actionable insights.
Incident information in BigPanda is managed from a centralized location in the Incident Console within the UI. You can organize, assign, investigate, and escalate incidents as necessary to facilitate a quick resolution.
The Incidents Tab
The Environments Pane
Environments filter and group incidents based on properties such as source and priority for easy visibility and action. Environments make it easy for your team to focus on the incidents relevant to their role and responsibilities.
You can use environments to filter the incident feed, create dashboards, set up sharing rules, and simplify incident search.
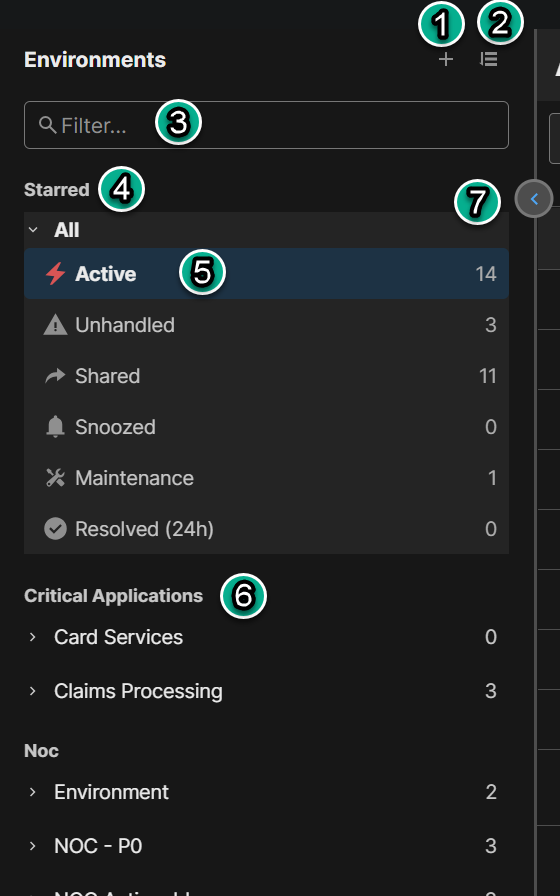
The Environments Pane
Field | Description | Related Links |
|---|---|---|
1 - Create a new environment or environment group | Click the + button to add a new environment or environment group. | |
2 - Sort Environments | Click the Sort icon to sort the list of environments Alphabetically or by Creation date. | |
3 - Filter Environments | Search the environments pane for a specific folder, group, or environment. | |
4 - Starred Environments | Environments that were starred appear at the top of the environments pane. | |
5 - Environment Folder | Each environment is automatically assigned status folders: Active, Unhandled, Shared, Snoozed, and Resolved. | |
6 - Environment Group | Environment groups organize your environments by common functions or properties such as business services, teams, and infrastructure areas. | |
7 - Collapse Environment Pane | Click the blue arrow to completely minimize the Environments pane. |
Incident Feed
The incident feed provides a view of all active incidents from the selected environment. You can use the feed to manage and take action on your incidents.
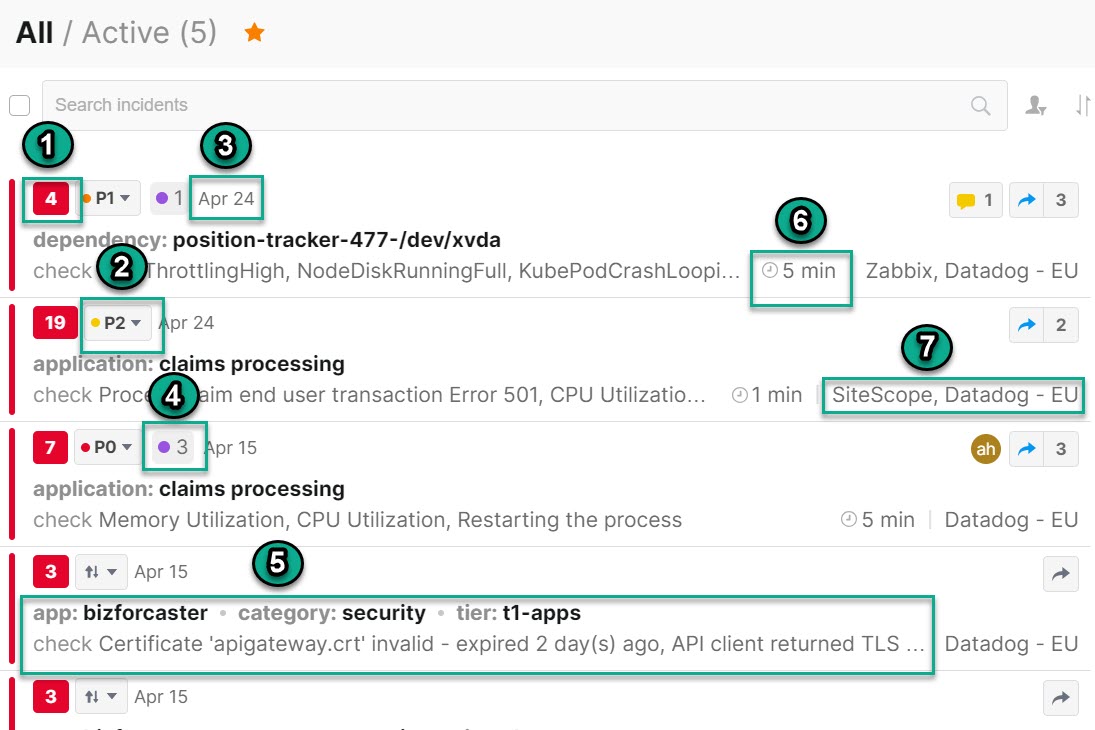
Field | Description | Related Links |
|---|---|---|
1 - Number of Active Alerts and Incident Status | The number of related alerts that are in the Critical or Warning state, and the incident status. The incident status is updated based on the status of the most severe active alert. | |
2 - Priority | The incident's assigned level of importance. | |
3 - Last Changed Date | The date when the last update in the incident occurred. | |
4 - Change Suspects | The number of root cause change suspects associated with the incident. | |
5 - Incident Title and Subtitle | Description of the incident that gives insight into the incident impact, correlation logic, and related alerts. The title is based on the primary property, and the subtitle is based on the secondary property. | |
6 - Time Window | The amount of time between the start of the first and last correlated alert. | |
7 - Source | The monitoring tool(s) where the events originated. |
Incident Actions
The incident action icons appear after hovering over an incident.
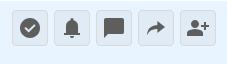
Incident Actions
Incident actions that can be performed directly from the feed include resolve, snooze, comment, share, and assign.
See the Respond to Incidents documentation for more information.
Find and Select Incidents
The incident feed contains options that help you find the exact incident or group of incidents that you need.
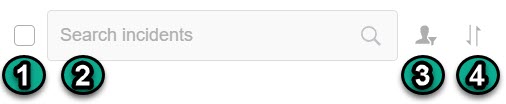
Search, select, and filter incidents
Field | Description | Related Links |
|---|---|---|
1 - Search or filter incidents | Search or filter for specific incidents. | |
2 - Select All | Click the box to select all of the incidents on the page. This allows you to perform actions on multiple incidents at once. | |
3 - Filter and Sort | The Filter option is used to filter the feed by the assignee. Use Sort to sort the incident feed by the selected property. The following options are available:
|
Incident Details Pane
The incident details pane provides a comprehensive view of all information related to an incident. Use the incident details pane to view incident history and take action on incidents.
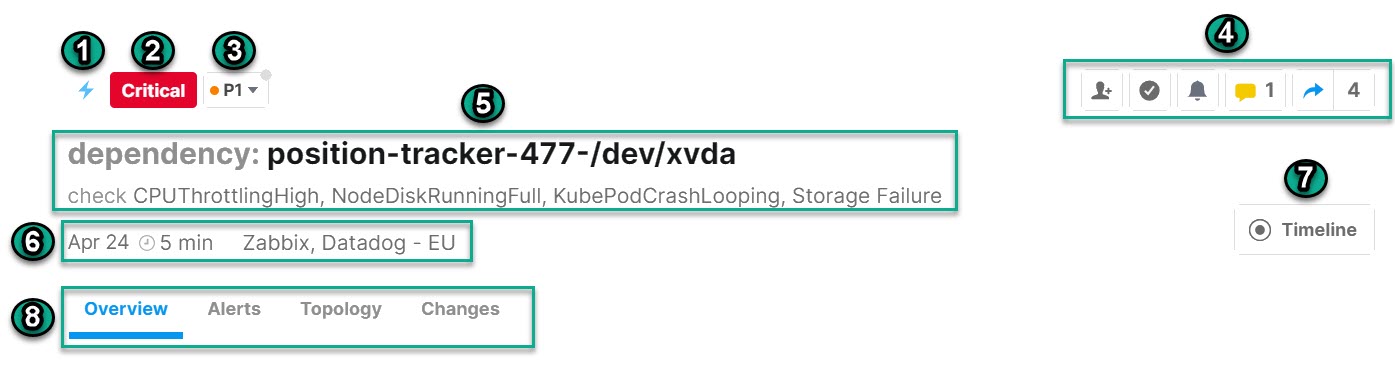
Field | Description | Links |
|---|---|---|
1 - Matched Correlation Patterns | Click the lightning bolt icon to see a list of matched correlation patterns for the incident. | |
2 - Status Indicator | Indicates the incident status, which is determined by the most severe status of the related alerts. | |
3 - Priority | Allows you to view or change the priority of the incident. | |
4 - Incident Actions | Provides access to the available actions for an incident, such as Assign, Resolve, Snooze, Comment, and Share. If the incident has already been shared, a number will appear next to the Share icon indicating how many times it has been shared. | |
5 - Incident Title and Subtitle | Description of the incident that gives insight into the incident impact, correlation logic, and related alerts. The title is based on the primary property, and the subtitle is based on the secondary property. | |
6 - Last Changed Date, Time Window, and Source | The last changed date is when the last change to the incident occurred. The time window is the duration between the start time of correlated alerts in minutes. The Source is the monitoring tool where the events originated. | |
7 - Timeline | Allows you to visualize the life cycle of an incident on a timeline, which helps you understand how the incident has unfolded. | |
8 - Tabs | The Overview, AI Triage, Alerts, Topology, Changes, Service Desk, Historical, Correlation, and Activity tabs are accessible from the center of the incident details pane. |
Next Steps
Learn more about Incidents in BigPanda.
Dig into how Incidents are created with BigPanda AIOps.
The Overview Tab
Automated Incident Analysis
Advanced Insight Module
This feature is part of the Advanced Insight Module. If your organization has not purchased this module, you may not have access to the feature.
If you are interested in upgrading to the Advanced Insight Module, contact your BigPanda account team.
Automated Incident Analysis leverages Large Language Model AI to provide plain-language incident titles and detailed descriptions built from enriched, actionable incident data.
Automated Incident Analysis helps your team quickly understand causality and impact, dramatically shortening resolution time.
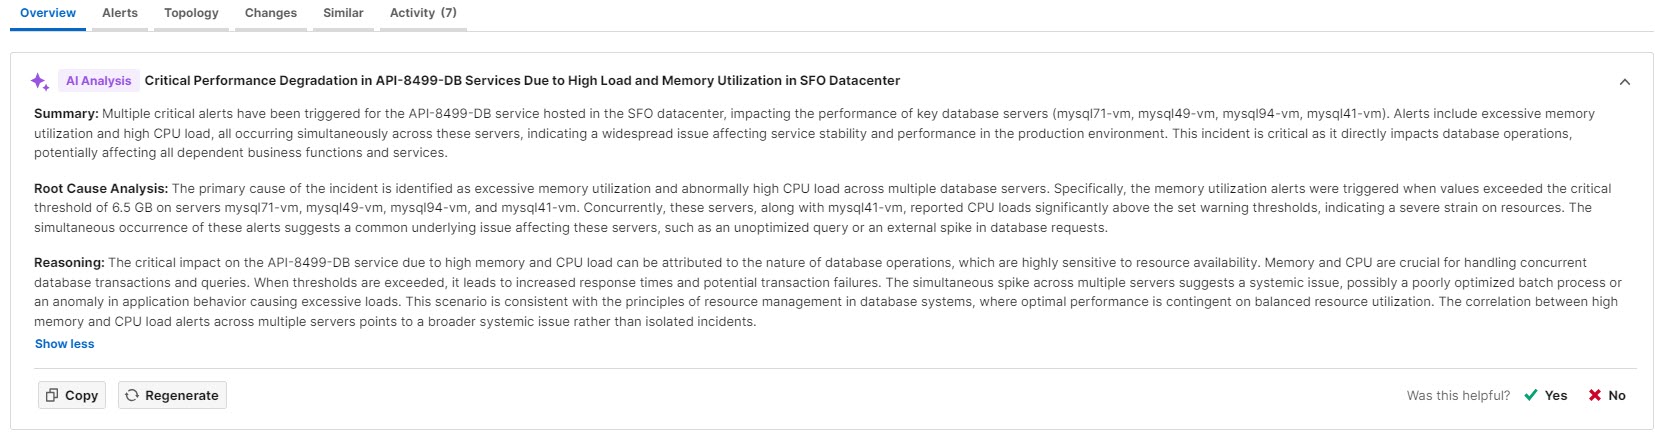
Automated Incident Analysis
For more information, see the AI Incident Analysis documentation.
Incident Tags
Incident tags add key information and context right in BigPanda.
Hover over the name of the incident tag to see information about the user who edited the tag and the time and date of the change. Tags that have not been manually edited will show the last date and time that automatic incident enrichment occurred.
Incident tags may be single-select or multi-value.
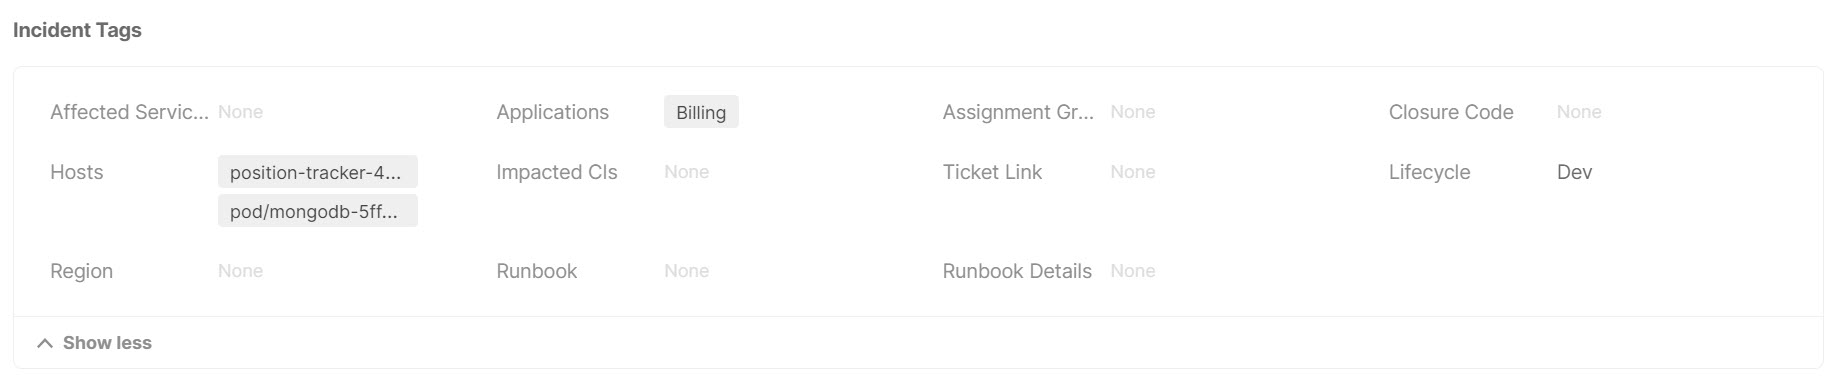
Incident Tags
See the Incident Tags documentation for more information.
Active Alerts
The Active Alerts section displays a summary of the information that appears in the Alerts Tab. Here you can find information about active alerts and take actions on them such as split and merge.

Active Alerts
See the Alerts Tab documentation for more information.
Root Cause Changes
The Root Cause Changes section shows you the change details, changes that were marked as a Suspect, and the change suspect score.

Root Cause Changes
To see full change details, see the Changes Tab .
Activity
The Activity section displays the five most recent activities from the Activity tab, with no filtering applied.
To see the full activity history, see The Activity Tab.
The Alerts Tab
Navigate the Alerts Tab
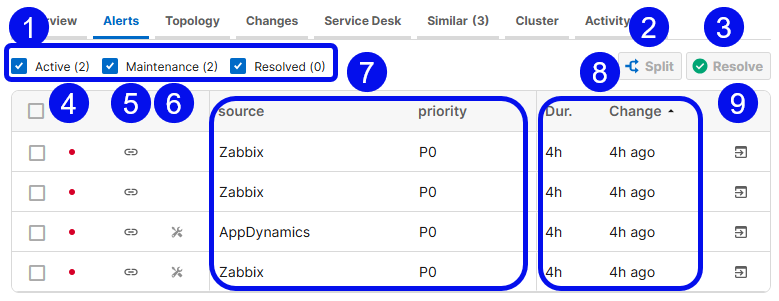
The Alerts Tab
Click any alert within the table to view additional details. The details that appear can be configured by your BigPanda administrator. See Manage Alert Views for information on tailoring the alert view.
Item | Description | Related Links |
|---|---|---|
1 - Alert Filters | Click a checkbox to filter the Alerts table. You can filter by Active, Maintenance, or Resolved alerts. Each checkbox displays the number of alerts that are currently in that state. Active alerts are currently in the Critical or Warning state. Maintenance alerts are alerts that are currently suppressed by a maintenance plan. Resolved alerts are alerts that have been either manually or automatically resolved. | |
2 - Split | Select one or more alerts and click the Split button to separate them into a new incident. | |
3 - Resolve | Select one or more alerts and click the Resolve button to resolve the alerts in BigPanda. | |
4 - Status Indicator | Displays a colored dot on the left to indicate the current status of a related alert. | |
5 - Link | If the alert contains links to more information, such as runbooks or time-series metrics, a clickable link icon will be displayed. | |
6 - Maintenance Icon | If the alert was matched to an active maintenance plan, the maintenance icon appears. Hover over the icon to see details about all matched maintenance plans for the alert. This column does not appear if no alerts in the incident were affected by maintenance plans. | |
7 - Alert Data | Displays the data for each related alert in a table. The column headers show the tag names and the rows show the tag values. You can drag the center divider to resize the incident feed, and columns are added, removed, or resized dynamically as space allows. Click the arrow icon at the far right of the Alerts table to open the Alert Info window, which contains full alert data. | |
8 - Duration and Last Change | The Duration column displays the amount of time since the first event for each alert. The Last Change column shows the time of the last status change for each alert. | |
9 - Open pane | Open the alert in a separate pane for easy viewing. |
The Topology Tab
The Topology Graph
Each node on the topology graph represents an alert tag value. The tags present in the incident are labeled by type and displayed as icons in the Topology graph.
The numbers in the corners of the nodes indicate the frequency with which each unique tag and value appears in the incident. The more times a tag appears, the higher the likelihood that it’s a contributor to the root cause of the incident.
The lines connecting the nodes in the graph indicate that the linked nodes appear in the incident’s alerts together. Examining nodes with the most links can provide valuable insight into the possible root cause of the incident.
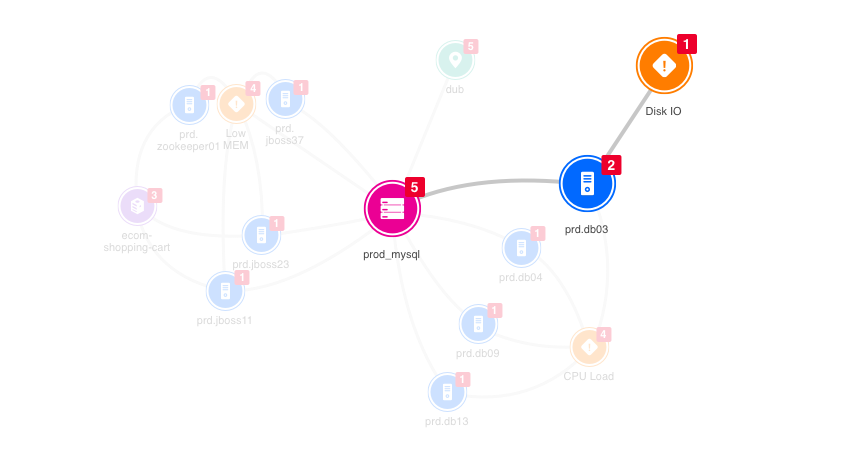
The Topology Graph
By default, BigPanda connects all the correlation tags into a circle. All the primary tags (ie: host) are connected to their associated correlation tags and the secondary tags (ie: check) are connected to their primary tags.
Customizing the Graph
Customizing the graph using the Topology UI API will override BigPanda's default configuration.
Topology Graph Icons
The default icons that comprise the Topology graph are permanent and pre-defined by BigPanda. Additional configurable fallback icons are provided to allow users to define their own custom nodes.
The following are the nine permanent icons provided by BigPanda to represent the Topology node tag types:
Icon | Type | Associated Tags |
|---|---|---|
 | server | 'server', 'servers', 'host', 'hosts', 'hostname', 'hostnames', 'host_name', 'host_names', 'device', 'devices', 'instance', 'instances', 'object', 'objects', 'node', 'nodes' |
 | location | 'location', 'locations', 'datacenter', 'datacenters', 'dc', 'store', 'stores', 'site', 'site_code', 'store_id', 'region', 'regions', 'city', 'country', 'geo' |
 | check | 'check', 'checks', 'trigger', 'triggers', 'alert_type', 'alert_name', 'health_rule', 'summary', 'monitor', 'health_rules', 'title', 'titles' |
 | environment | 'environment', 'environments', 'env', 'envs', 'tier', 'tiers', 'stage' |
 | application | 'application', 'applications', 'app', 'apps', 'service', 'services', 'business_service' |
 | IP | 'ip_address', 'ipaddress', 'ipaddresses', 'ip_class_b', 'ip_class_c', 'ip' |
 | router | 'router', 'routers', 'switch', 'switches', 'hub', 'repeater', 'bridge', 'gateway' |
 | cluster | 'rack', 'cluster', 'clusters', 'tower', 'towers' |
 | team | 'owner', 'owners', 'team', 'teams', 'group', 'groups', 'assignment_group', 'responsible_group' |
Filter
The node filtering options at the top of the Topology tab allows you to show or hide the nodes in the graph according to their corresponding tag type. The numbers beside the nodes in the filter represent the frequency with which the node appears in the topology graph.
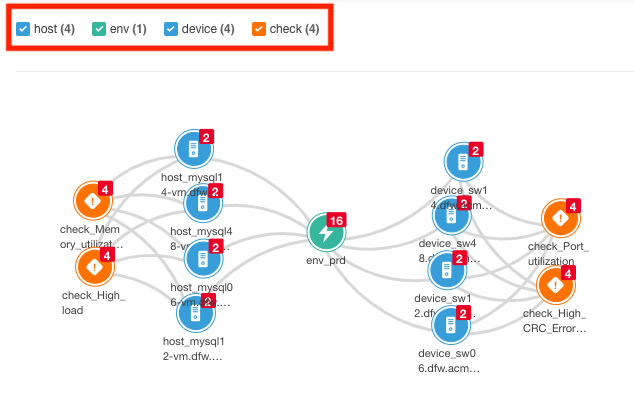
Topology Filters
The Changes Tab
Navigate the Changes Tab
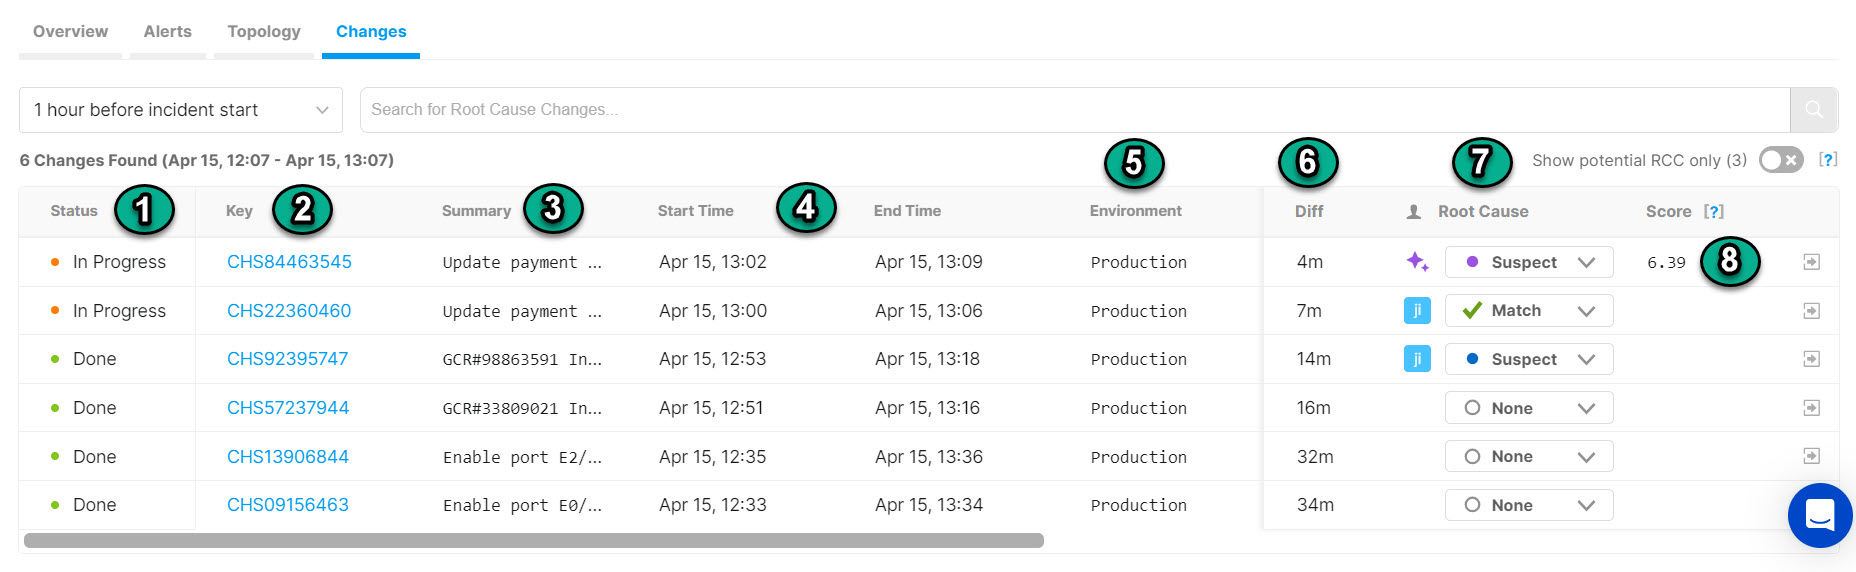
The Changes Tab
The change table contains columns that provide background information on the change.
Column | Description |
|---|---|
1 - Status | The status of the change. Possible change statuses are Planned, In Progress, and Done. Canceled changes persist in BigPanda but are not displayed in the change table. |
2 - Key | The key is the original ID from the integrated change. Click the hyperlinked change ID in the Key column of the table to view changes in the external change feed. |
3 - Summary | A short description of the change. |
4 - Start Time/End Time | Timestamps marking the duration of the change. |
5 - Change columns | Depending upon what data you send to BigPanda, additional change columns containing information such as Environment, Risk Impact, etc., appear in the table. |
6 - Diff | The difference between the change start time and the incident start time, in minutes. |
7 - Root Cause | You can manually mark a change as Suspect, Match, or None. Changes that were automatically marked as Suspect appear with a purple icon. |
8 - Score | The change causation score. A higher score indicates a more likely suspect. |
You are able to change the size and order of the columns within the change table. Hover over the space between column names to bring up the dividing line or the 6 dots.
To resize a column, click and drag the dividing line to the desired column width
To move a column, click and drag the 6 dots icon to the desired column placement
Show Potential RCC Only Toggle
Use the Show potential RCC only toggle to limit the change table to only show changes BigPanda has found highly correlated with the incident.
Click any one of the changes in the table to see a pop-up with the full list of tags and other data associated with the change.
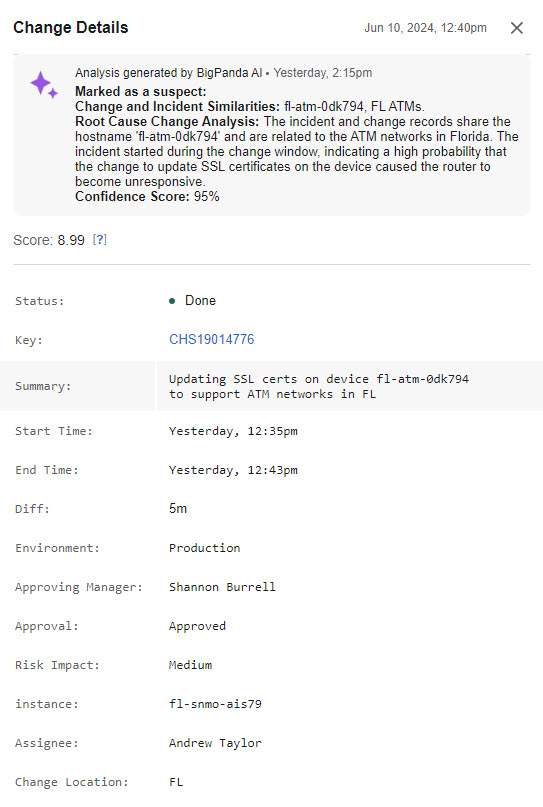
Change Details
Any environments configured with Automated Incident Analysis will automatically include an AI-generated explanation for why BigPanda marked a change as a potential root cause. This explanation provides more context and better insights into matches, saving you time as you hunt down the root cause of an incident.
Suspect changes
BigPanda will only mark changes as Suspect to give users the final say on whether or not the change is the incident's root cause.
The Historical Tab
Navigate the Historical Tab
By default, historical incidents are sorted by similarity score, with the most similar incidents first. See Similarity Calculation for how the score is calculated.
Number of similar incidents
The number of similar incidents found appears on the Historical tab, so you can see whether similar incidents are available before you open the tab.
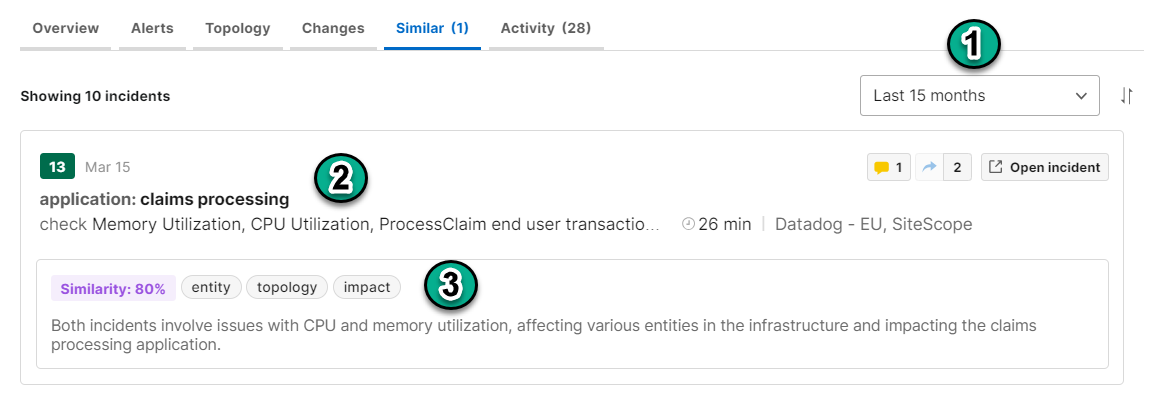
Field | Description | Related Links |
|---|---|---|
Type dropdown | Filter the list. Select All, Similar incidents, or ITSM tickets. | — |
Time-frame dropdown | Set the period that historical incidents are selected from: Last 30 days (default), Last 60 days, Last 90 days, or Custom date range... | |
Sort by | Sort the list by Score (default) or Last updated. | |
Incident details | Basic details about the historical incident, including the incident title, number of alerts, source, duration, comments, and shares. Click Open incident to open it. | |
Similarity score, matched categories, and summary | Below the incident details: the similarity score, the categories that matched, and a short summary of why the incident was considered similar. Click this area to open the Incident similarity window. |
The Activity Tab
Activity Log Filter
The activity log filter allows you to select specific event types to narrow the log, allowing you to find exactly what you need.
Filter Selection
Activity log filter selections are applied per user.
BigPanda will remember your activity log filter selection and apply it to all incidents until the filter has been cleared or a new selection is made.
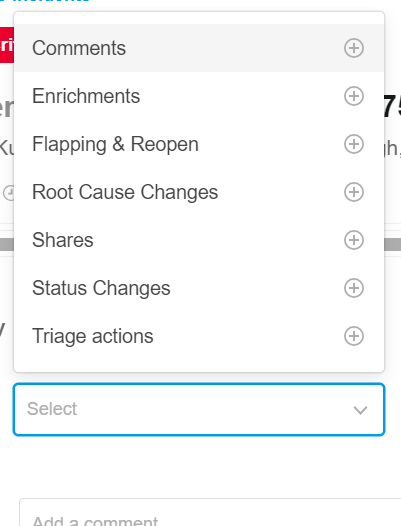
To filter the activity log, click the Recent Activity drop-down menu, and select one or more categories.
Activity Log Filter
Event Category | Event Types |
|---|---|
Comments | User commented on an incident |
Enrichment | AI update Manual or automatic tag update |
Flapping & Reopen | Incident entered flapping state Incident reopened |
RCC | Change was marked as suspect |
Shares | Incident was AutoShared Incident was manually shared |
Status Changes | Alert payload-driven changes Incident was manually resolved Incident entered maintenance |
Triage Actions | Priority was assigned or changed Incident was assigned Incident was snoozed Incident was merged with another incident Incident was split |