Manage AI Incident Assistant Dashboards
Improve incident management workflows by creating reports and summaries of incidents as they occur. View and customize these reports in the Web App within the Dashboards section.
The following dashboards are available:
Incident Post-Mortems - View all incident post-mortems and reports that were generated by AI Incident Assistant using the Generate Incident Report or Managed Incident Channel action plans.
Large Context Analysis - Dig deeper into issues in your environments. This dashboard is only available if your organization has the AI Incident Prevention module.
Multi-Context Generation - Create dynamic reports that reference multiple content source types.
Change Risk - View all change requests and their associated risk. This dashboard is only available if your organization has the AI Incident Prevention module.
Transcripts - View and manage transcripts from calls that were recorded using AI Incident Assistant's Transcribe a Call feature.
MIM Executions - Automate and accelerate your incident management processes with Major Incident Management (MIM) workflows.
Key Features
View summaries and reports generated by AI Incident Assistant.
Modify incident reports to fit the needs of your organization's workflows.
See a list of your organization's changes, and the predicted risk associated with them.
Incident Post-Mortems
In the Incident Post-Mortems module, you can view all incident reports that were generated by AI Incident Assistant using the Generate Incident Report or Managed Incident Channel action plans.
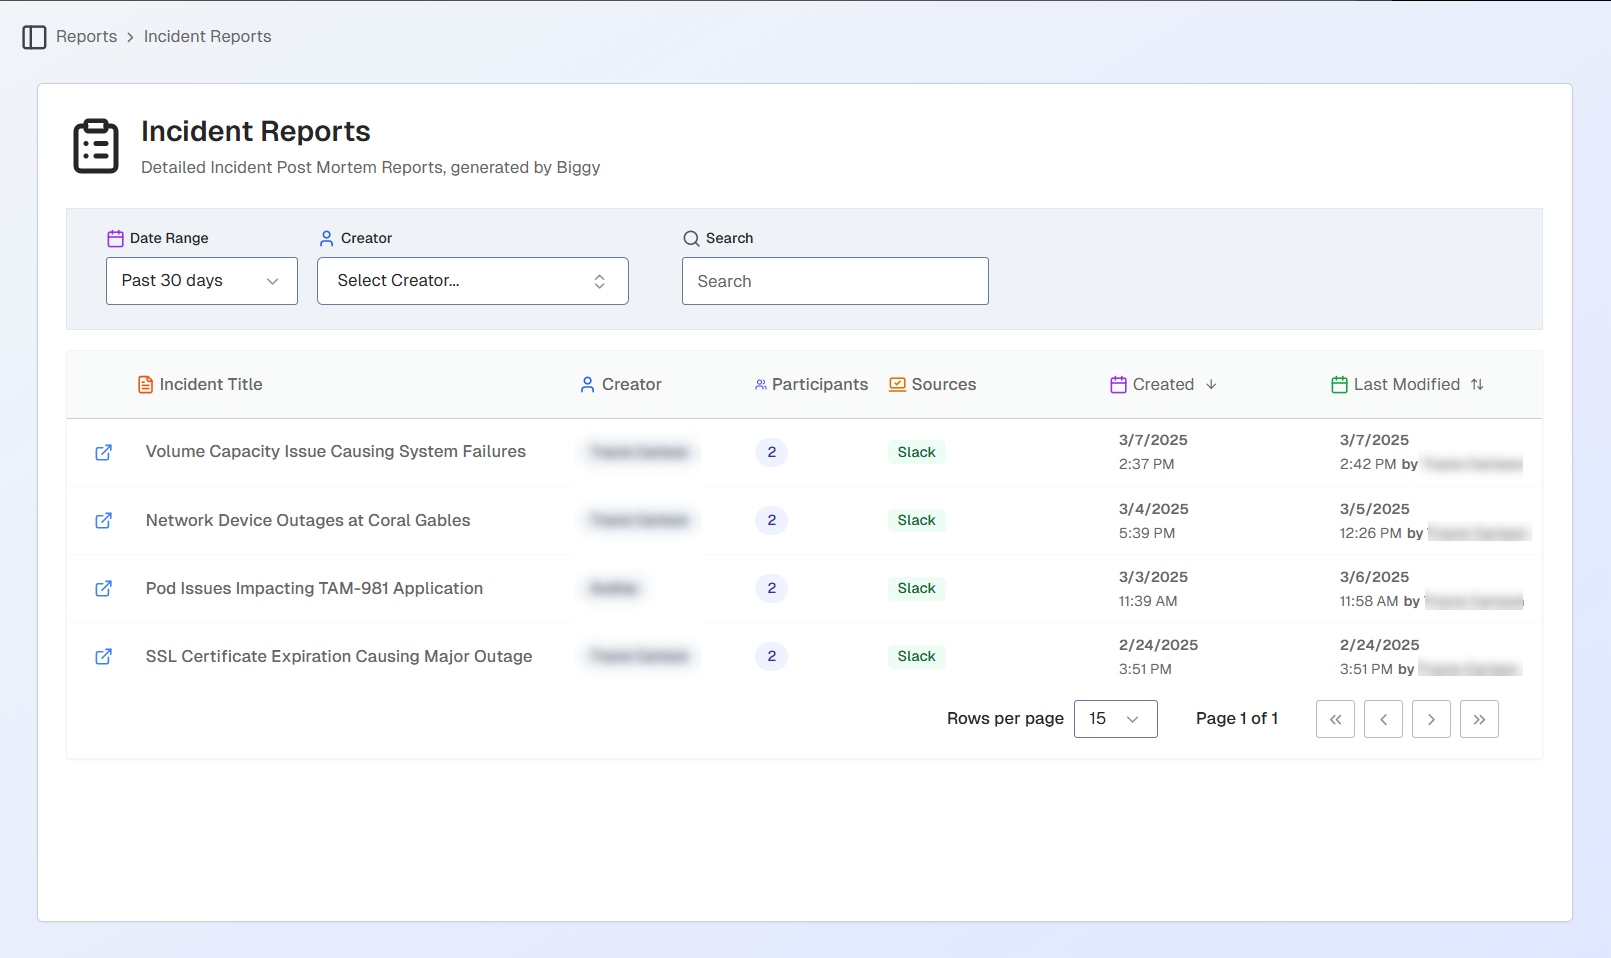
Incident Post-Mortems List
By default, all reports from the last 30 days appear on the page. You can filter the list by a different date or by the incident creator. The list of the reports can be sorted by Created date, or Last modified date.
To find a specific incident report, use the Search bar.
Manage Incident Post-Mortems
Click any post-mortem in the list to open the details screen.
Incident Post-Mortem
Incident post-mortems can be exported as PDF or HTML files by clicking either the Download PDF or Download HTML buttons.
The name of the incident and the time and date it occurred appear at the top. You can click the pencil icon to the right of the title to edit it.
The incident post-mortem is divided into five sections: Summary, Timeline, Action Items, Participants, and Event Log.
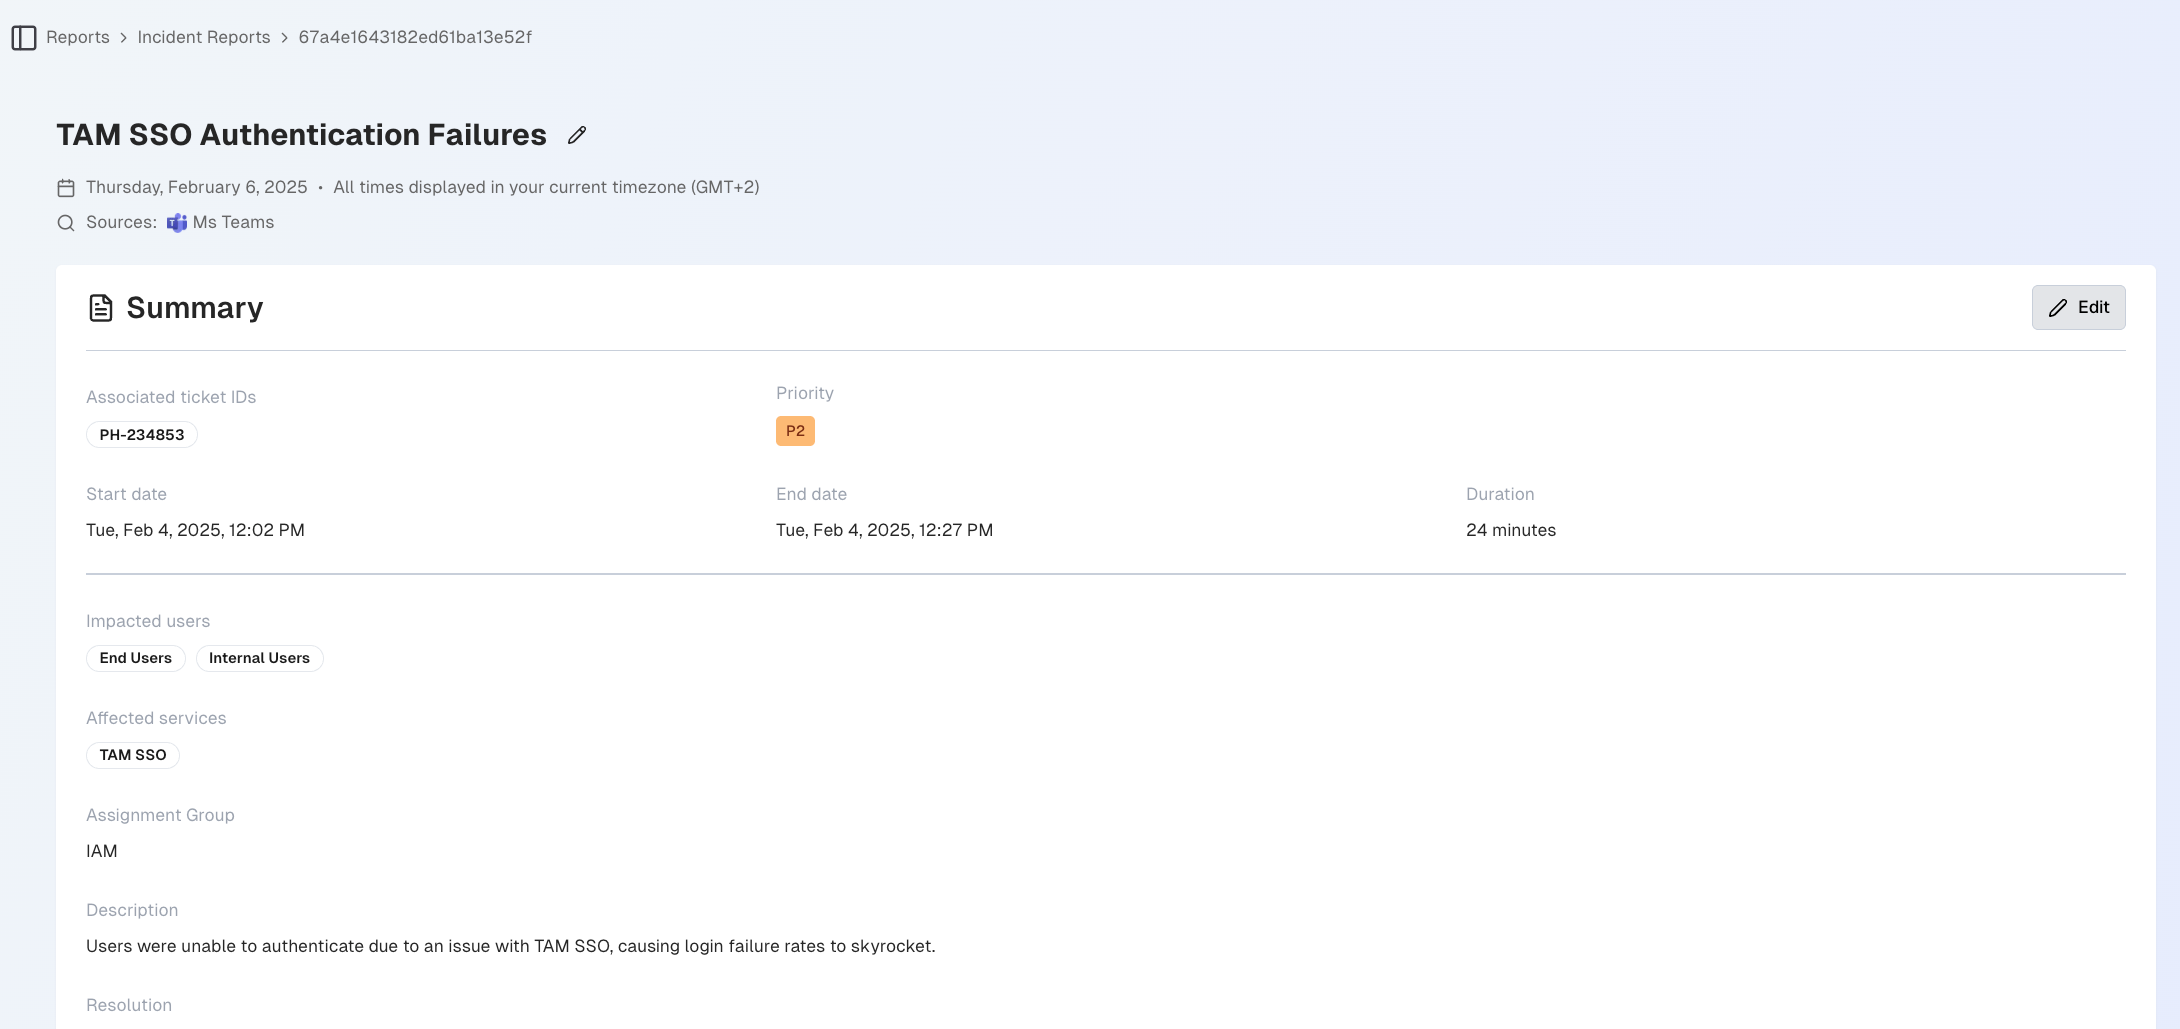
Summary
The Summary section provides all of the high-level details of the incident. You can modify any of the summary fields by clicking the Edit button.
Field | Description |
|---|---|
Associated ticket IDs | The ID(s) of the ticket(s) associated with the incident. |
Priority | The priority of the incident. |
Start date | The date the incident started. |
End date | The date the incident ended. |
Duration | The amount of time that the incident lated. |
Impacted users | The groups of users who were impacted by the incident. |
Affected services | The services impacted by the incident. |
Assignment group | The name of the assignment group assigned to handle the incident. |
Description | The incident description generated by AI Incident Assistant. |
Resolution | The summary of the resolution steps taken to resolve the incident, generated by AI Incident Assistant. |
Follow-up | The recommended post-incident follow-up steps. |
Timeline
The Timeline section displays all major events related to the incident in chronological order. Within the timeline, you can also see the incident duration and the time it took to detect, assign, diagnose, recover, and resolve.
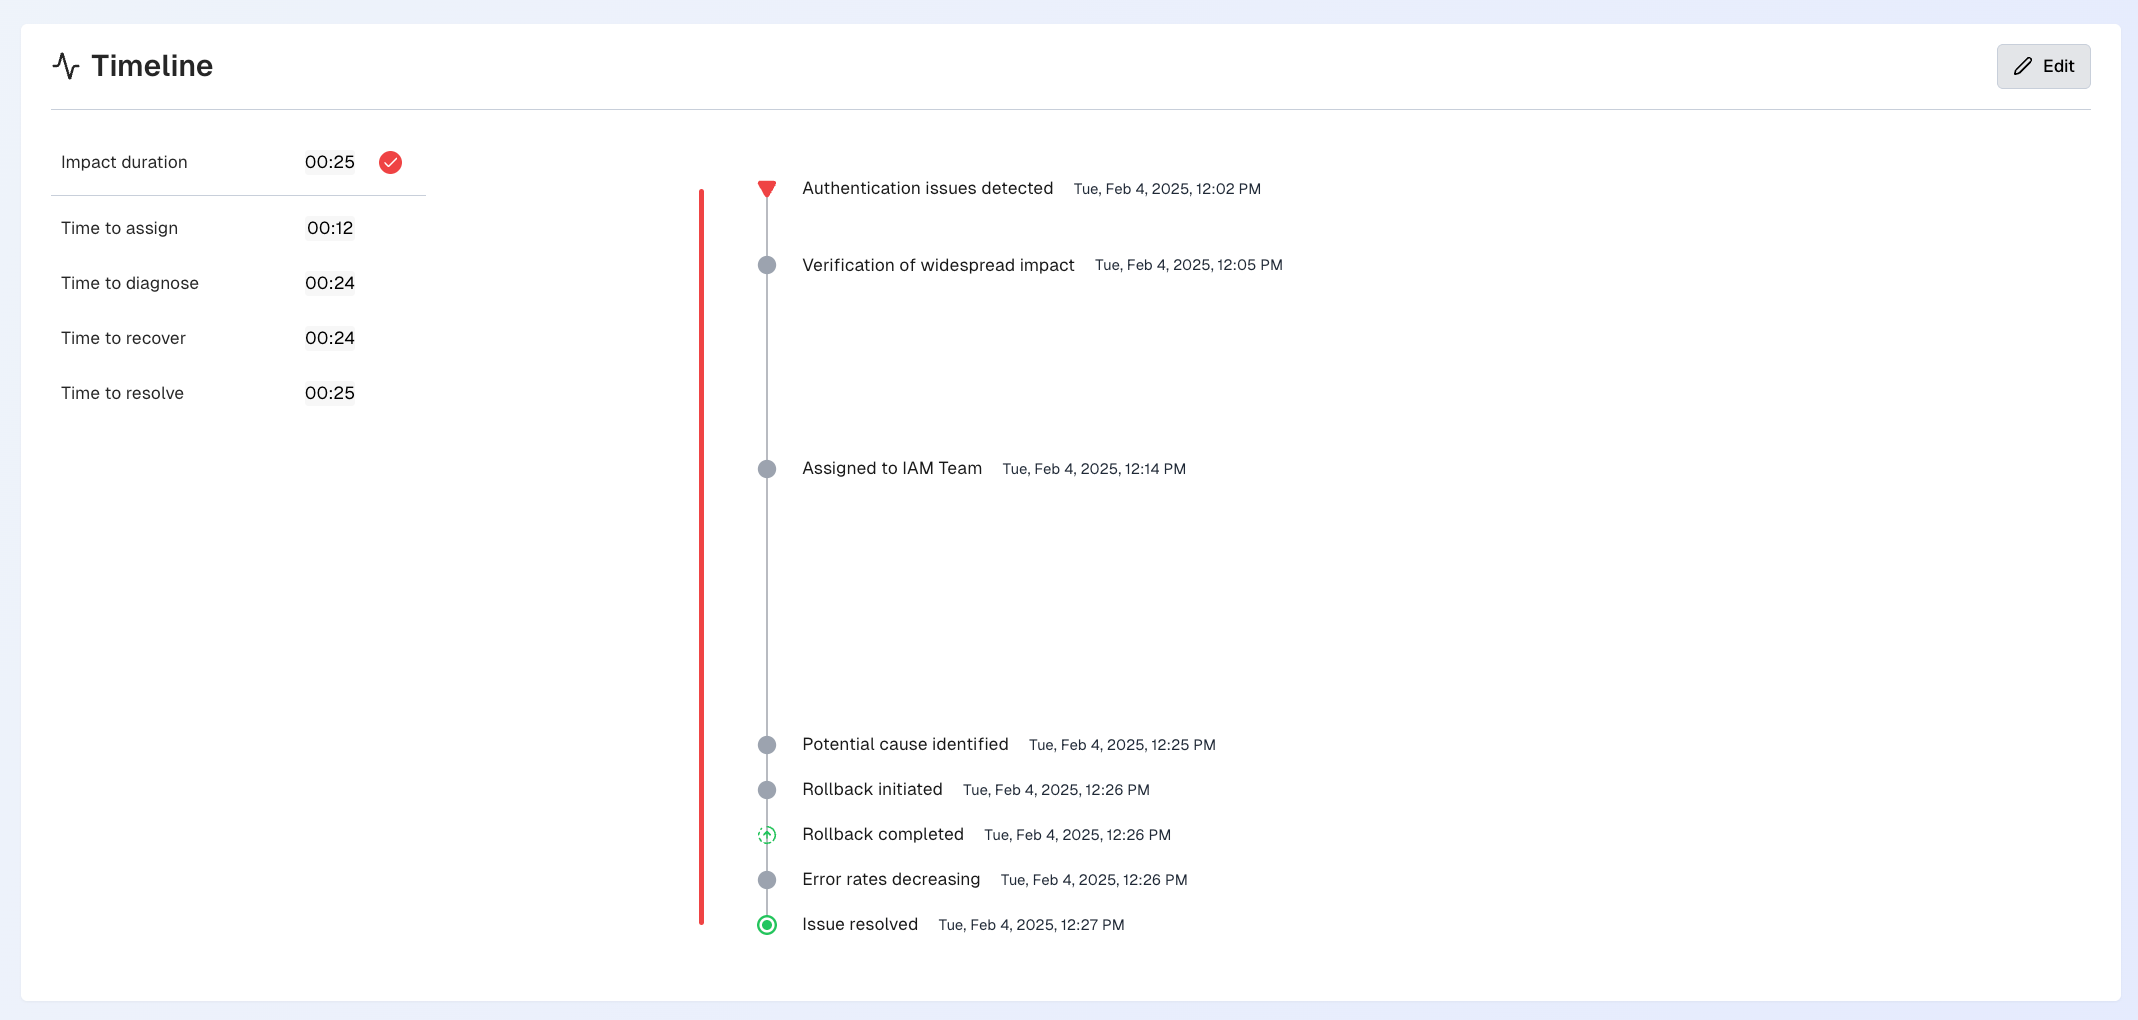
Incident Report Timeline
Click the Edit button to edit, add, or delete events in the timeline.
Each event in the timeline displays the following information:
Field | Description |
|---|---|
Type | The type of event that occurred. The following event type options are available:
|
Source | The system where the event occurred. |
Date | The date and time when the event occurred. |
Title | The title is a short summary of the event. The event title appears in the timeline at a glance. |
Description | A detailed description of the event. |
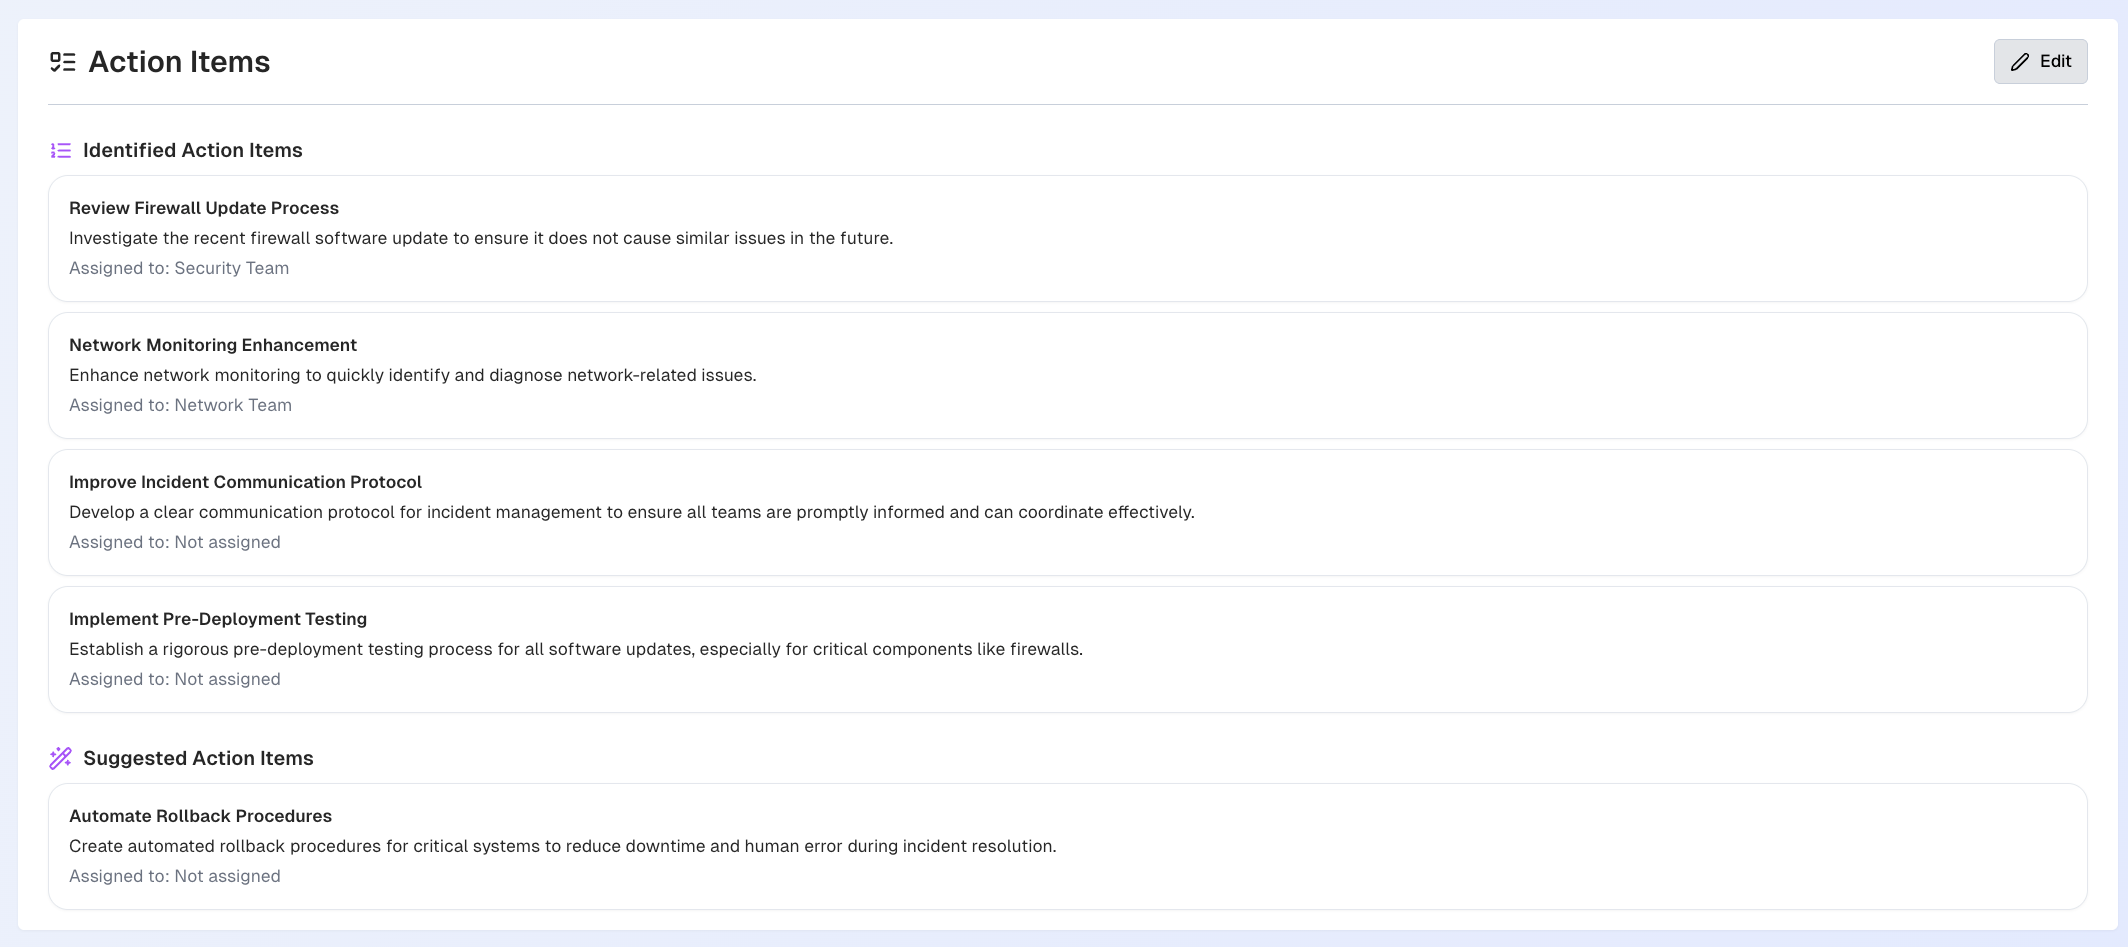
Follow-up Action Items
The Follow-up Action Items section displays recommended actions based on the incident details.
Follow up items
Follow up items from incident channels become the action items listed in this section.
Incident Report Action Items
Identified Follow-up Action Items are the action items that were identified by a participant within the channel.
Suggested Follow-up Action Items are action items that were recommended by AI Incident Assistant.
Click Edit to edit, add, or delete action items.
Click the Arrow icon next to any action item to send it to an external system such as email, Slack, MS Teams, or ServiceNow.
Participants
The Participants section displays all users who were part of the incident channel.
Click the arrow on the right side of the participant row to view additional information. Details appear for each participant:
Title
Phone number
Email
Timezone
Contributions
Participants may be given a badge depending upon their level of contributions to resolving the incident. The following badges are available:
Helpful AIOps Copilot - automatically given to AI Incident Assistant.
Top Contributor - awarded to individuals whose actions, expertise, and coordination efforts were instrumental in managing the incident's impact and recovery.
Key Contributor - awarded to those who significantly contributed to handling the incident as a key supporting part of the team.
Click Open in Slack to open the user's Slack profile.
Event Log
The Event Log is a comprehensive list of all activities that took place in the incident channel. You can click any event in the log to open the conversation in Slack.
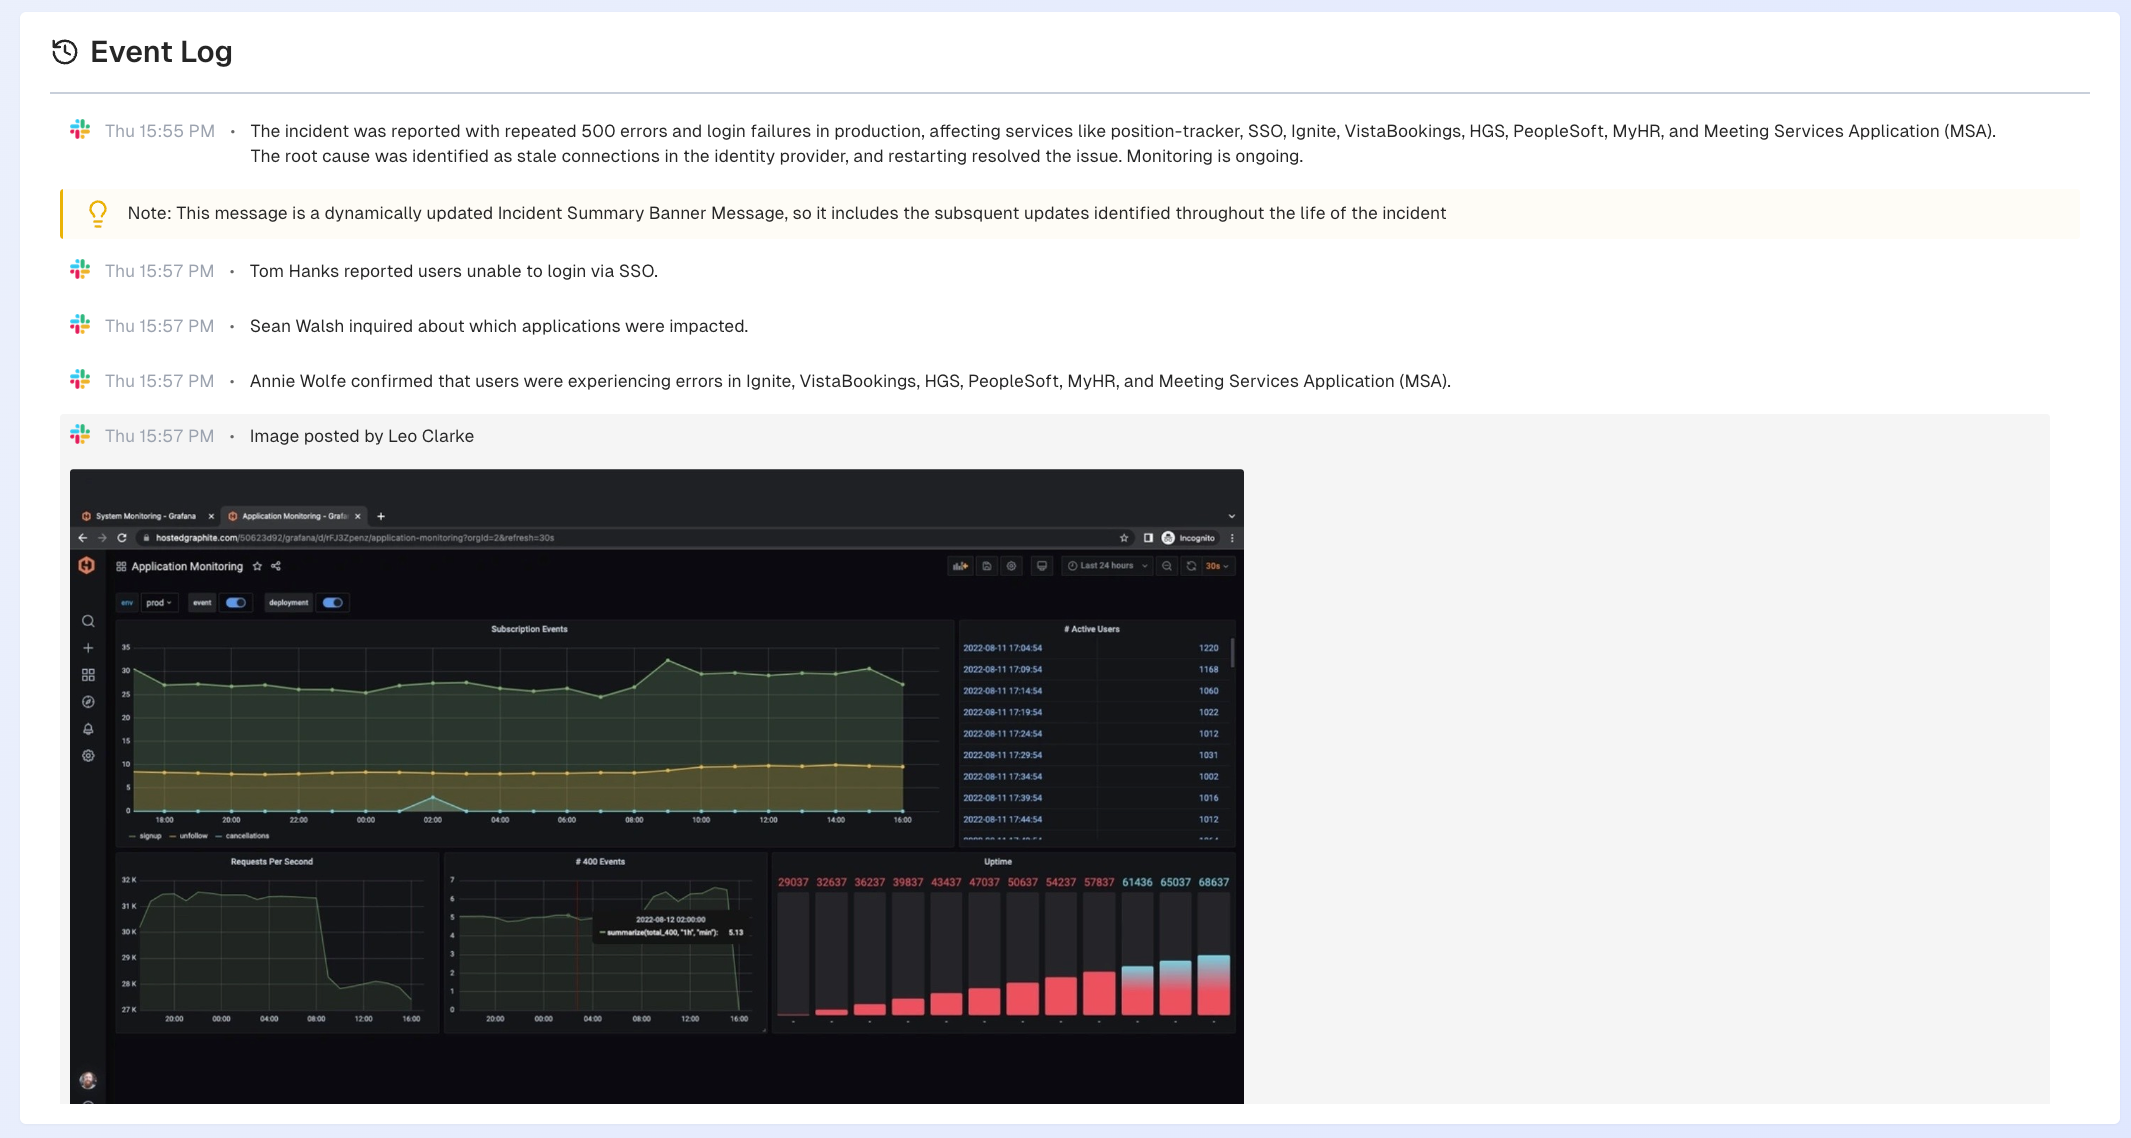
Incident Report Event Log
Large Context Analysis
The Large Context Analysis dashboard is only available if your organization has the AI Incident Prevention module. See the Large Context Analysis documentation for more information.
If you're interested in purchasing the AI Incident Prevention module, contact your BigPanda account team.
Multi-Context Generation
The Multi-Context Generation dashboard allows you to combine call transcripts, ITSM records, and chat messages into a single, high-quality artifact. Use this page to create dynamic reports that reference multiple source types.
Multi-Context Generation can be accessed within the AI Incident Assistant web app at Dashboards > Multi-Context Generation.
Create a Multi-Context Report
Multi-context reports require context and instructions on what content to include and generate for the report.
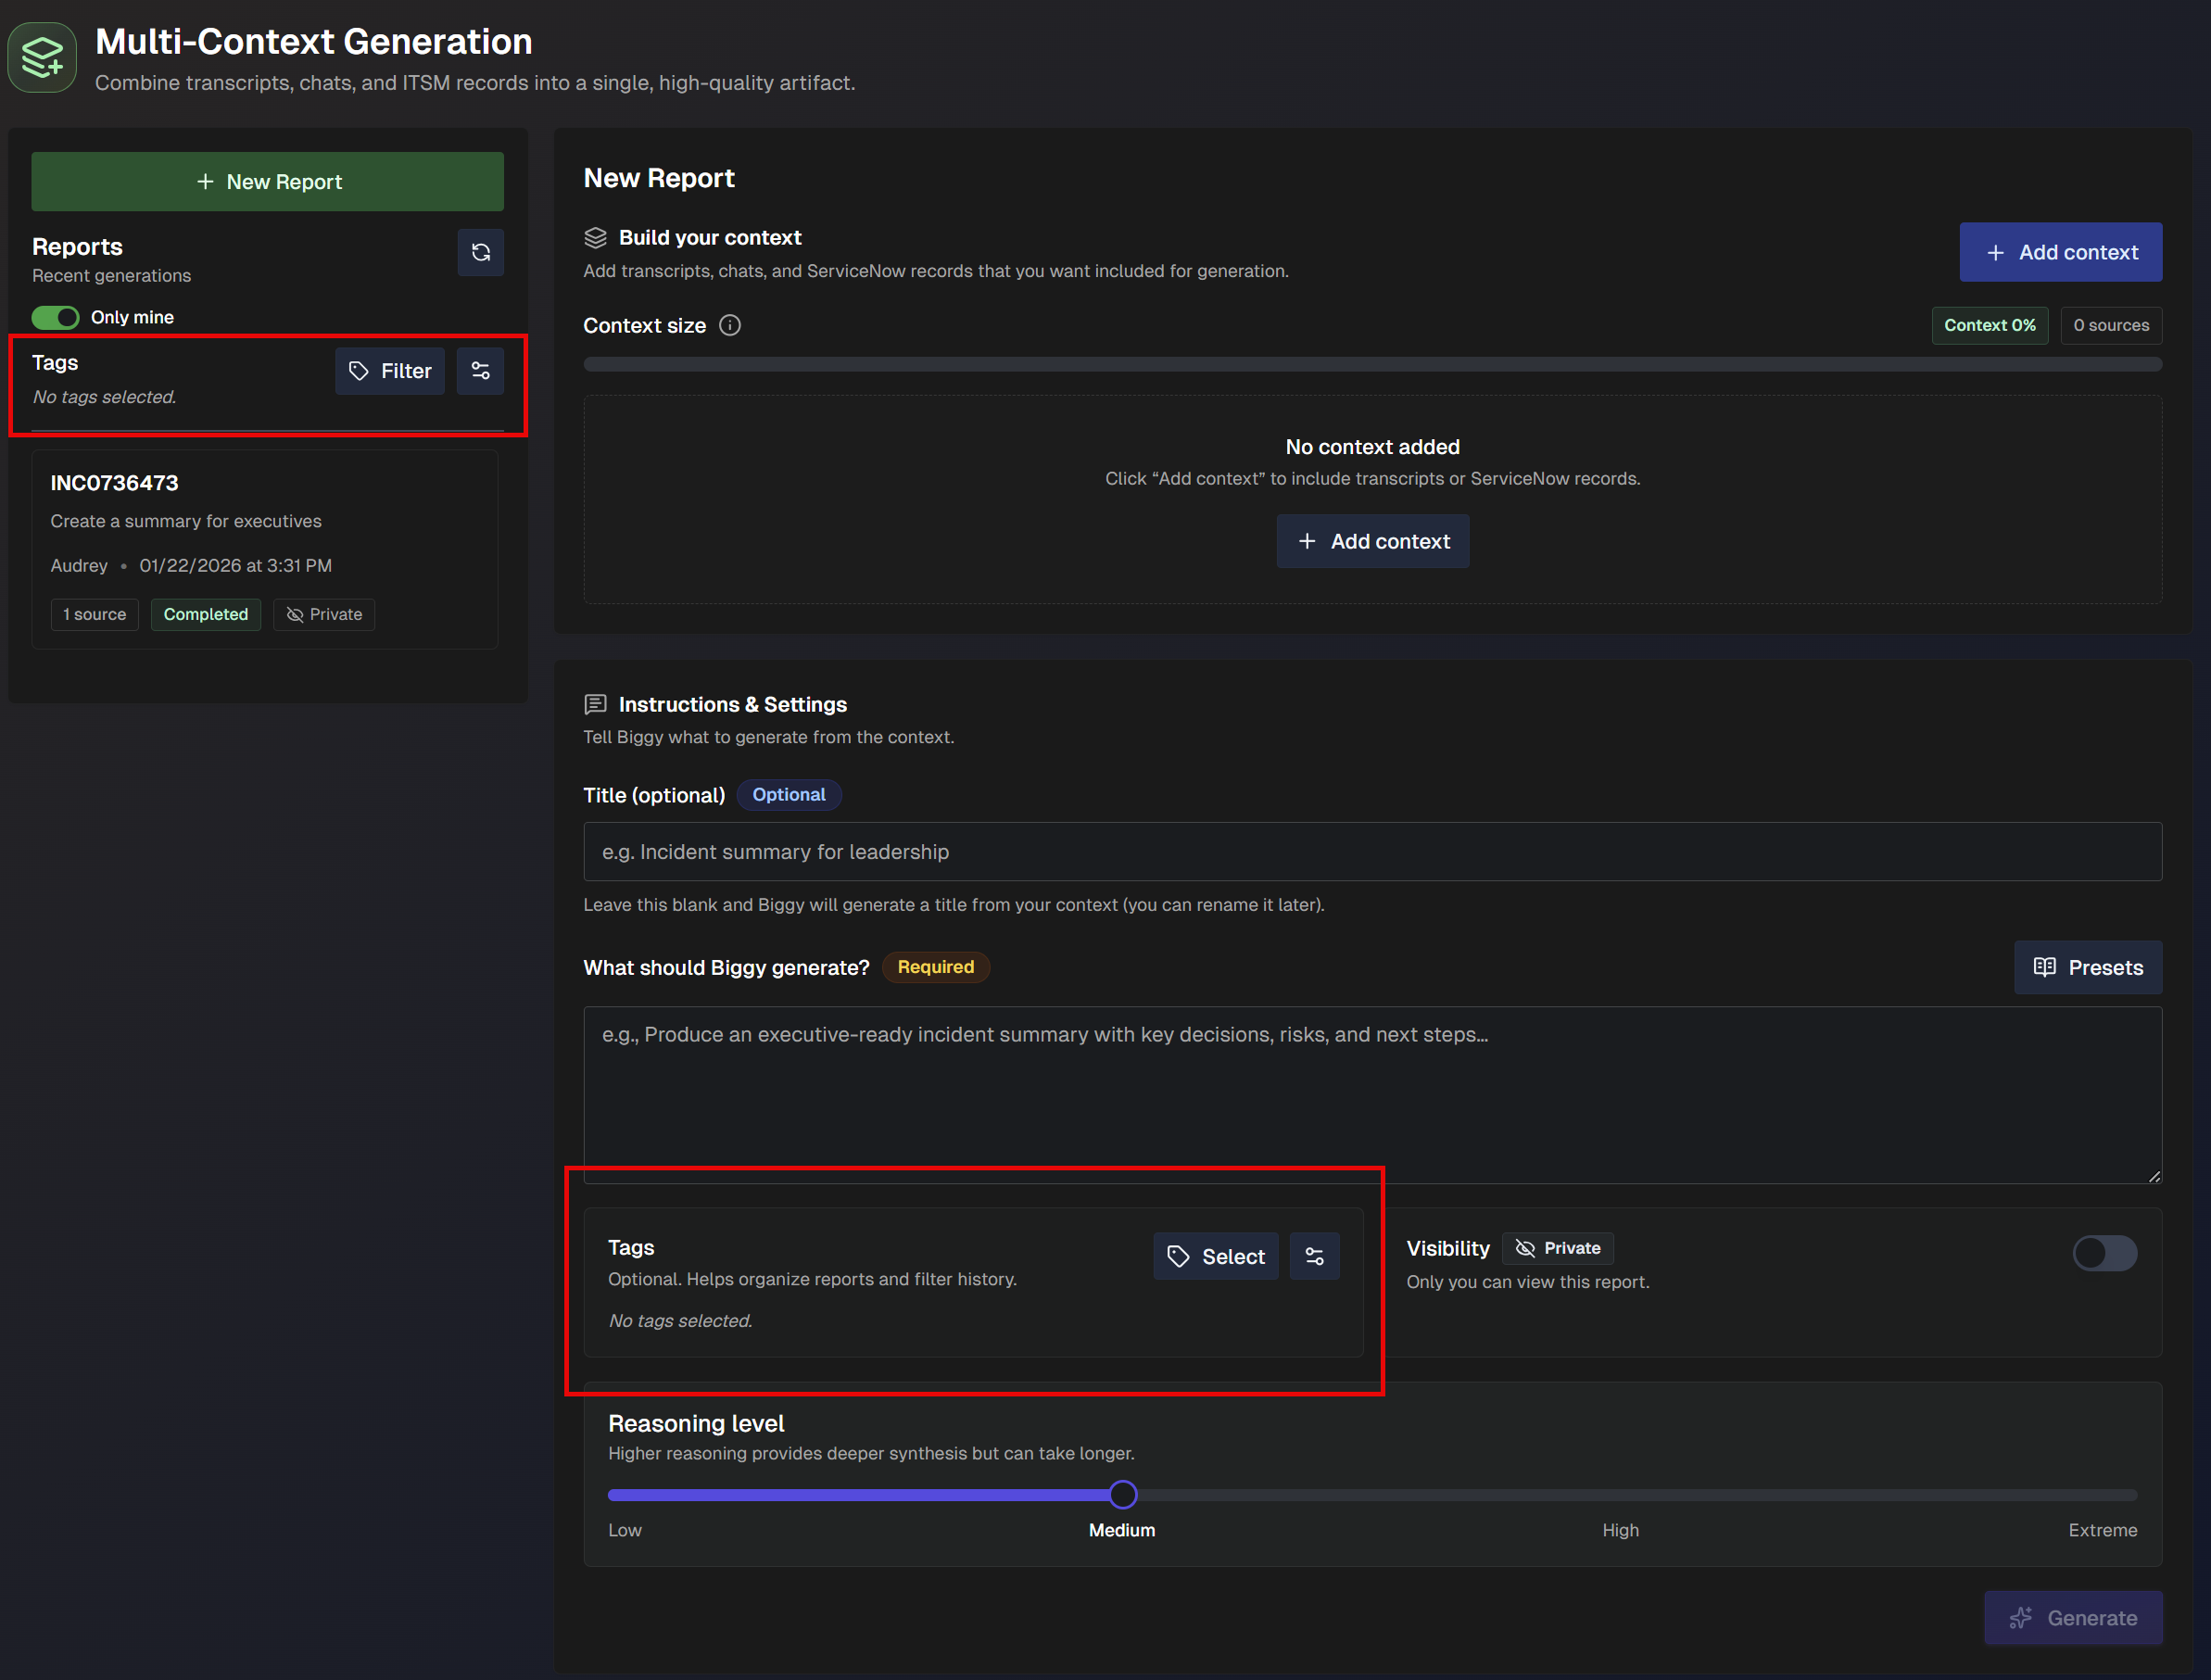
To create a report, go to the Multi-Context Generation page and click + New Report.
The report creation screen contains two sections: Build Your Context and Instructions & Settings.
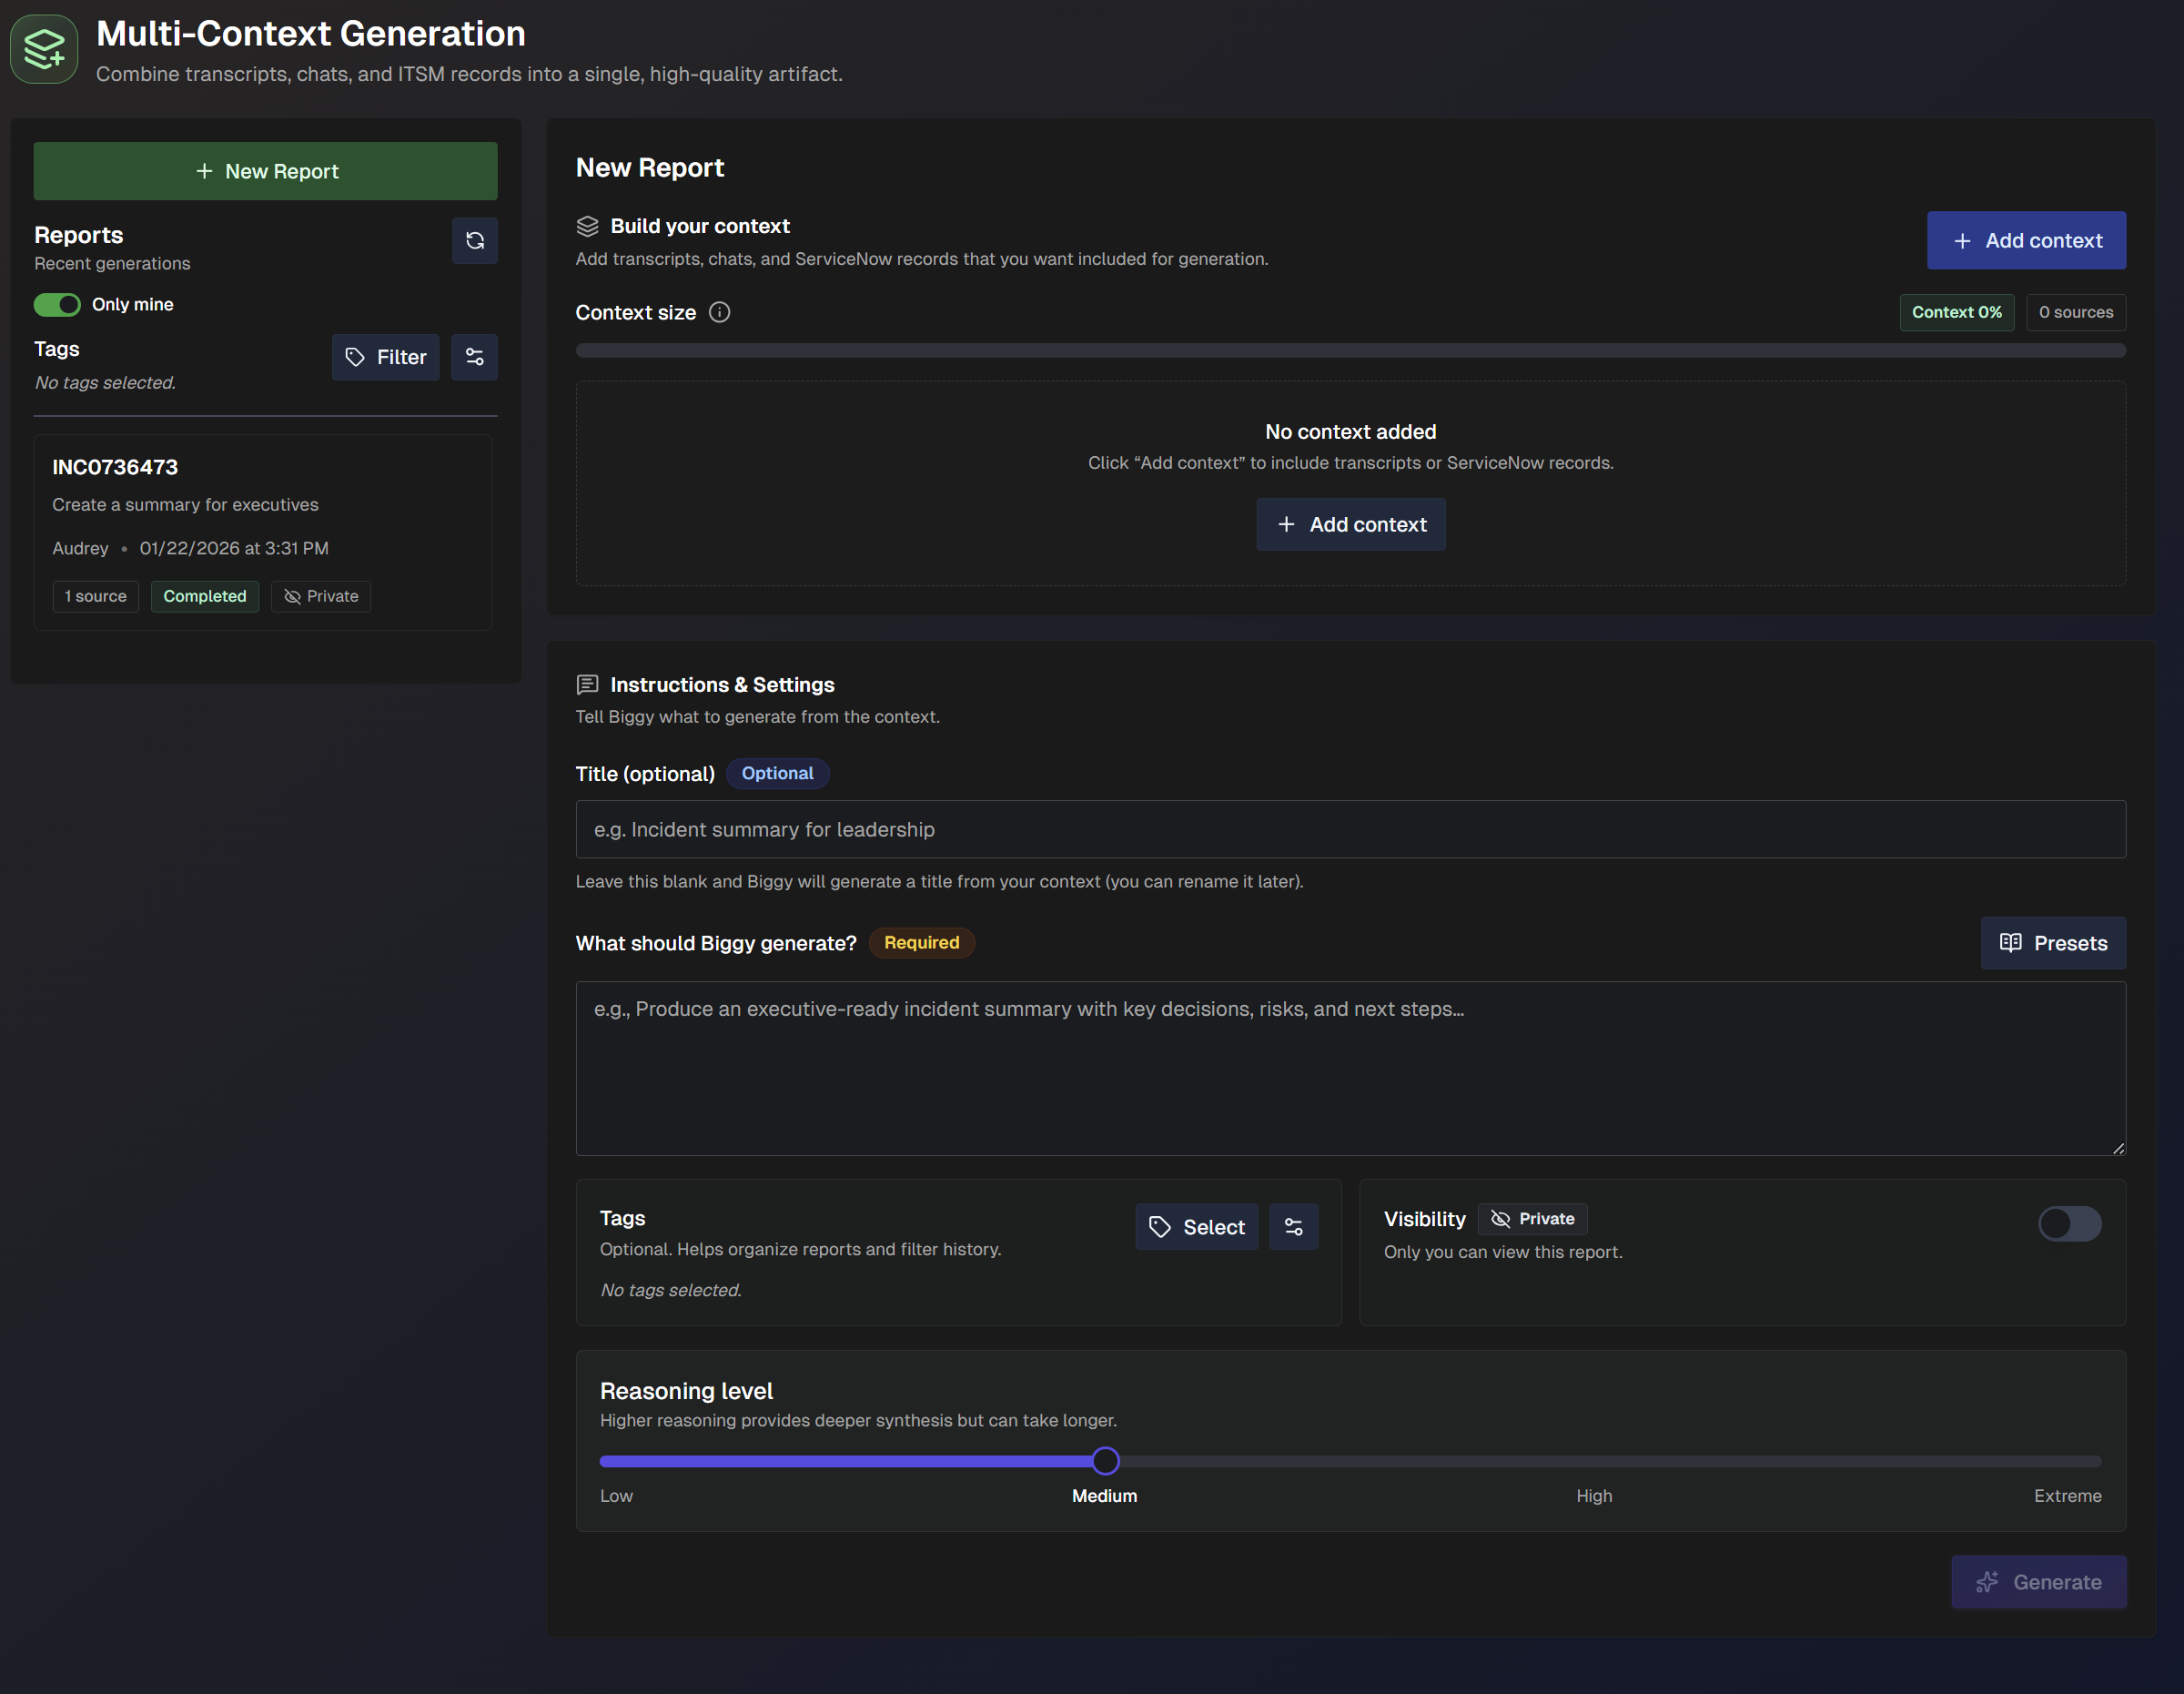
Build Your Context
In the Build Your Context section, add call transcripts, ServiceNow records, or chat messages you want included in the report generation. Click + Add Context to add sources for the report.
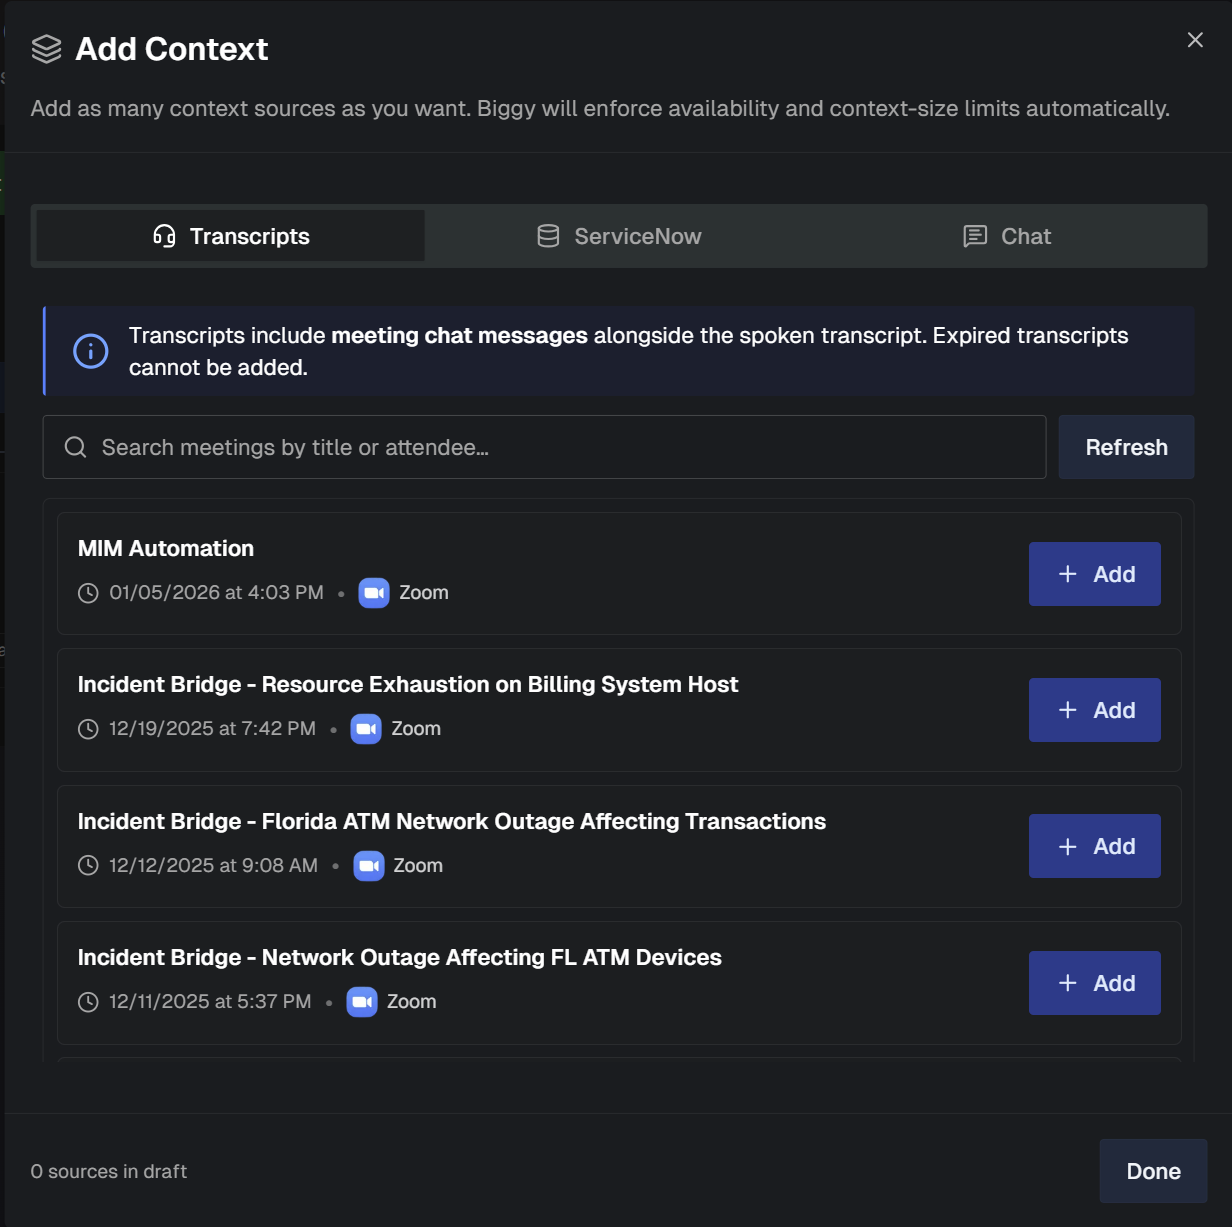
In the Add Context screen, choose if you'd like to add sources from Transcripts, ServiceNow, or Chat.
If you selected Transcripts, choose a call transcript from the list and click + Add to add it as a source. To find a specific transcript from the list, use the Search bar.
Transcript selection
Transcripts include meeting chat messages alongside the spoken transcript. Expired transcripts cannot be added.
For information about updating the meeting transcript retention period, see the Context and Data documentation.
If you selected ServiceNow, enter a Record Number and optionally select a Table from the drop-down menu.
ServiceNow records
You can add multiple ServiceNow records from either the same or different tables.
Click Preview to view a short description of the record. If the record is correct, click + Add to add it to the report.
If you selected Chat, choose a chat channel from the drop-down menu. Use the date and time filters to narrow the chats to a specific time period.
Time zone
Date and time filters use your local time zone.
Click Preview to view a preview of messages from the selected time period. Click + Add to add the messages to the report.
Once you have finished selecting sources, click Done.
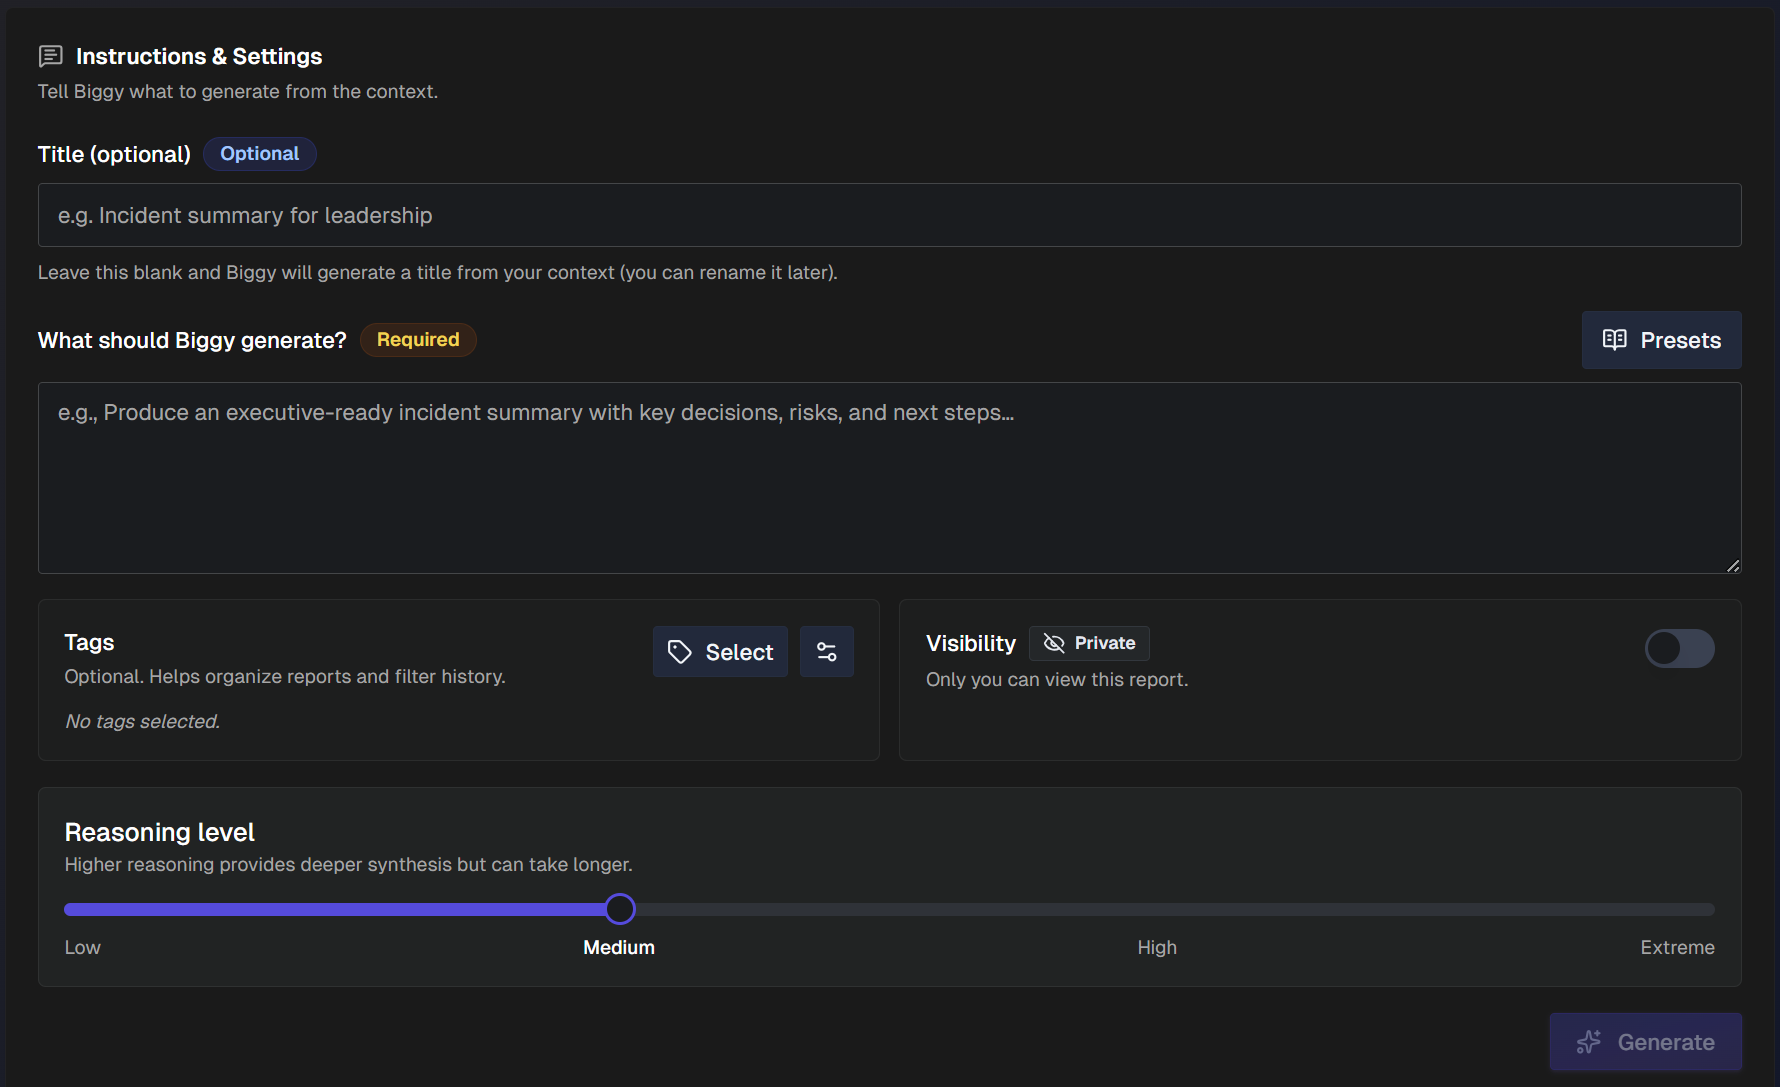
Instructions & Settings
In the Instructions & Settings section, tell AI Incident Assistant what you'd like it to generate from the selected context sources.
Populate the following fields in this section:
Field | Description |
|---|---|
Title (Optional) | Enter a title for the report. Leave this field blank and AI Incident Assistant will generate a title based on the content you selected. The title can be edited after the report is generated. |
What should Biggy generate? | Enter instructions for what AI Incident Assistant should generate from the context. If you use a specific report type often, you can create presets for later use. To create a preset, click Presets > Create Preset. Give the preset a descriptive Name, and select whether you would like it to be Public (visible to everyone in your organization) or Private (visible only to you). Enter your Preset Prompt and click Save Preset. |
Tags (Optional) | Optionally add tags to organize or filter the report list. See Manage Report Tags for more information. |
Visibility | Toggle on to make the report visible to everyone in your organization. Toggle off to make the report only visible to you. |
Reasoning Level | Select the level of reasoning that should be used to generate the report. Higher reasoning levels provide a more thorough analysis, but take longer to generate. |
After editing instructions and settings, click Generate to create the report.
View a Multi-Context Report
Select a multi-context report from the list to view report details in the right pane.
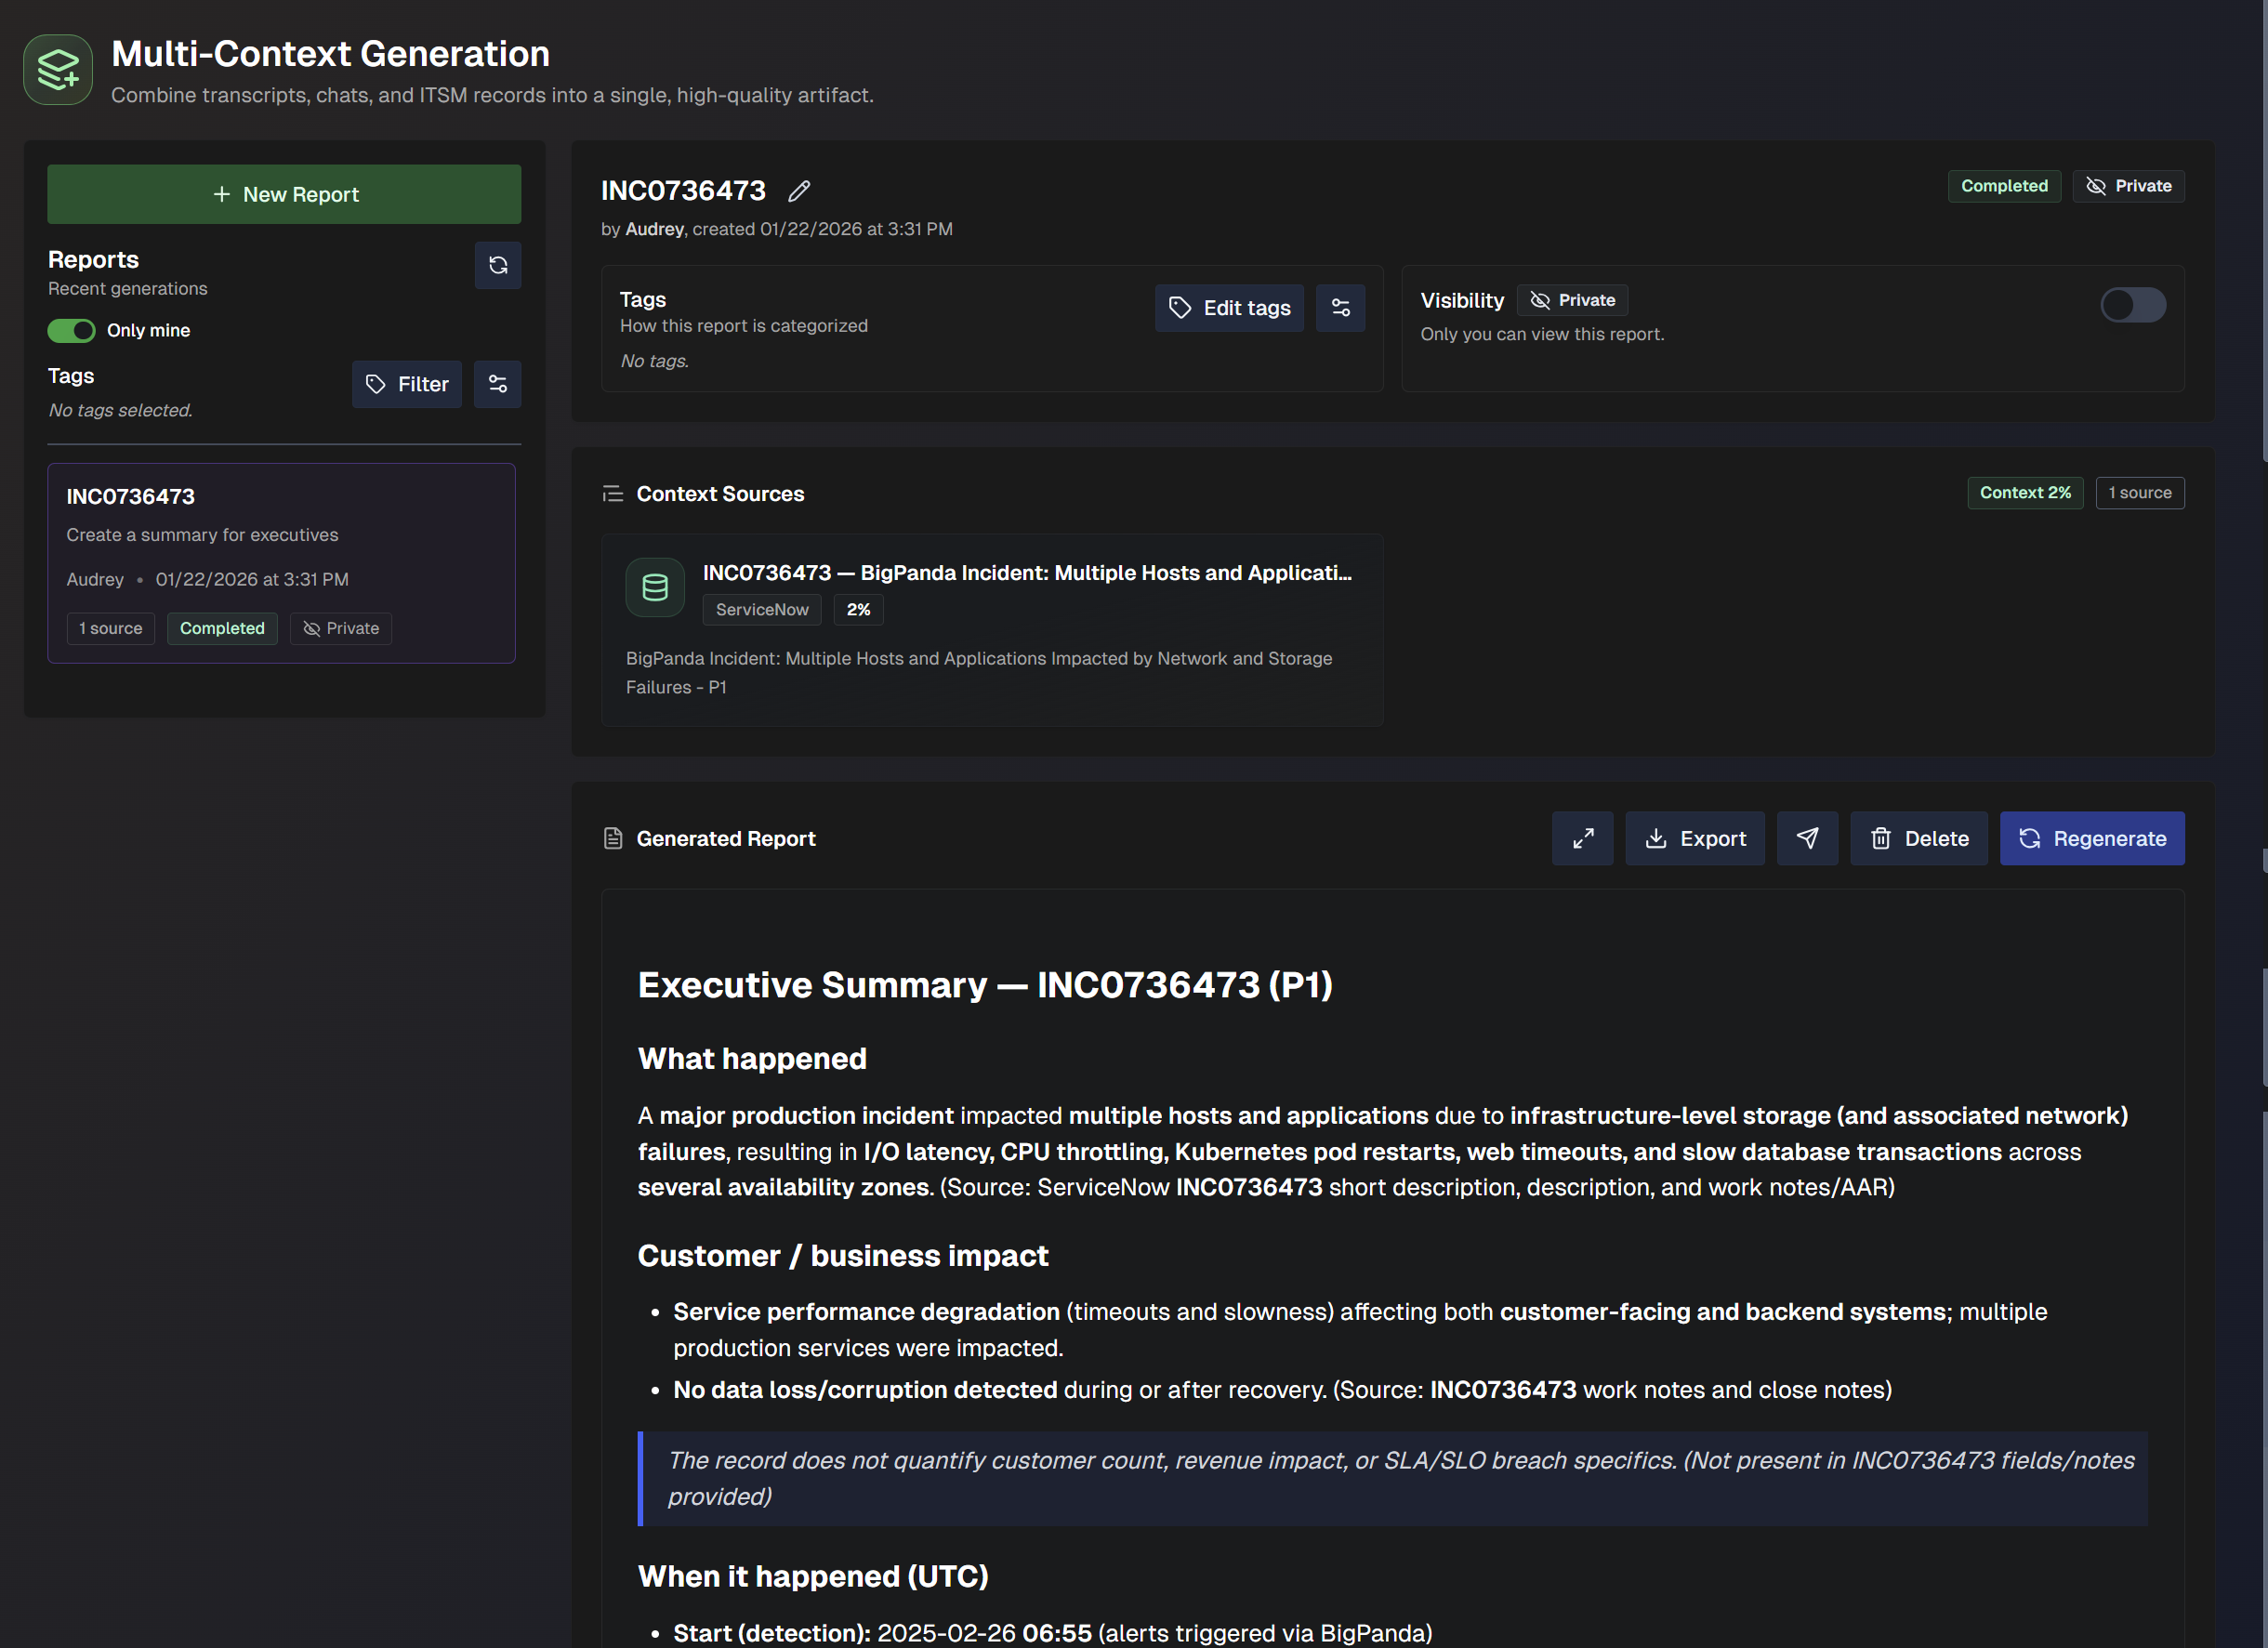
At the top of the report, basic information about the report is displayed. The following information is available:
Report title
Name of the person who generated the report
Date the report was generated
Report tags
Report visibility
The report title, report tags, and report visibility can be edited.
The Context Sources section lists the sources used to generate the report.
The Generated Report section displays the body of the report. Use the buttons at the top of this section to take action on the report. The following options are available:
Expand - view a full page version of the report.
Copy - copy the report as Markdown, Plaintext, or for Google Docs.
Download - download the report as a PDF, .docx, .txt, or .md file.
Export - send the report externally as an email, Slack or Teams message, or ServiceNow work note or comment.
Delete - permanently delete the report.
Regenerate - provide feedback and additional instructions for correcting the report, and regenerate it.
Manage Multi-Context Reports
The list of generated reports appears on the left side of the Multi-Context Generation page.
Click the Filter button to search for reports with specific tags. View only your reports by toggling the Only Mine option.
Click the Refresh button to refresh the list of reports.
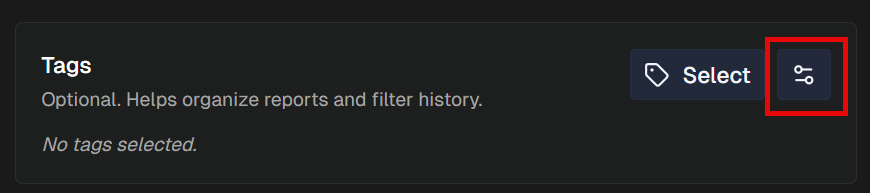
Manage Multi-Context Report Tags
You can optionally add tags to reports to filter the multi-context report list. Tags can be managed from the report list, or the Instructions & Settings section of the report creation screen.
To create or edit a tag, click the Settings icon. This opens the Manage Report Tags panel.
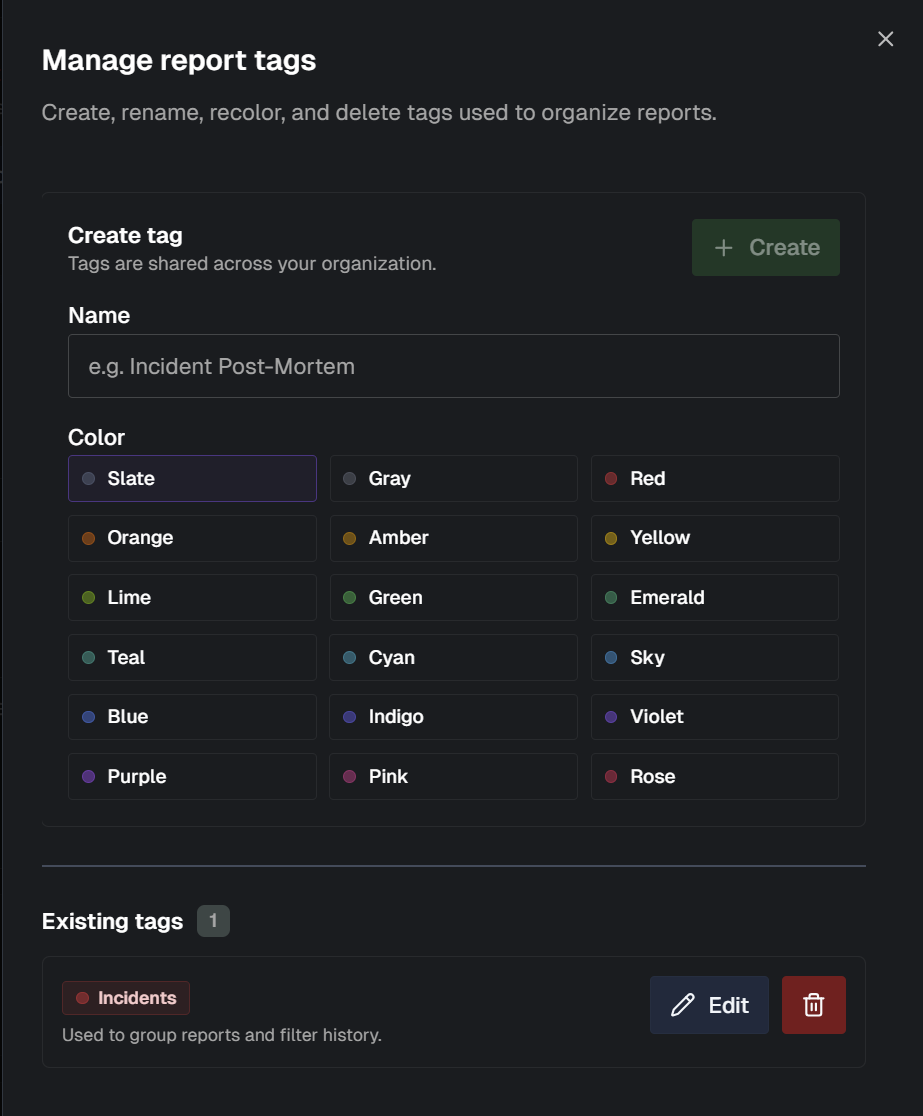
To create a tag, enter a Name for the tag, and select a Color to represent it. Click + Create.
To edit a tag, find it in the list of tags and click the Edit icon. Make changes to the Name or Color and click Save.
To delete a tag, find it in the list of Existing Tags and click the Trash can icon.
Change Risk
The Change Risk dashboard is only available if your organization has the AI Incident Prevention module. See the Change Risk documentation for more information.
If you're interested in purchasing the AI Incident Prevention module, contact your BigPanda account team.
Transcripts
In the Transcripts dashboard, view and manage transcripts from calls that were recorded using AI Incident Assistant's Transcribe a Call feature.
Transcript retention
Transcript content for meetings is only available until the retention period expires.
The default retention period is 7 days. If you'd like to update your organization's retention period, contact your BigPanda account team.
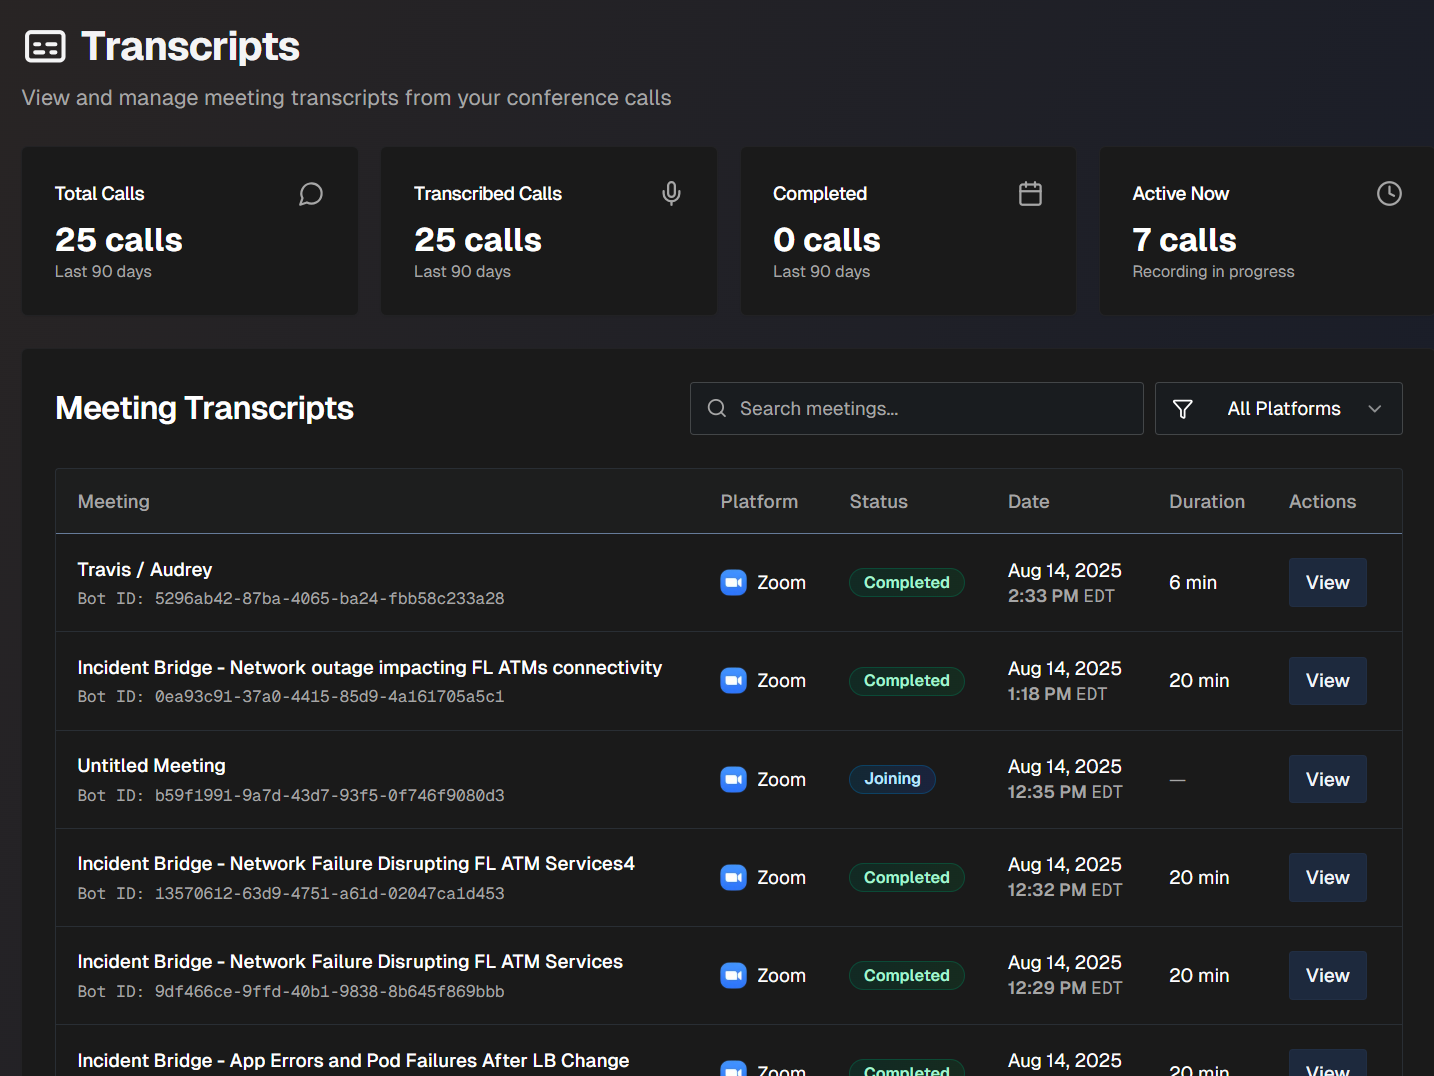
The top of the Transcripts dashboard displays statistics about recorded calls. The following information is available:
Total calls - all calls that AI Incident Assistant transcribed, and all calls that AI Incident Assistant started as part of a managed incident channel (even if the call was not transcribed)
Total transcribed calls - all calls that AI Incident Assistant transcribed
Total completed calls - number of calls that were completed
Total active calls currently in progress - number of calls that are active, but have not been completed yet.
To find a specific transcript, use the Search Meetings box, or use the Filter to narrow the list by individual platforms.
The following information about each transcript appears on the dashboard:
Field | Description |
|---|---|
Meeting | Descriptive name of the meeting and the unique bot session ID associated with it. |
Platform | The name of the conferencing platform that was used to host the meeting. |
Status | Whether the call has been completed. |
Date | The date and time that the call started. |
Duration | How long (in minutes) the call lasted. |
If a transcript is no longer needed or was mistakenly recorded, click the Trash Can icon to delete it from the dashboard.
Deleted transcript indexing
If your organization has indexing enabled for transcripts, the summarized deleted transcript will still be part of your organization's long-term knowledge. See the Indexing Settings documentation for more information.
Transcript Multi-Select Mode
Use the Multi-Select mode to generate content based on multiple transcripts. Simplify review by combining summaries for situations where multiple calls were needed for a single incident or issue.
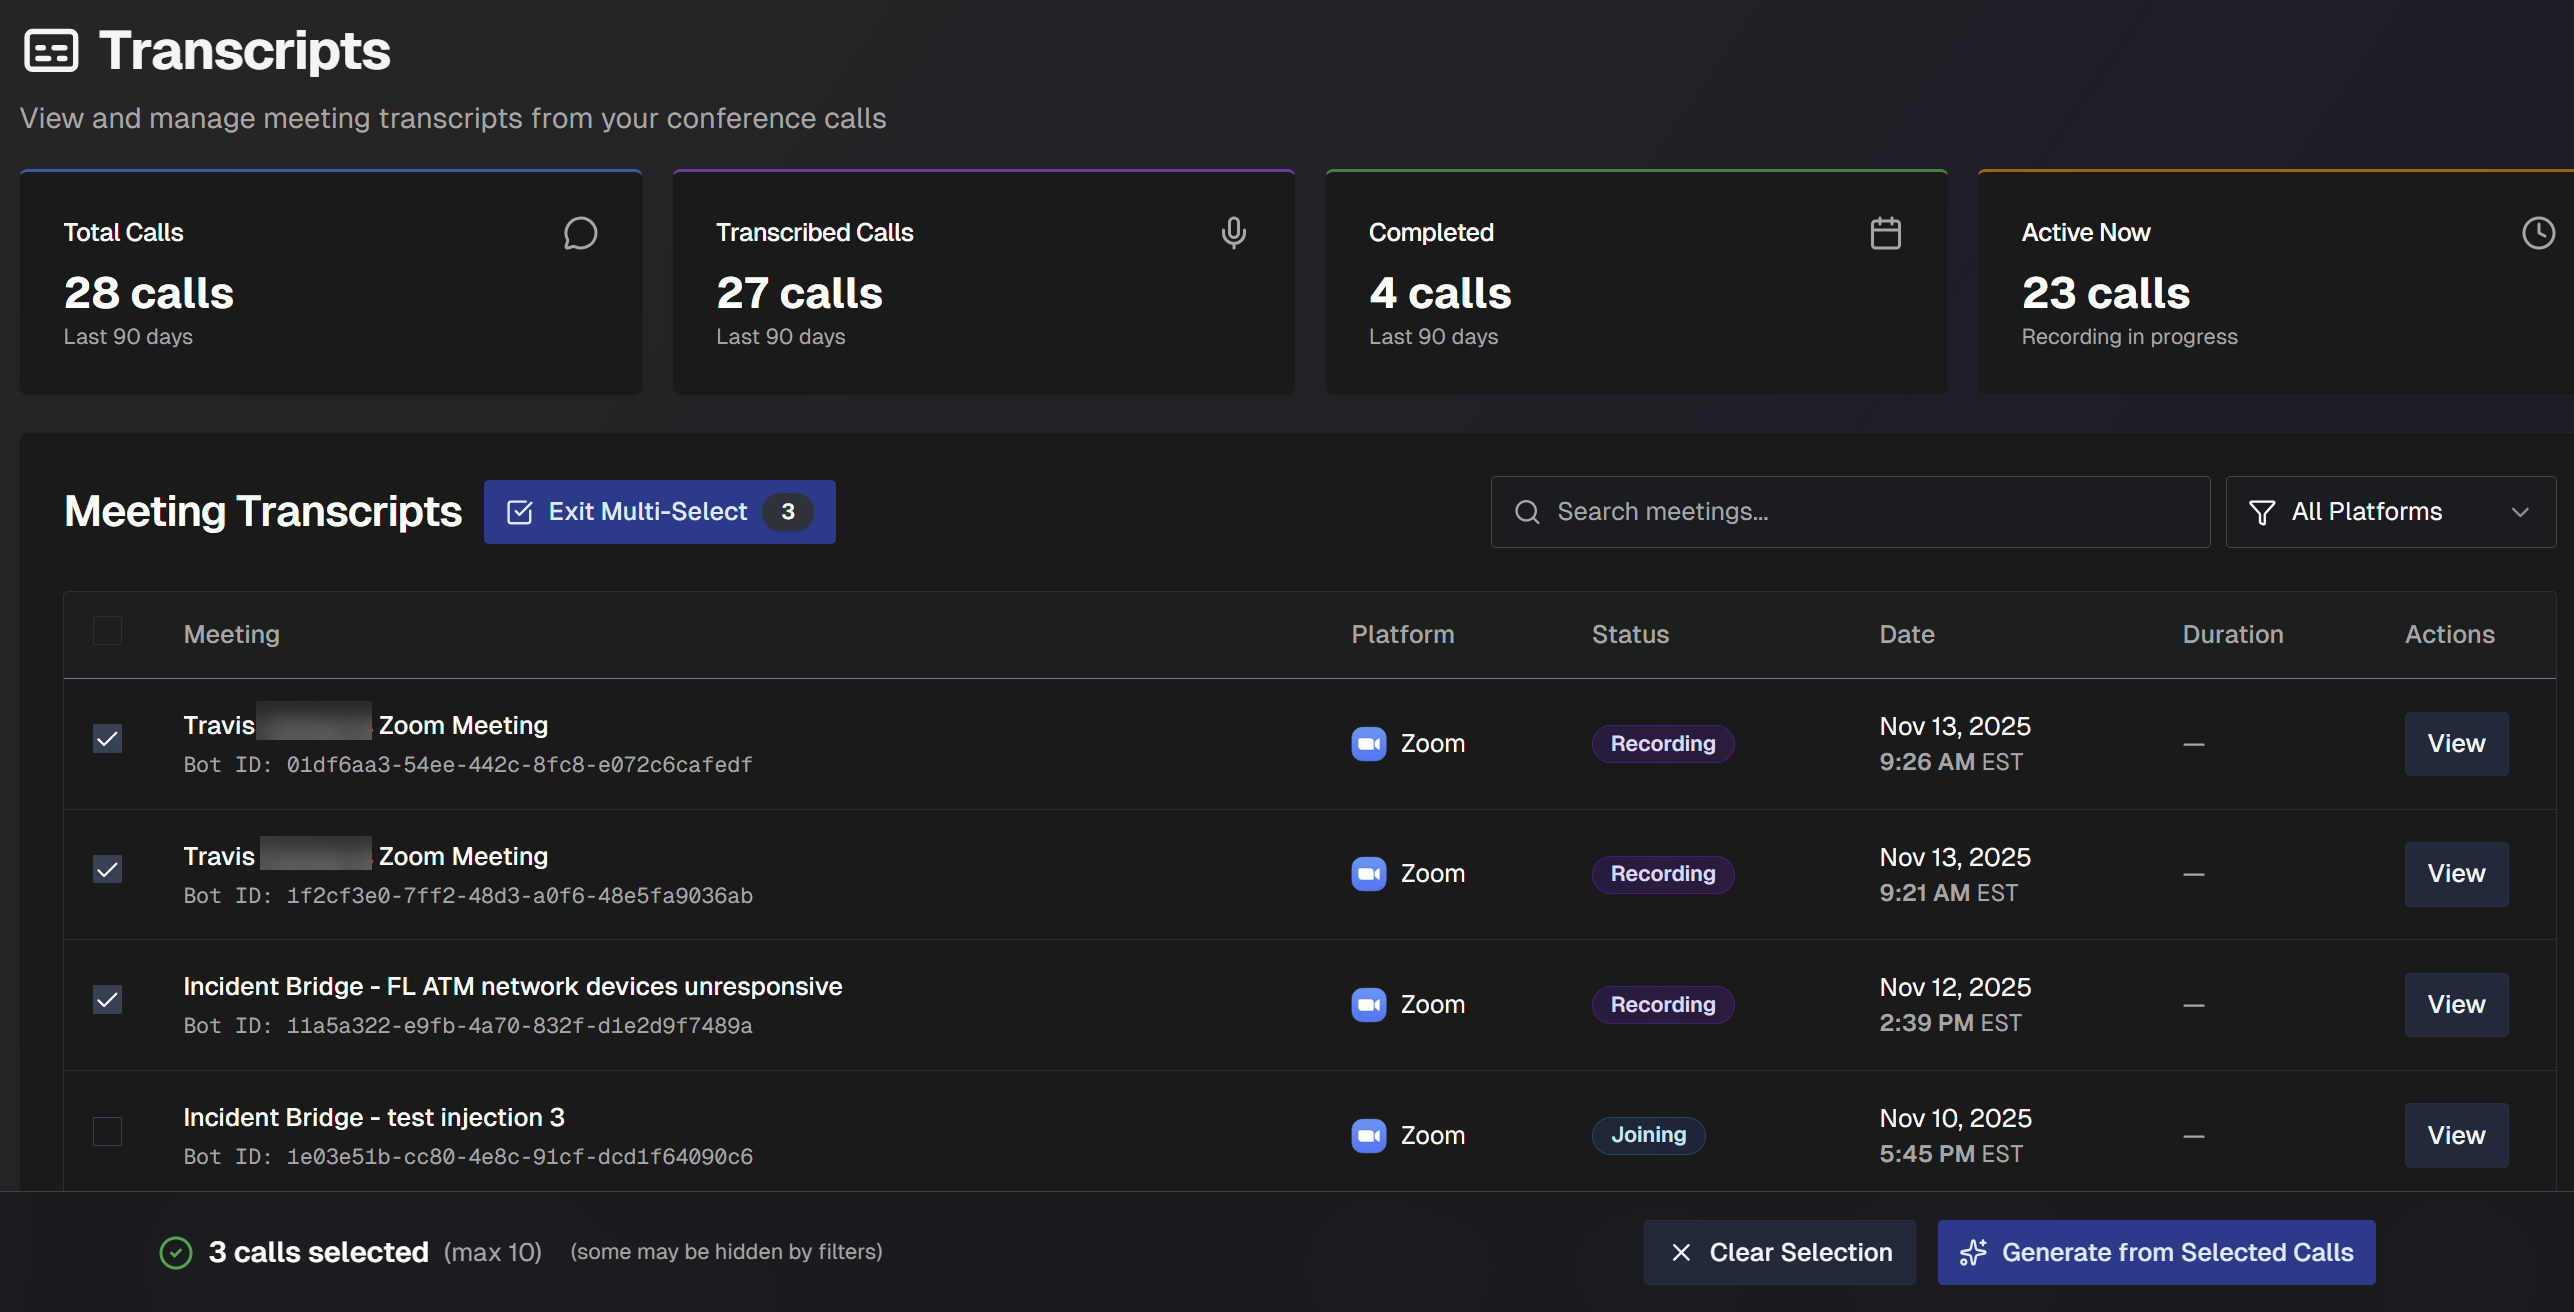
To use multi-select mode:
On the Transcripts dashboard, select the Multi-Select Mode button.
Select the desired transcripts from the list.
Select Generate from Selected Calls.
In the Multi-Transcript Generation page, you can view details about the selected calls and the raw transcripts. Review the content as needed.
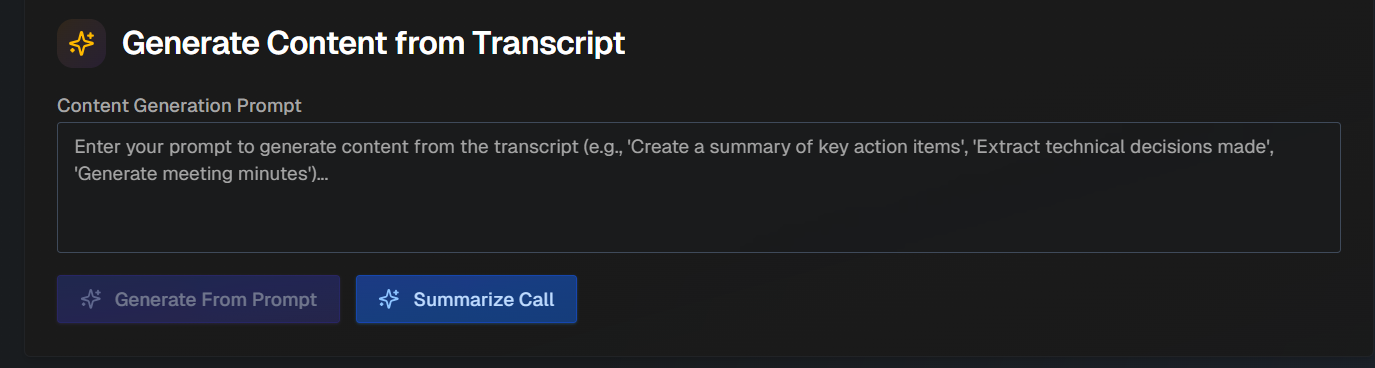
In the Generate Content from Transcripts box, ask AI Incident Assistant to generate content based on custom prompts or preset options. The following options are available:
Content Generation Prompt - enter a custom prompt to generate content from the selected transcripts.
Summarize All - ask AI Incident Assistant to create a comprehensive summary of the calls.
Use Goal Preset - use one of the goal presets to generate content. AI Incident Assistant has global presets available, or you can use one of the custom presets defined in the Call Transcription action plan.
(Optional) Click the Copy icon to copy AI Incident Assistant's response, or the Document icon to download it as a Word document.
Content not saved
Content generated from multi-transcript conversations is not saved in the web app. Be sure to copy or download content to save it for future reference.
(Optional) If you need additional information, enter a prompt into the Ask a follow up box, or select one of the Presets. Click Ask.

View a Transcript
To see additional details and a full transcript for a call, go to the desired meeting in the list and click View.
The full transcript screen shows you meeting details, including a timeline, full transcript, and speaking time analysis. You can copy the full transcript or download it as a text file at the top of the page.
Leaving calls
AI Incident Assistant will leave a call if it remains silent for an extended period. If a call is silent for 5.5 hours, AI Incident Assistant will exit the call.
If all members exit a bridge call that is being transcribed, AI Incident Assistant will end the transcription 10 minutes after the last call member leaves.
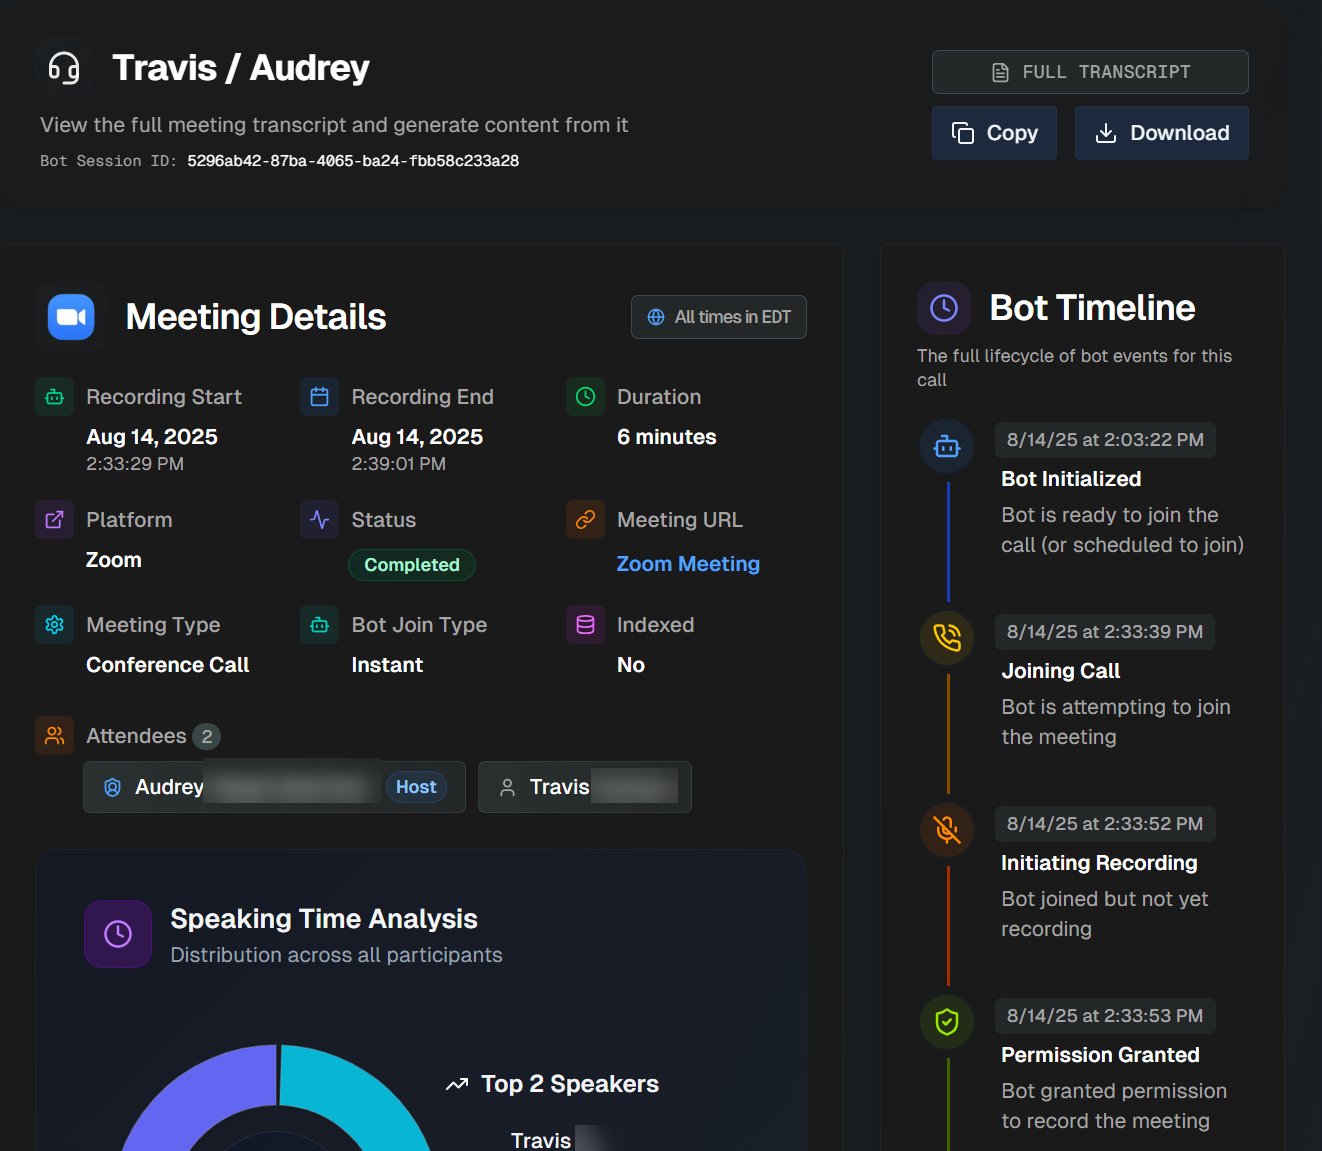
The details page is divided into the following sections:
Meeting Details
The Meeting Details section shows you high-level information about the call. The following information is available:
Field | Description |
|---|---|
Recording Start | The date and time that the recording began. |
Recording End | The date and time that the recording ended. |
Duration | How long the recording lasted, in minutes. |
Platform | The conferencing platform used to host the call. |
Status | Whether the call is scheduled, in progress, or completed. |
Meeting URL | The URL of the call. |
Meeting Type | The type of meeting that occurred. Options include:
|
Bot Join Type | How AI Incident Assistant joined the call. Options include Instant or Scheduled. |
Indexed | Whether or not the content of the meeting was indexed by AI Incident Assistant. |
Attendees | The names of the attendees who participated in the call. Hover over a name to view additional details such as whether they were the host, if they spoke in the meeting, and the time that they joined the meeting. |
Bot Timeline
The Bot Timeline section displays the full lifecycle of bot events for the call. This includes AI Incident Assistant's automated events, such as when it joined the call, started recording, and ended the call.
Speaking Time Analysis
The Speaking Time Analysis displays a breakdown of which participants spoke throughout the call and for how long.
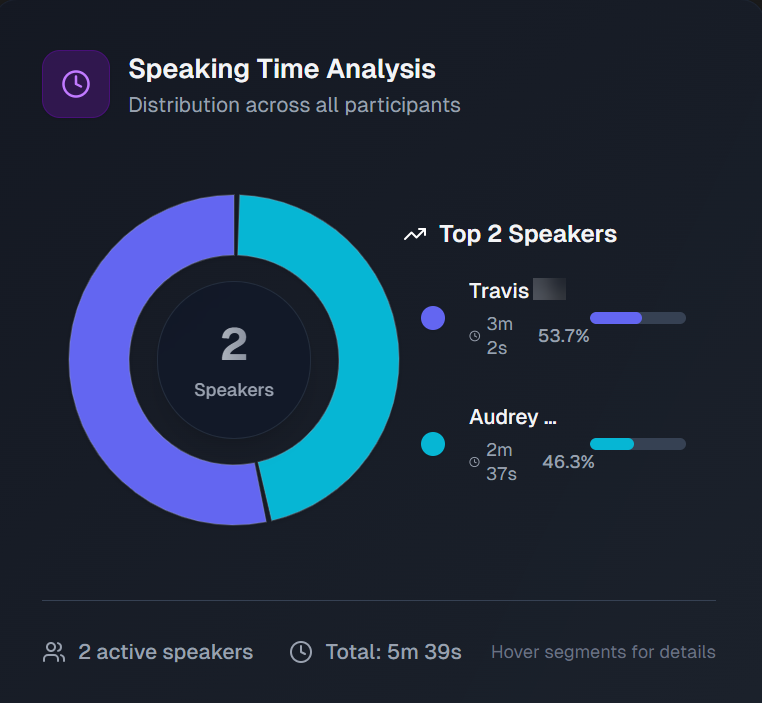
Hover over a segment of the pie chart to find additional details such as participant name, percent of call time spent speaking, and amount of time spent speaking.
Generate Content from Transcript
You can use the call transcript to create supplementary content, or ask AI Incident Assistant to format the transcript a specific way.
For example, you can ask AI Incident Assistant to extract a list of key decisions made on the call or to remove all filler words from a call transcript.
Type your prompt into the box and click Generate From Prompt. Click Summarize the Call to create a shortened call summary.
The generated content appears below the box. Click Copy to copy the content, or click Download to download the content as a text file.
Raw Transcript & Chat
The Raw Transcript & Chat section displays the full raw transcript of the call.
Transcript expiration
The expiration date of the transcript appears at the top of the Raw Transcript & Chat section.
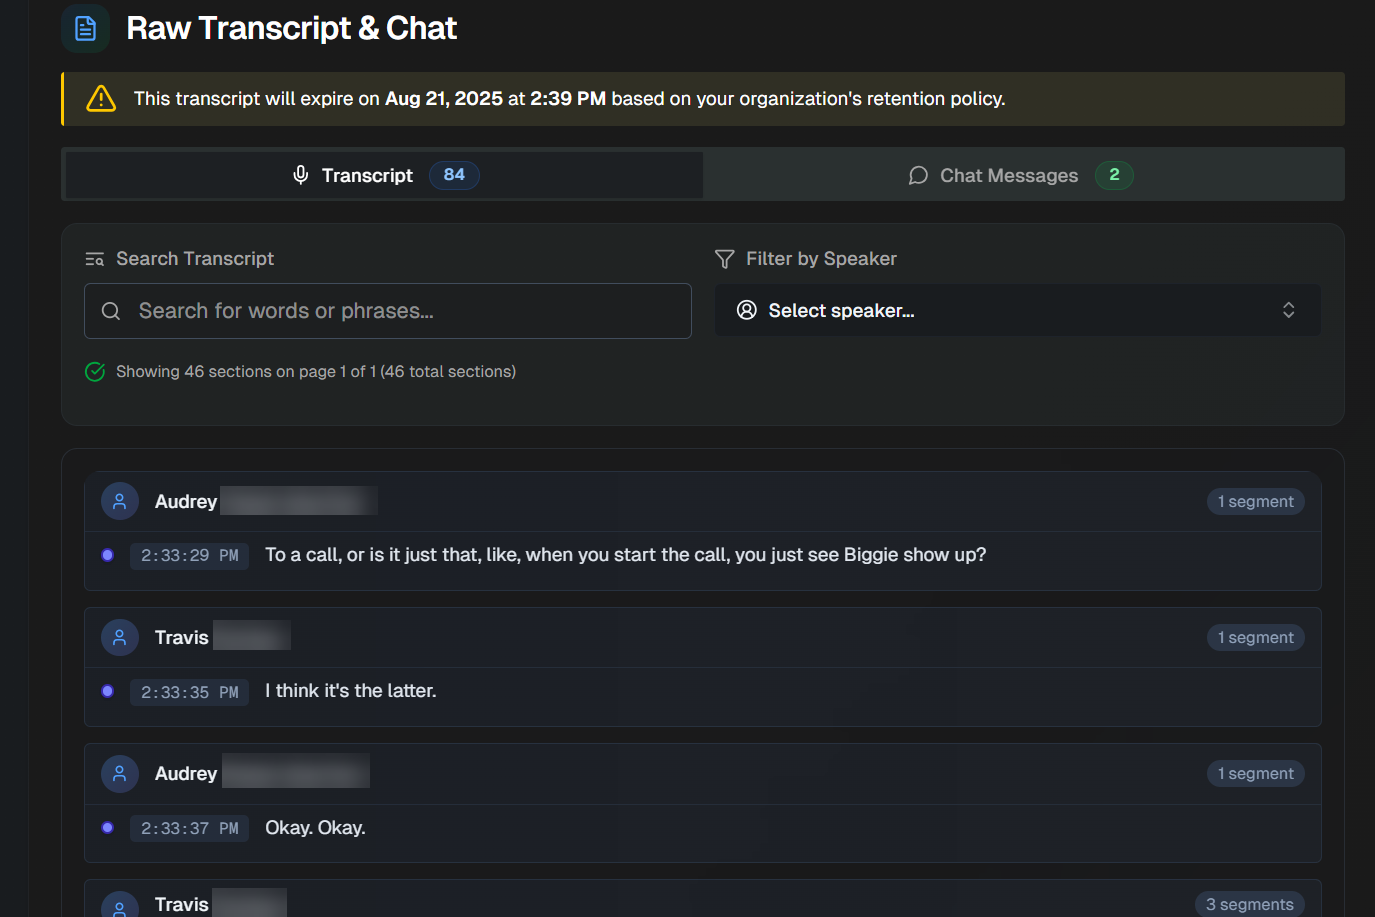
Select the Transcript tab to view all transcribed speech from the call. Select the Chat Messages tab to view written chat messages that were captured from the call.
Use the search box to search for a specific keyword or phrase spoken on the call. Use the Filter to view what was said by a specific speaker.
The transcript is divided into segments by speaker. The timestamp for each segment appears on the left side of the box.
Major Incident Management (MIM) Executions Dashboard
Automate and accelerate your incident management processes with Major Incident Management (MIM) workflows.
When an incident occurs, initiate a MIM process, and AI Incident Assistant will automatically keep your teams up to date, following the specific processes defined in MIM Templates.
Execute a new major incident, or view active and past major incident executions on the MIM Executions dashboard.
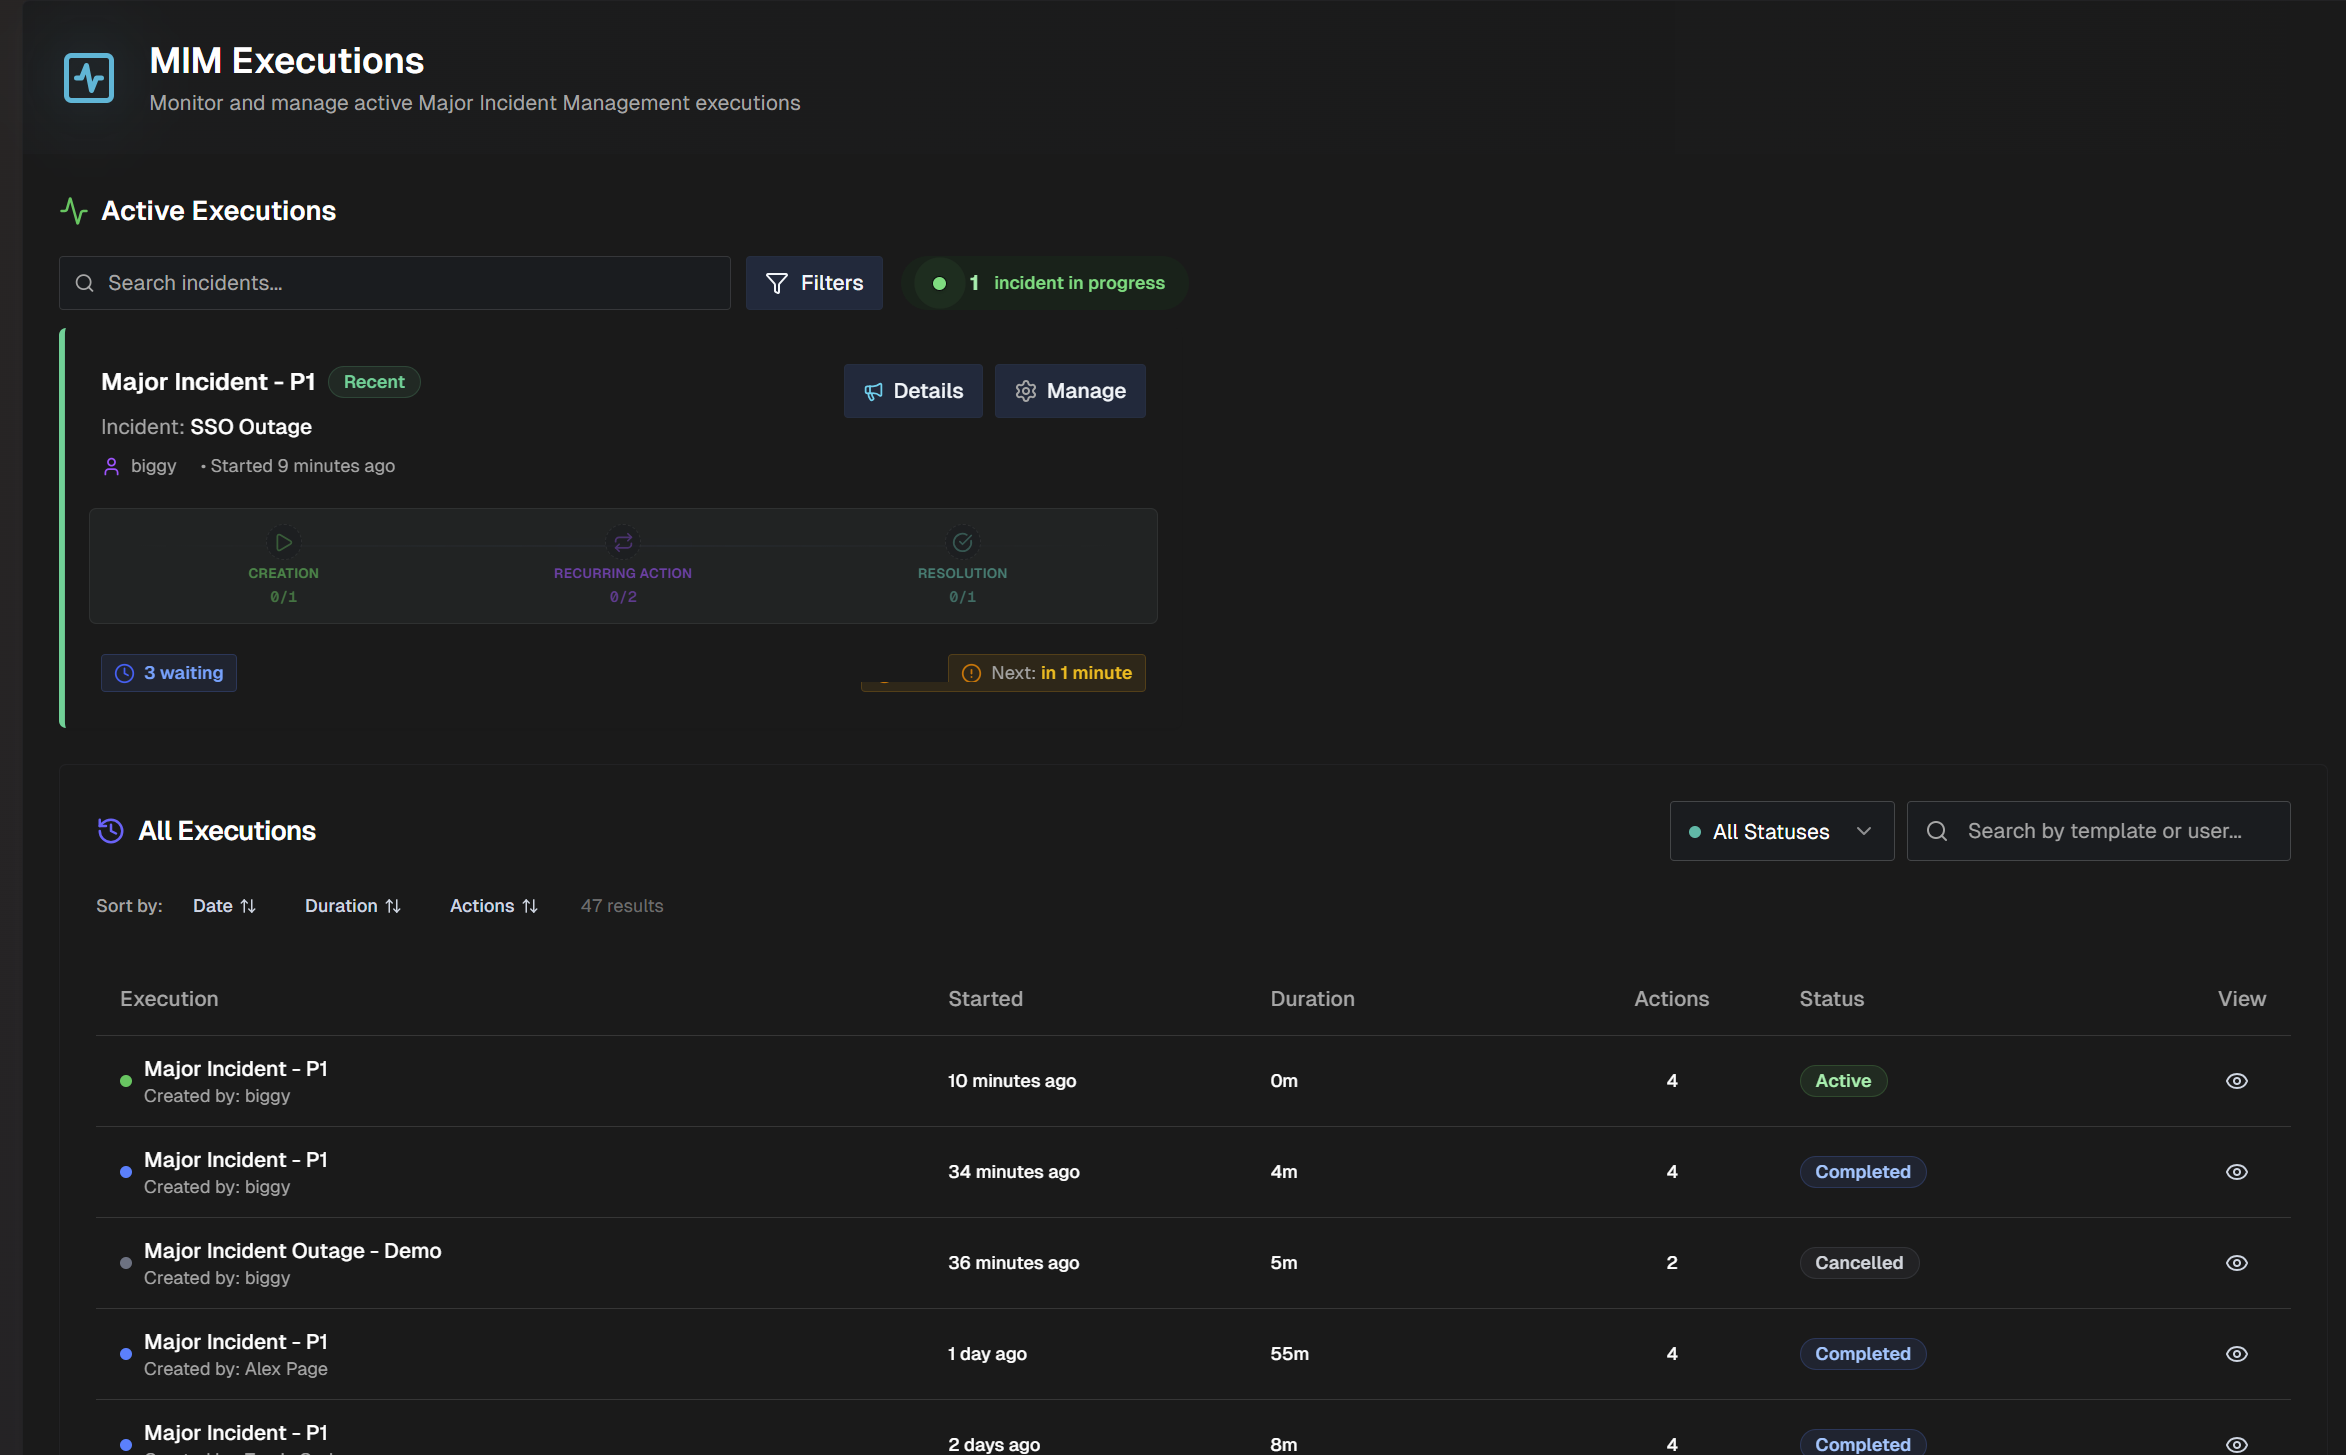
Active MIM Executions
Active major incident management executions appear at the top of the page, highlighted in green. Active executions are any major incidents that haven't been resolved or canceled.
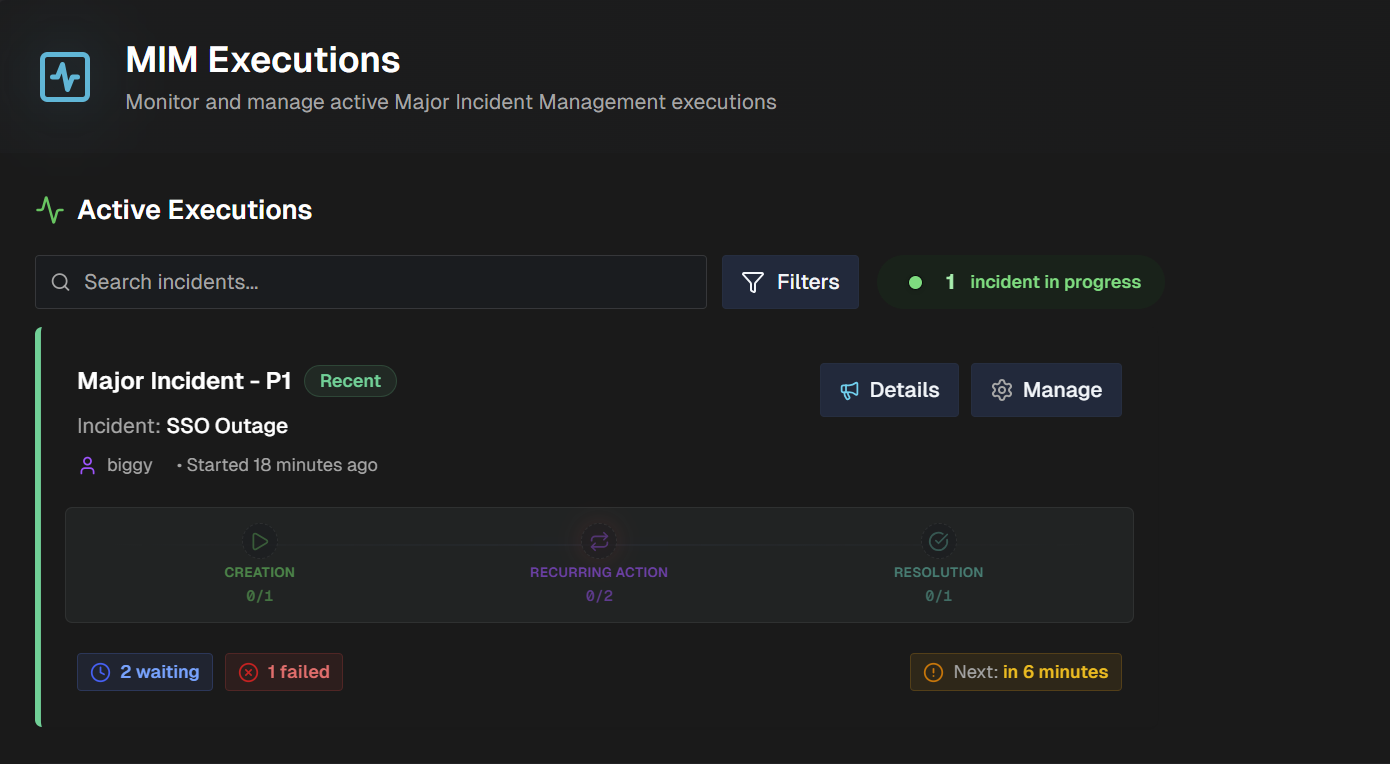
Click Filter to filter the active list by incidents that Started today, Need attention, or are Long running.
Use the Search bar to find a specific active incident.
On each active incident, view basic information such as the incident name, user who opened the incident, start time, and the number of completed, failed, and pending actions.
Click Details to view additional information about the incident. The following information is available in the details window:
Incident name
Priority
Status
Name of user who opened the incident
Last updated date/time
Link to the live incident in Teams or Slack
Summary
Impact information
Action items
Follow-up items
Environment
Region
Related links
Click Manage to open the MIM Execution Details page.
All Executions
The full list of incidents appears below the active list.
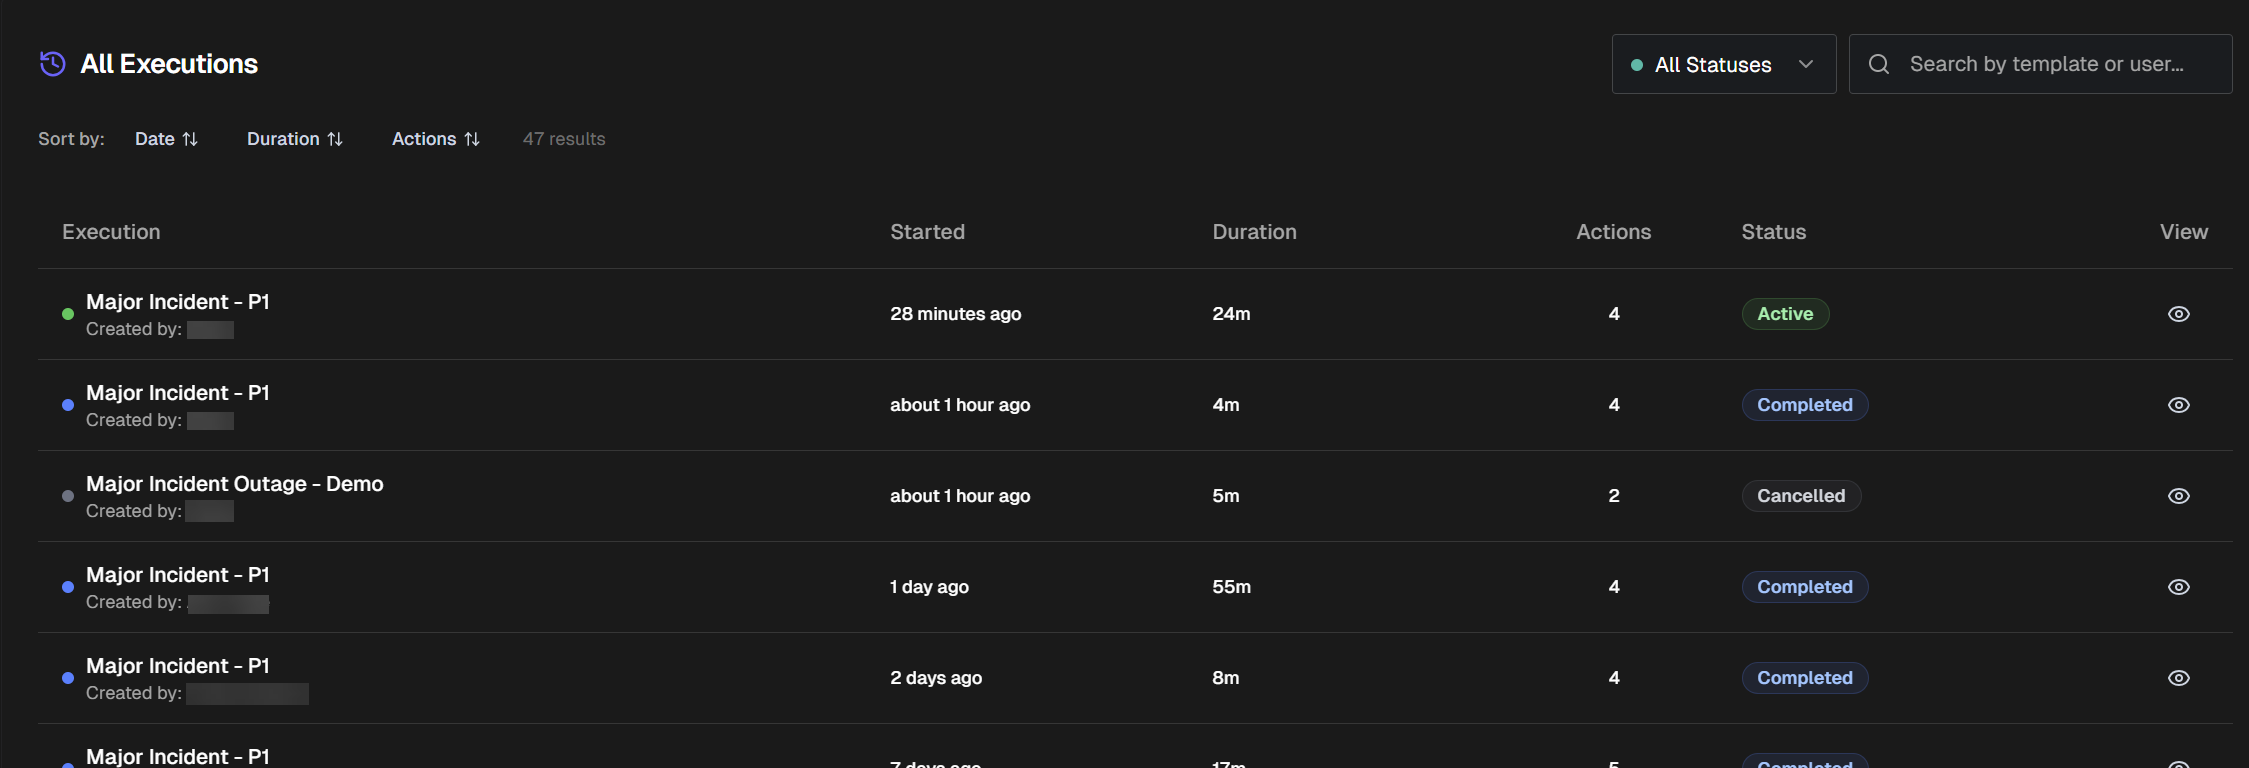
The following information about each incident is available:
Execution name
MIM template name
Incident creator
Start date
Duration
Number of actions
Status
The full list can be sorted by Date, Duration, or number of Actions. You can also filter the list by Status.
To find a specific MIM execution, use the Search bar.
Click View on any incident to open the MIM Execution Details page.
Execute a New Major Incident
New major incidents can be executed from the MIM Executions Dashboard, or in Slack or Teams.
To execute a new major incident from the MIM Executions Dashboard:
In the top right of the page, select + New MIM Execution.
In the New MIM Execution window, select the MIM Template to use for the incident, then click Next.
Enter the incident Title and, optionally, enter an incident Description. This information will appear in the incident banner. Click Next.
Configure the Communication Channels where the MIM will send notifications or gather context. The available communication channels depend on what was configured in the selected MIM template. Click Next.
Review the incident information and selected communication channels to ensure everything looks correct.
(Optional) Use the toggle to select if you'd like to launch a Swarm Investigation alongside the MIM.
Click Create MIM. The MIM Execution Details page of the new incident opens.
View MIM Execution Details
Click any MIM execution in the list, or click the Manage button on an active incident to open the details page.
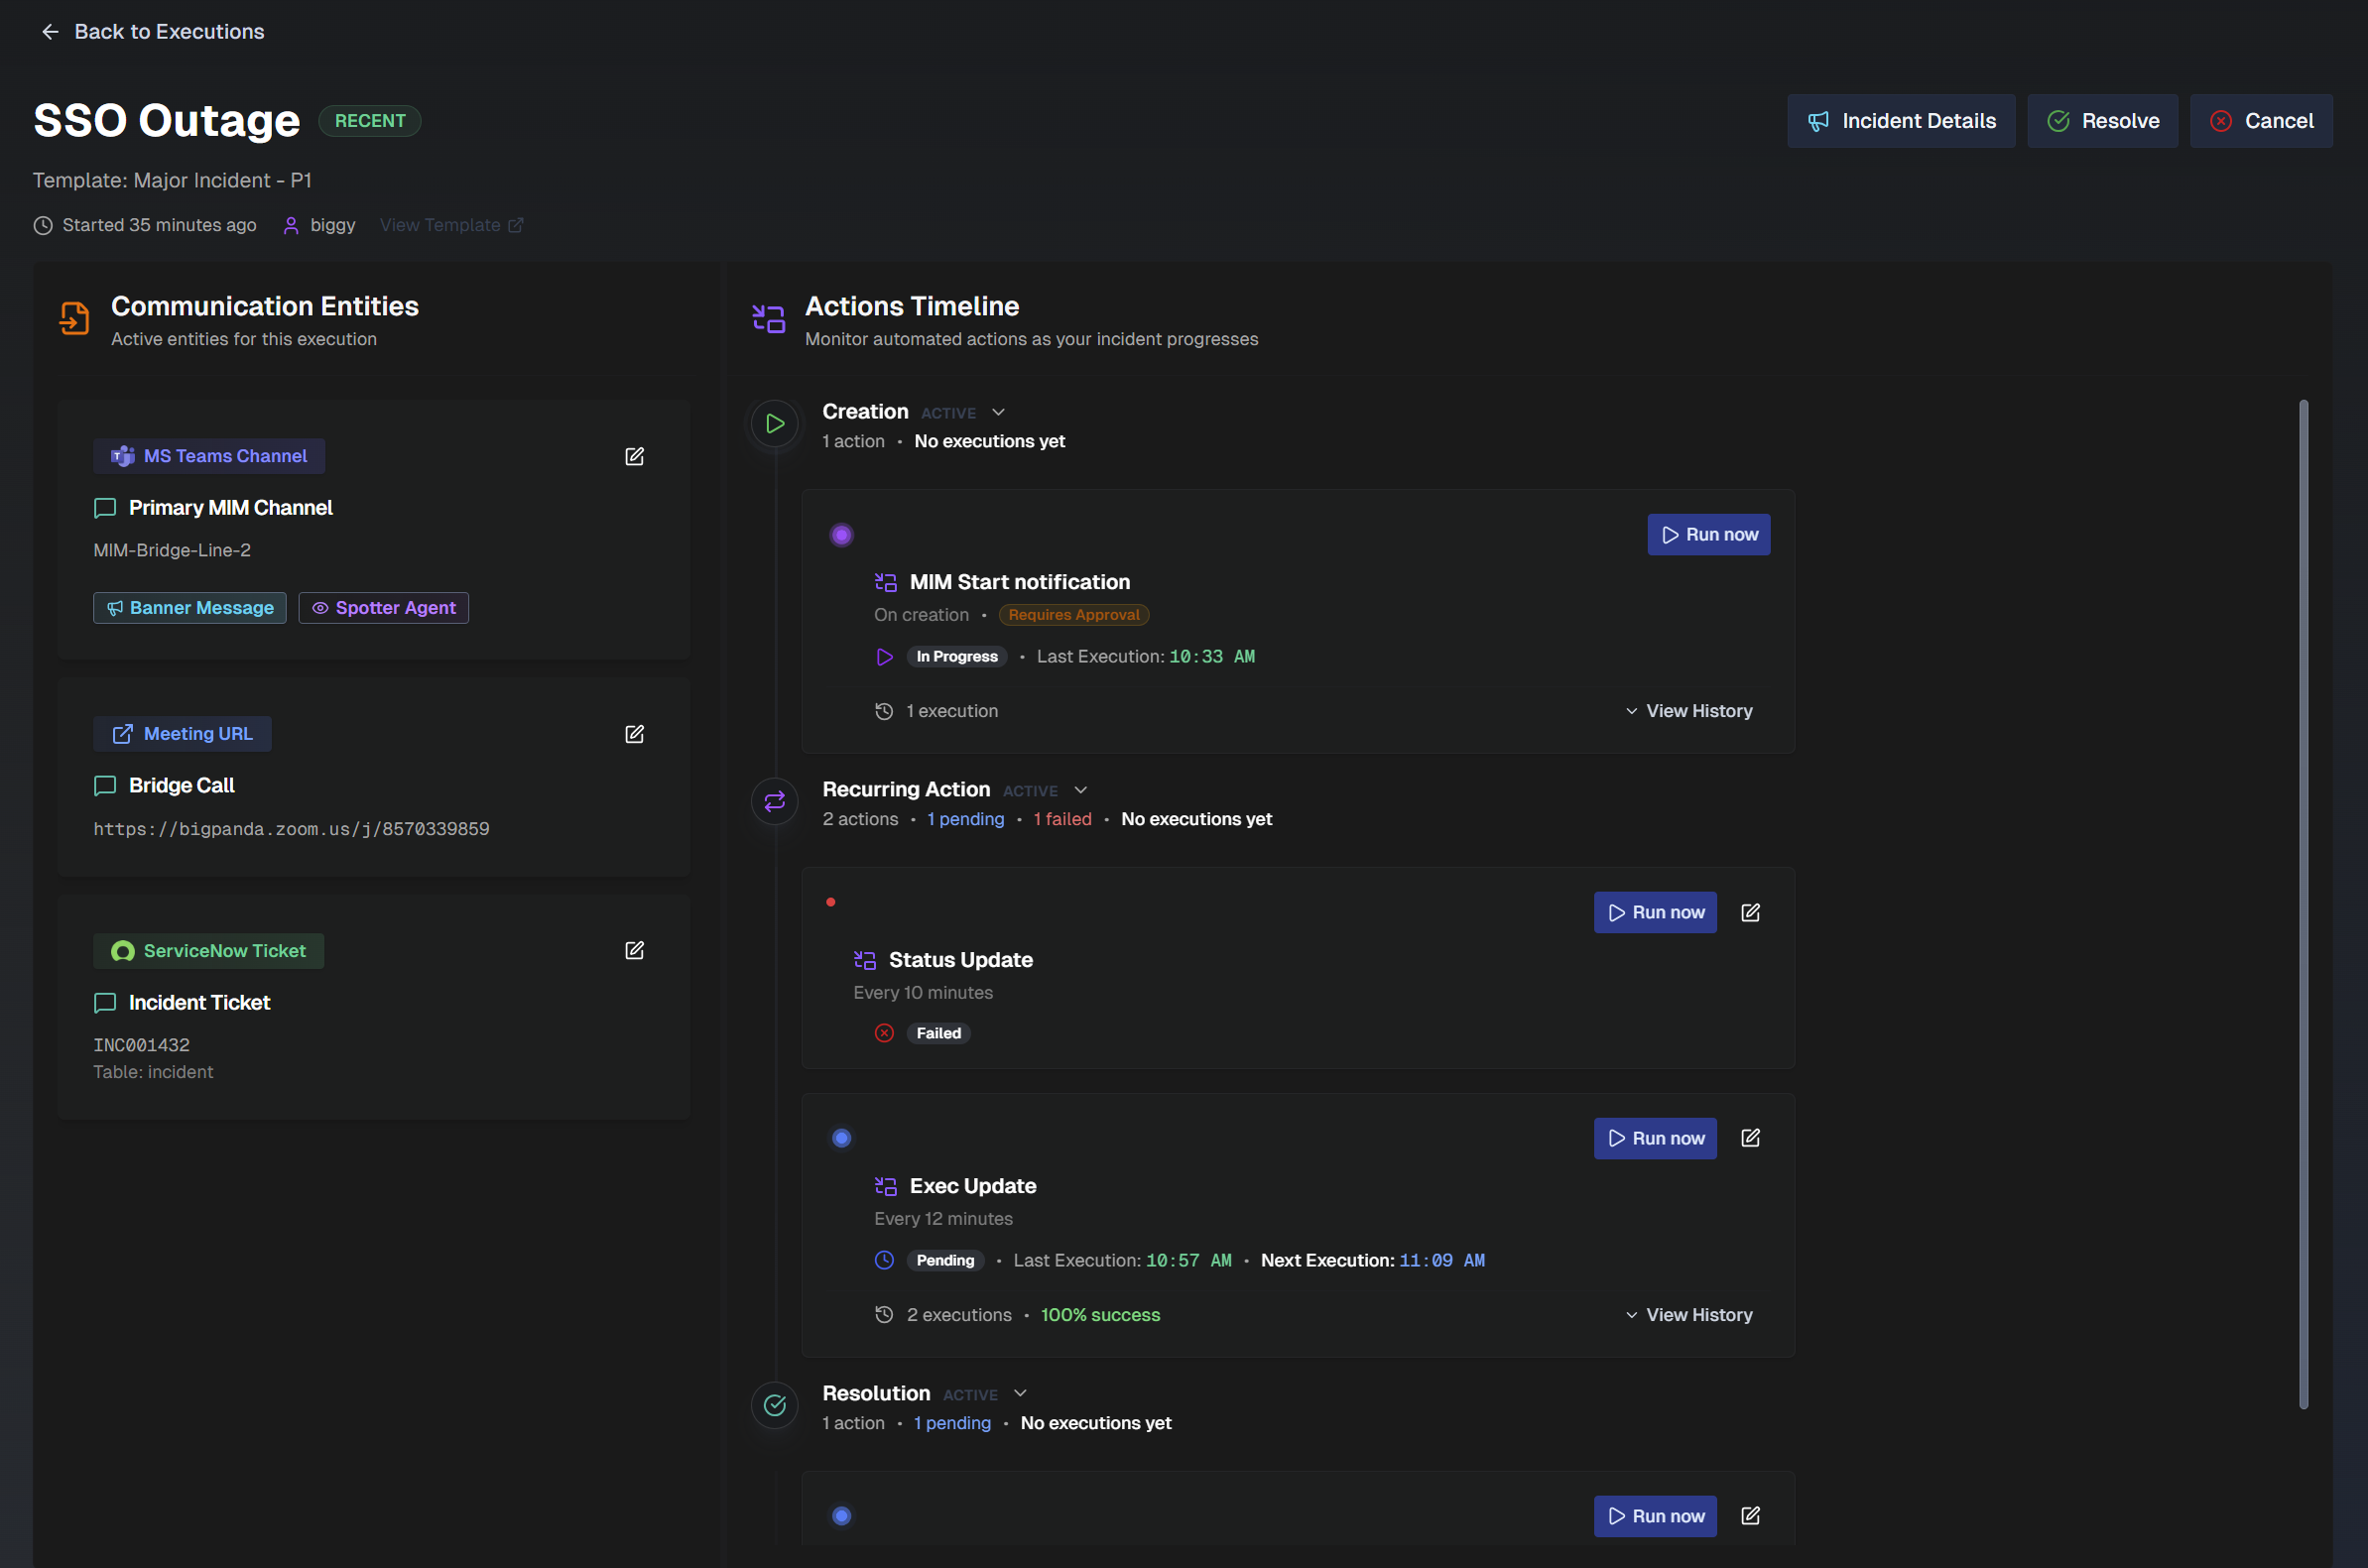
The following information is available on the page:
Incident name
Start date
Incident owner
MIM template link
Active communication entities
Actions timeline
At the top right of the page, you can view Incident Details for an Active Execution.
If the incident is active, you can Resolve or Cancel the incident.
Resolving an incident marks it as completed and finishes the incident lifecycle. When you resolve an incident, any actions set to occur at incident resolution will then take place.
Canceling an incident permanently cancels the execution and stops all pending actions from occurring.
In the Communication Entities section, view all active communication context sources and output destinations.
Communication entities can be edited by clicking the Pencil icon in the top right of the communication entity box. Edit communication entities to update Teams or Slack channels, email addresses, ServiceNow tickets, or entity preferences. See the MIM Template Communication Entities documentation for more information.
Meeting URLs
Meeting URL communication entities cannot be edited. If you'd like to use a different meeting link, you'll need to add it in the MIM Template.
In the Actions Timeline, view all actions that have taken place, or are scheduled to take place. Each action displays the following information:
Description
When it occurs or occurred
Whether it requires approval
Status of the execution
Last time an execution happened
Number of executions
Success rate
Click View History to see additional information about when the execution occurred.
If you need to run an action outside of its scheduled occurrence, click Run Now to run the action immediately.
If an action has not occurred yet or is recurring, you can edit it by clicking the Pencil icon in the top right of the action box. See the MIM Template Actions documentation for information on what can be edited.
Editing communication entities or actions
Any edits made only apply to this incident execution. Edits do not apply to the MIM template.
Next Steps
Get a high-level overview of how AI Incident Assistant works in the AI Incident Assistant documentation.
Learn how operators can Manage Incidents with AI Incident Assistant.