Swarm Investigations
With Major Incident Management (MIM), you can kick off a swarm of AI incident investigation agents when a swarm-enabled MIM Template is used. Or, create a standalone swarm investigation from within the web app.
View and manage autonomous incident investigations from the Swarm Investigations dashboard. The findings and results of all agent investigations are stored in your IT knowledge graph for later context retrieval.
The dashboard is divided into two tabs:
Investigations - view the results of agent swarm investigations.
Action Templates - create templates to instruct agents on what actions to take during an investigation.
How it Works
Major Incident Management (MIM) Templates define the actions to be taken in the event of a major incident. You can enable an agent swarm in your MIM template or from within the dashboard.
When a major incident starts, or you kick off an investigation manually, the agent swarm assembles. There are four types of agents used to investigate major incidents:
Reasoning - reviews information and determines what tasks or goals should be, and adds them to the reasoning ledger. Tasks on the reasoning ledger are then assigned to investigation agents.
Investigation - performs tasks that the reasoning agent adds to the reasoning ledger. Analyzes an issue and works towards a goal. A single swarm can have many investigation agents. Each investigation agent is assigned a name to differentiate them.
Adjudicator - receives information and proposals for actions from external sources, filters out noise, and determines what should be converted into tasks.
Human in the Loop - when the agent swarm needs to initiate an external action, the human in the loop agent notifies a human for approval.
These four agent types work together to discover the cause of an issue and determine a solution.
Each agent has a limited amount of time before it expires and moves to Burned Out status. This prevents an agent from spending too much time pursuing dead-end leads and ensures that the swarm stays on task.
When an agent expires, new investigation agents will be spun up to continue the investigation, per the reasoning agent's instructions.
Create a Standalone Swarm Investigation in the Web App
You can kick off a swarm investigation from the dashboard without initiating a major incident.
To create a new swarm investigation:
In the top right side of the page, click + New Investigation.
(Optional) In the New Investigation panel, enter a descriptive Title for the investigation.
Enter an Investigation Prompt in plain text. This tells the agents what problem to investigate. Include any helpful information such as systems affected, symptoms, recent changes, etc.
Click Create Investigation. The investigation will appear in the Investigations tab.
Investigations
In the landing page of the Investigations tab, view basic information about each agent investigation.
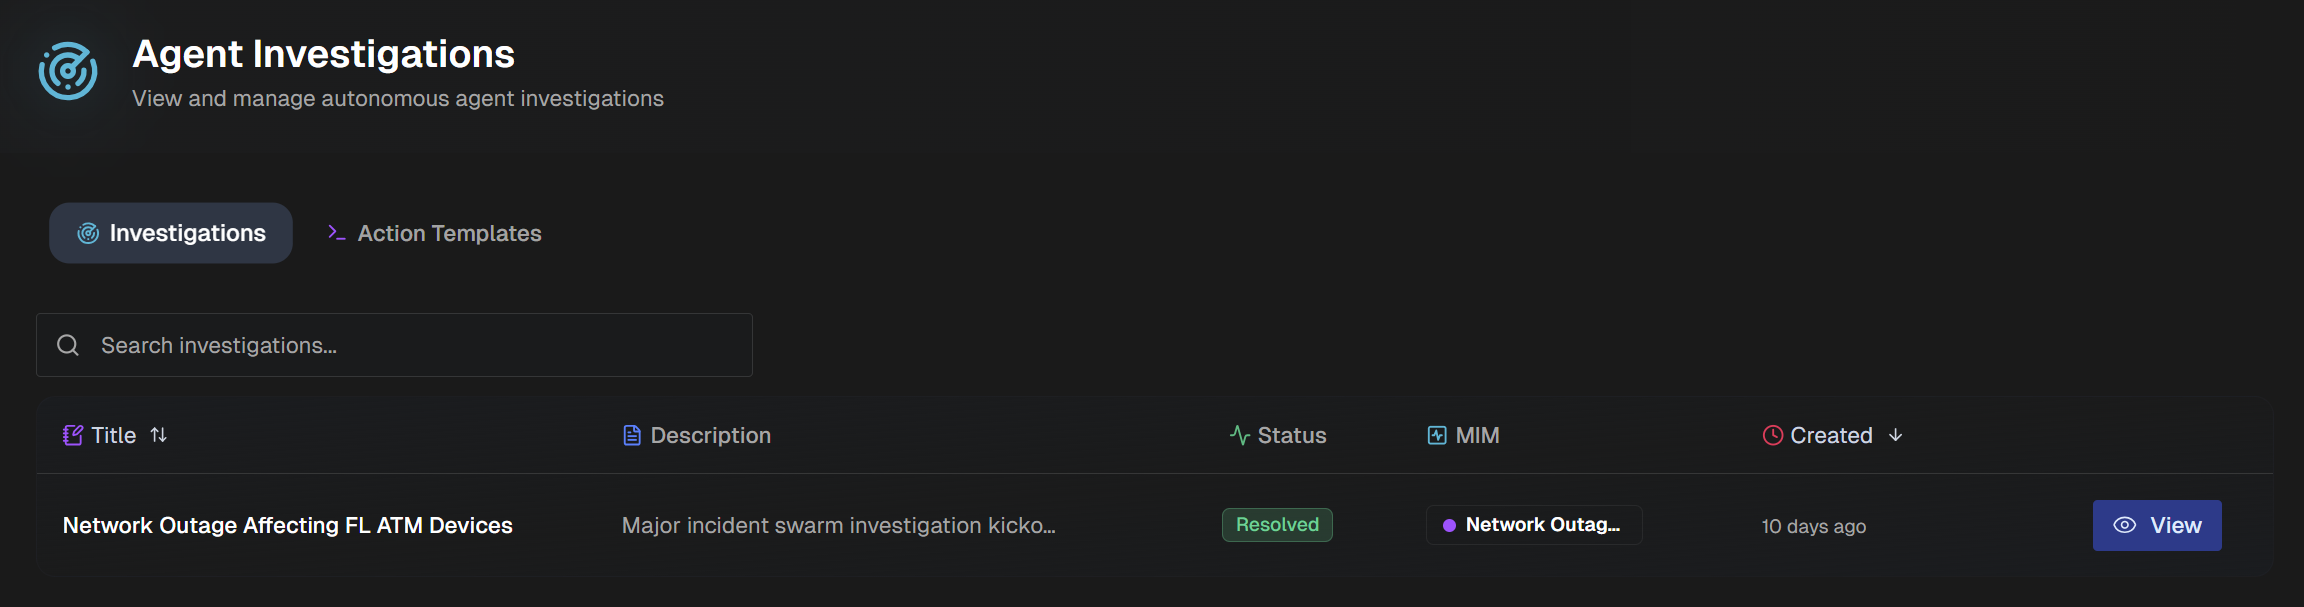
The following information about each investigation is available in the list:
Title
Description
Status (possible statuses include Open, Suspended, Waiting, Paused, and Resolved)
Last reasoned date
Created date
Sort the list by Title, Last reasoned date, or Created date.
Use the Search bar to find a specific agent investigation.
To see details about an investigation, click View.
Agent Investigation Details
The agent investigation details page displays information about a specific investigation.
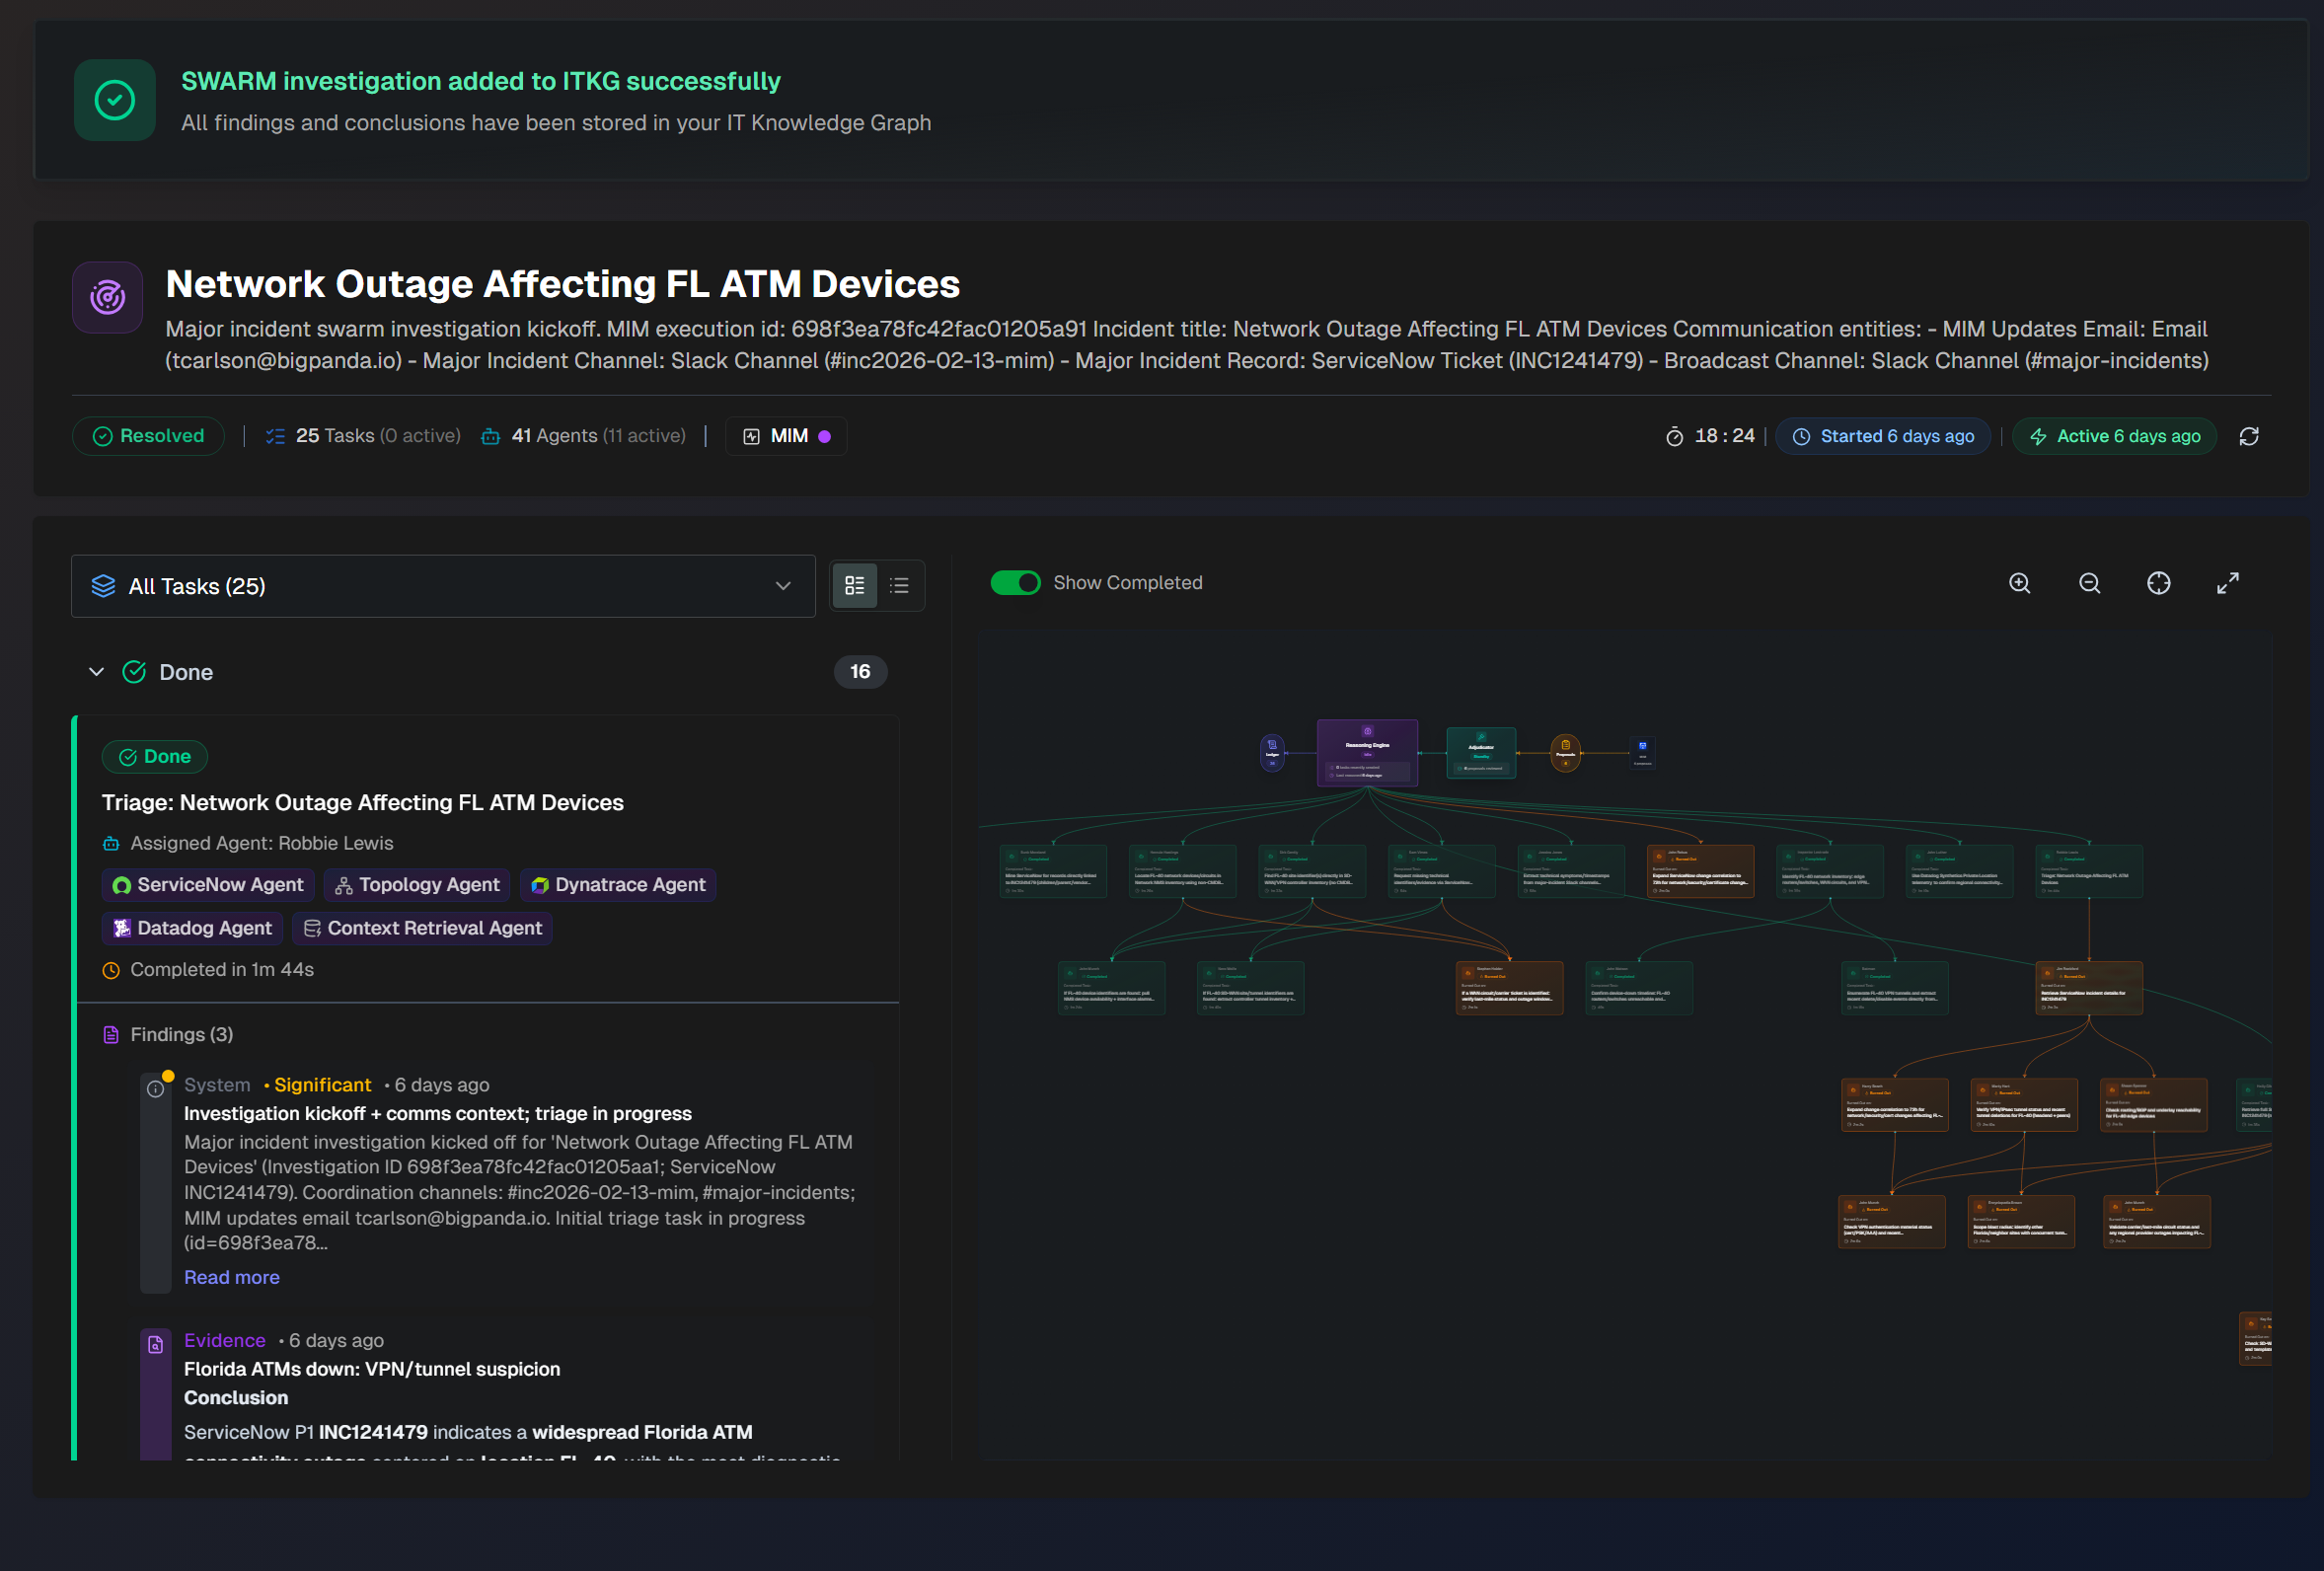
In the top section of the page, basic information about the investigation is available. The following is displayed:
Incident title
Summary
Status
Number of tasks
Number of active agents
Link to MIM template
Incident duration
Created date
Last activity date
Last reasoned date
If the investigation is currently open, you can click Pause to stop it temporarily.
Best practice
We recommend pausing investigations during periods when no activity is occurring in the MIM. This prevents agents from continuously investigating and reduces noise in the details page.
Click the Refresh button to update the page's information.
If the investigation is in a resolved status, the most important findings are displayed below the top bar. The findings are separated into three boxes:
Box | Description |
|---|---|
Investigation Summary | Includes a short overview of the investigation, including the Problem Context, Key evidence and correlation, Impacted topology path, and Actions taken and findings. |
Root Cause | The predicted root cause of the major incident, based on the findings of the agent swarm. |
Resolution | Only appears if the investigation has been resolved. Information about the steps that were taken to resolve the incident. |
The rest of the page is divided into three sections:
Task Details
On the left side of the page, a list of tasks conducted as part of the investigation is available. Use the drop-down menu to sort the task list by status. The following are possible statuses:
Queued - task is in line, but hasn't taken place yet
In Progress - task is currently happening
Pending Review - hasn't received human review
Done - task is complete
Failed - execution of the task was not successful
Cancelled - contains information found by the agent
Burned Out - agent reached its' time limit before the task was completed
Choose between Detailed View or Compact View to the right of the task drop-down.
Click any task in the list to view additional details. The task side panel opens with information about the task.
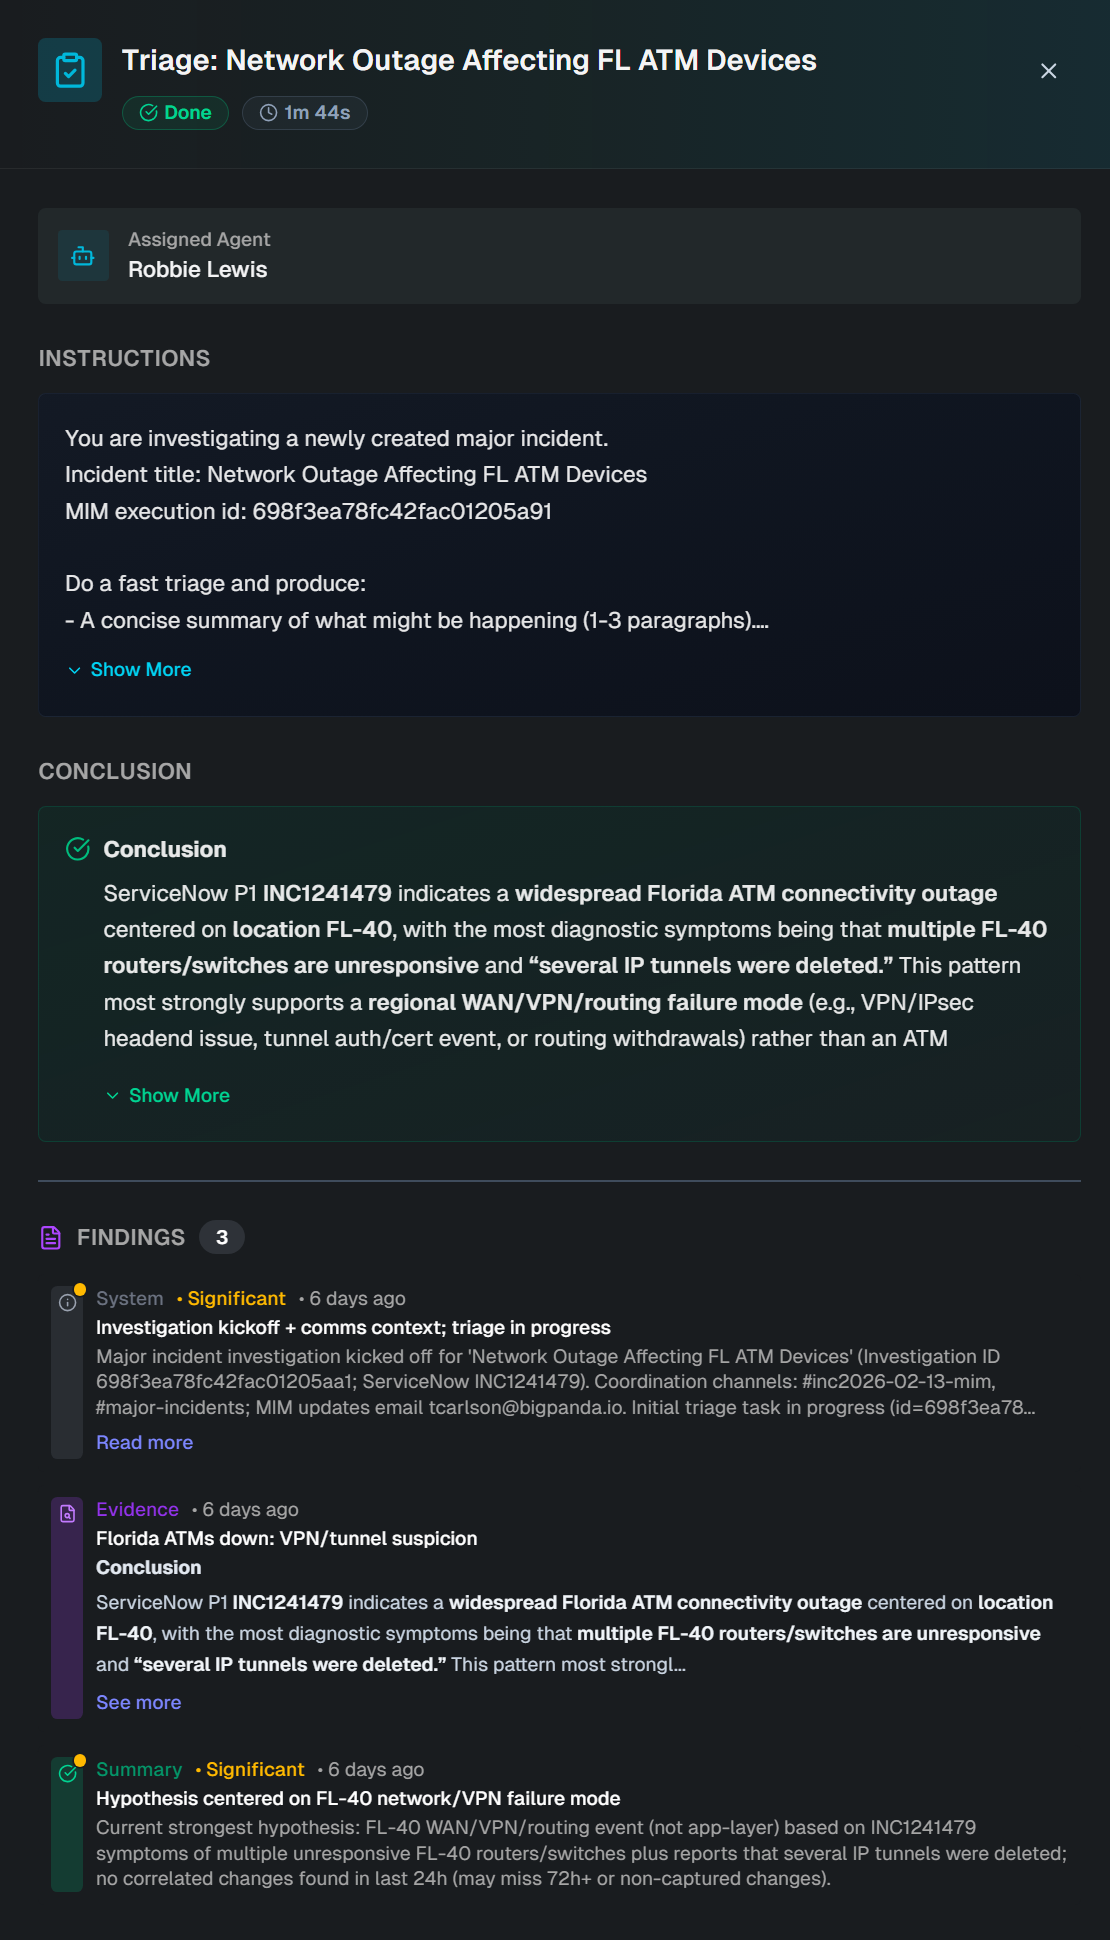
The panel is divided into the following sections:
Section | Description |
|---|---|
Header | The following details in the top section of the panel are available:
|
Instructions | Prompt given to the AI agent to complete the task. |
Conclusion | Conclusion reached by the AI agent after completing the task. |
Findings | Information that the AI agent found during the investigation. Each finding is categorized by type. The following types are possible:
Findings considered significant by the LLM are marked with an orange dot. |
Investigation Visualization
On the right side of the investigation details screen is the investigation visualization. The visualization shows the flow of all agent tasks and their dependencies that occurred during the investigation.

To view the visualization in full screen, click the Expand icon. Use the Plus and Minus icons to zoom in and out on the visualization.
Toggle Show Completed on to display completed tasks. Toggle off to remove completed tasks from the visualization.
Investigation Agents
Click any of the Investigation agents in the investigation visualization to open a side panel containing additional information about their tasks and findings.
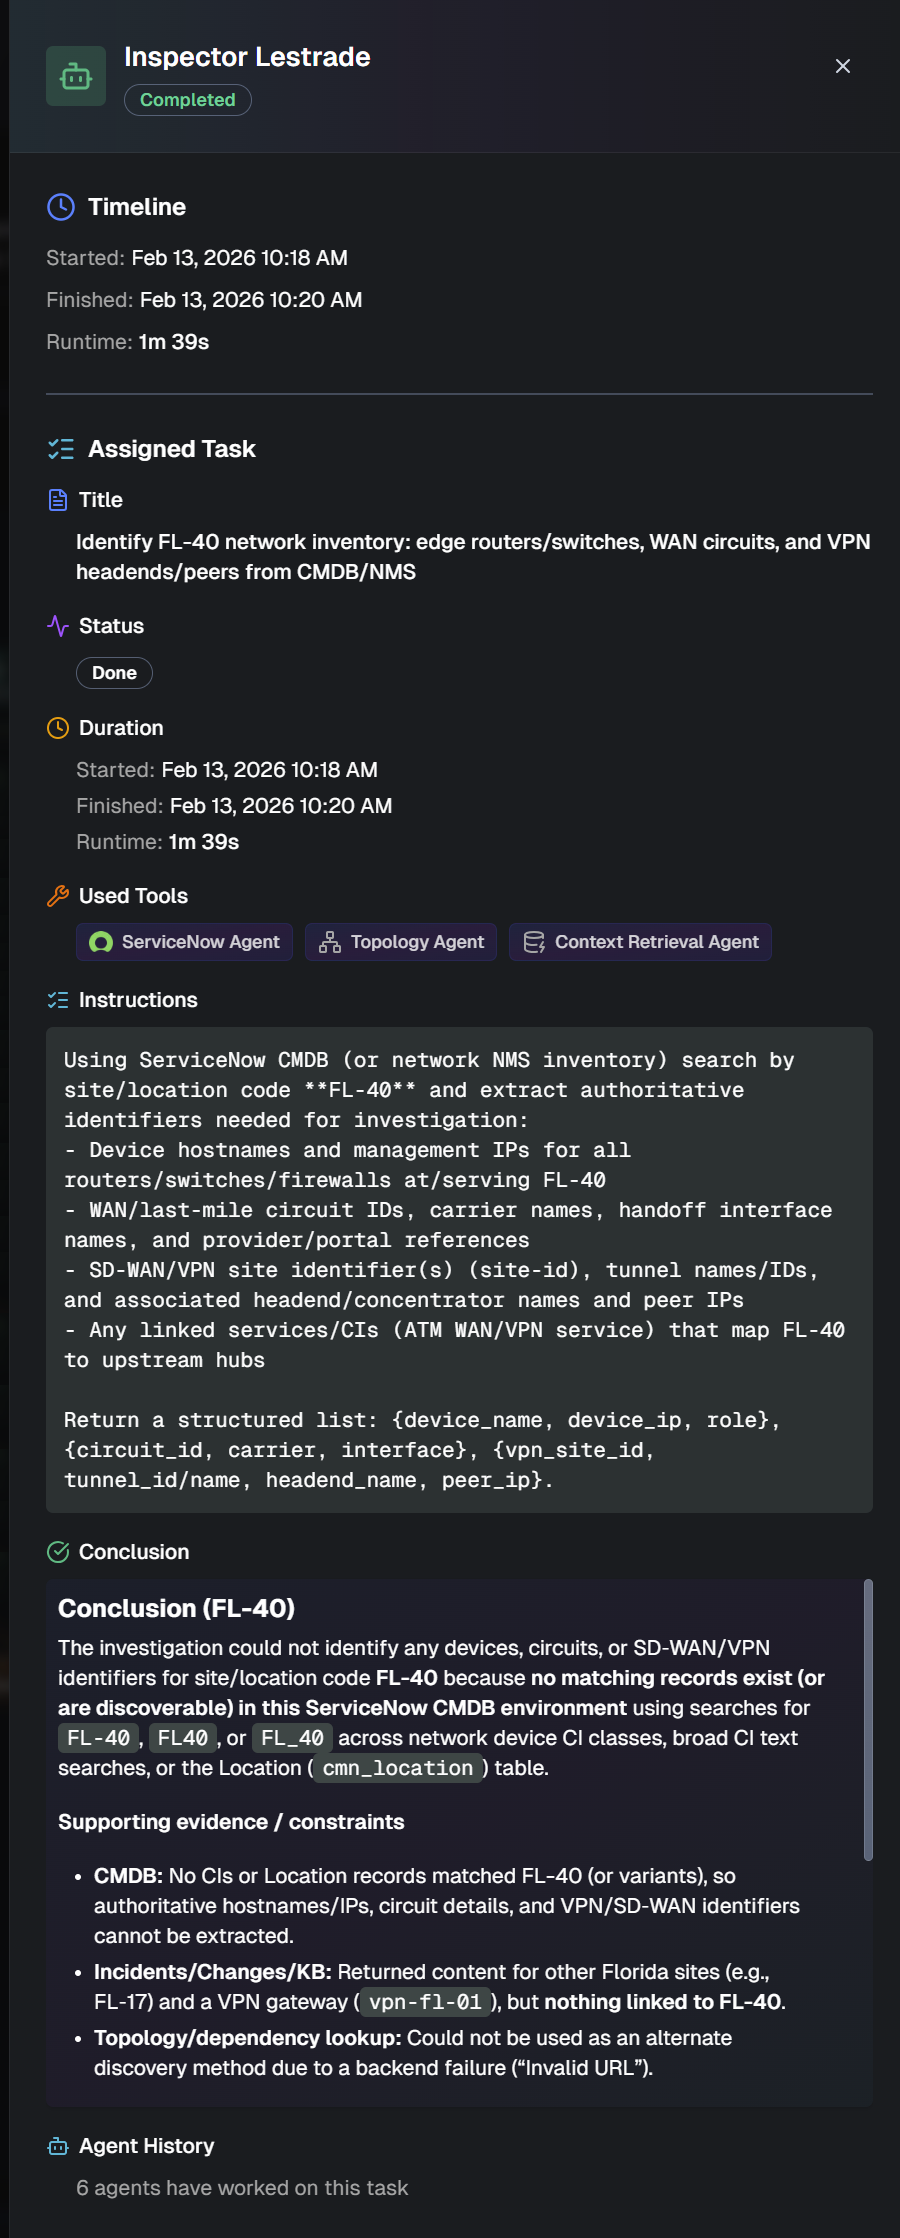
The following information about the agent is displayed:
Field | Description |
|---|---|
Agent name | Name that Biggy assigned to the agent. |
Agent status | Status of the agent. Possible statuses are In Progress, Done, or Burned Out. |
Timeline | Information about the time elapsed during the agent's lifetime. Displays the time the agent Started, Finished, and the total Runtime of the agent. |
Assigned Task | Information about the task assigned to the agent. The following details are available:
|
Agent History | Number of agents that have worked on the same task. |
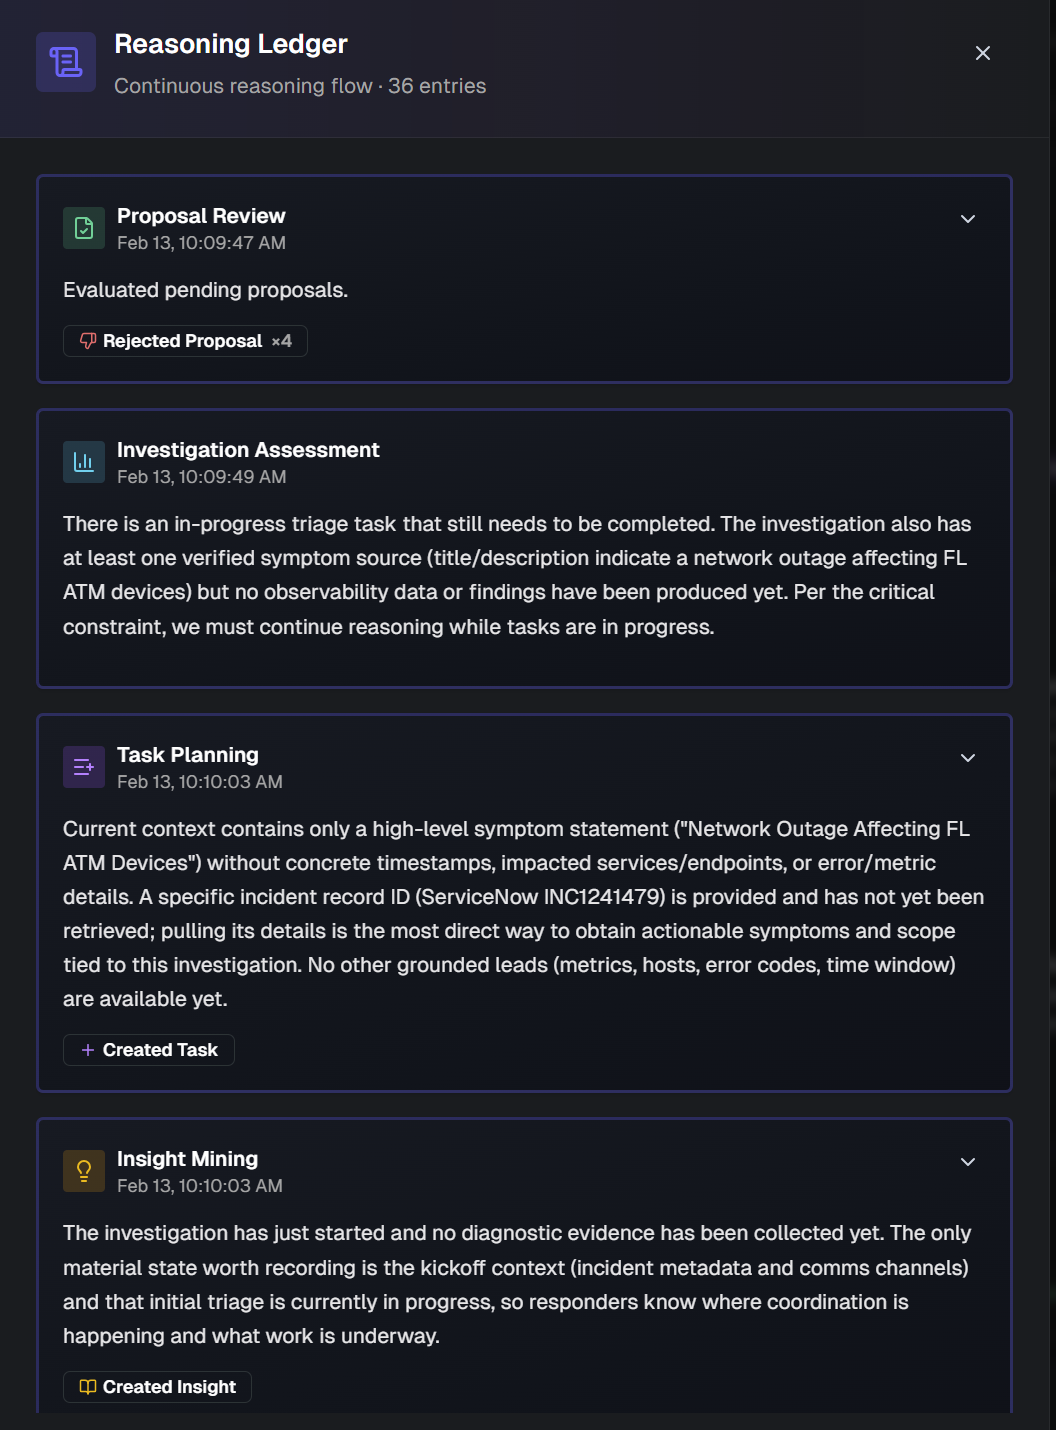
Ledger
In the investigation visualization, click the Ledger icon to open a side panel displaying the tasks that the reasoning agent has either assigned or scheduled.
Proposals Queue
In the investigation visualization, click the Proposals icon to open a side panel displaying the list of proposals for actions, received from external sources. The Adjudicator agent determines whether the proposals should be sent to the Reasoning agent for conversion into tasks.
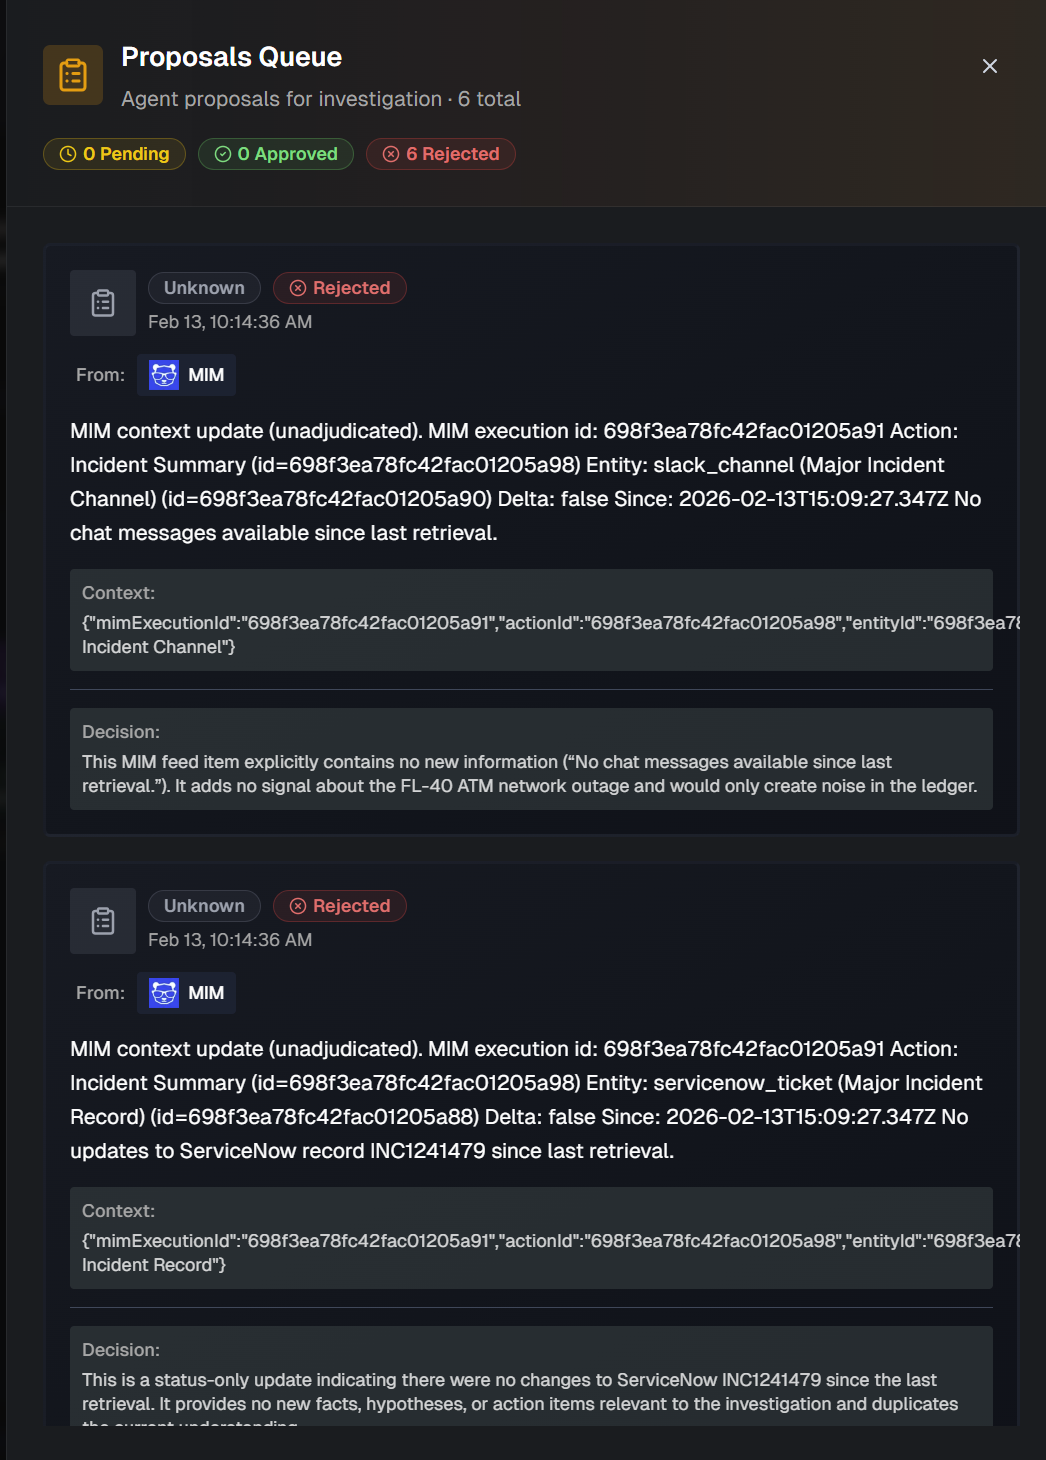
The top of the panel shows the number of proposals that are Pending, Approved, and Rejected.
For each proposal in the list, the Source, Status, Date of the proposal, Summary, Context, and Decision is displayed.
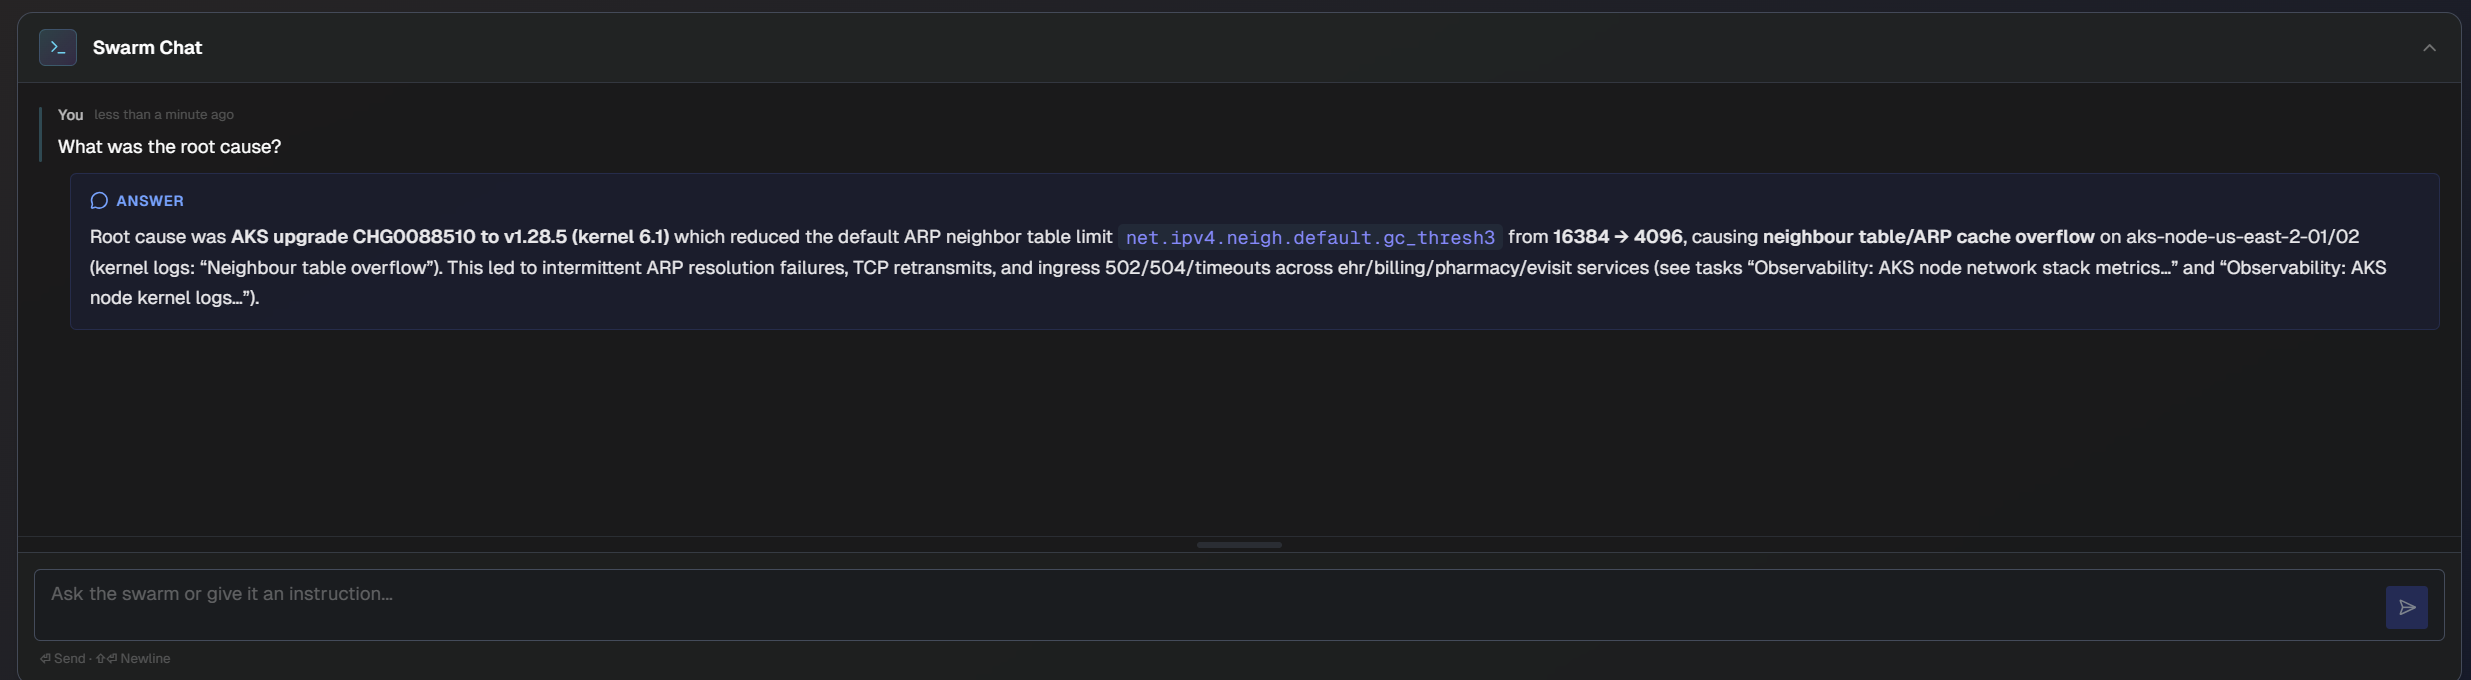
Swarm Chat
Use the Swarm Chat to communicate with the swarm.
You can ask questions to get answers from the investigation context, or give instructions to add to queue proposals.
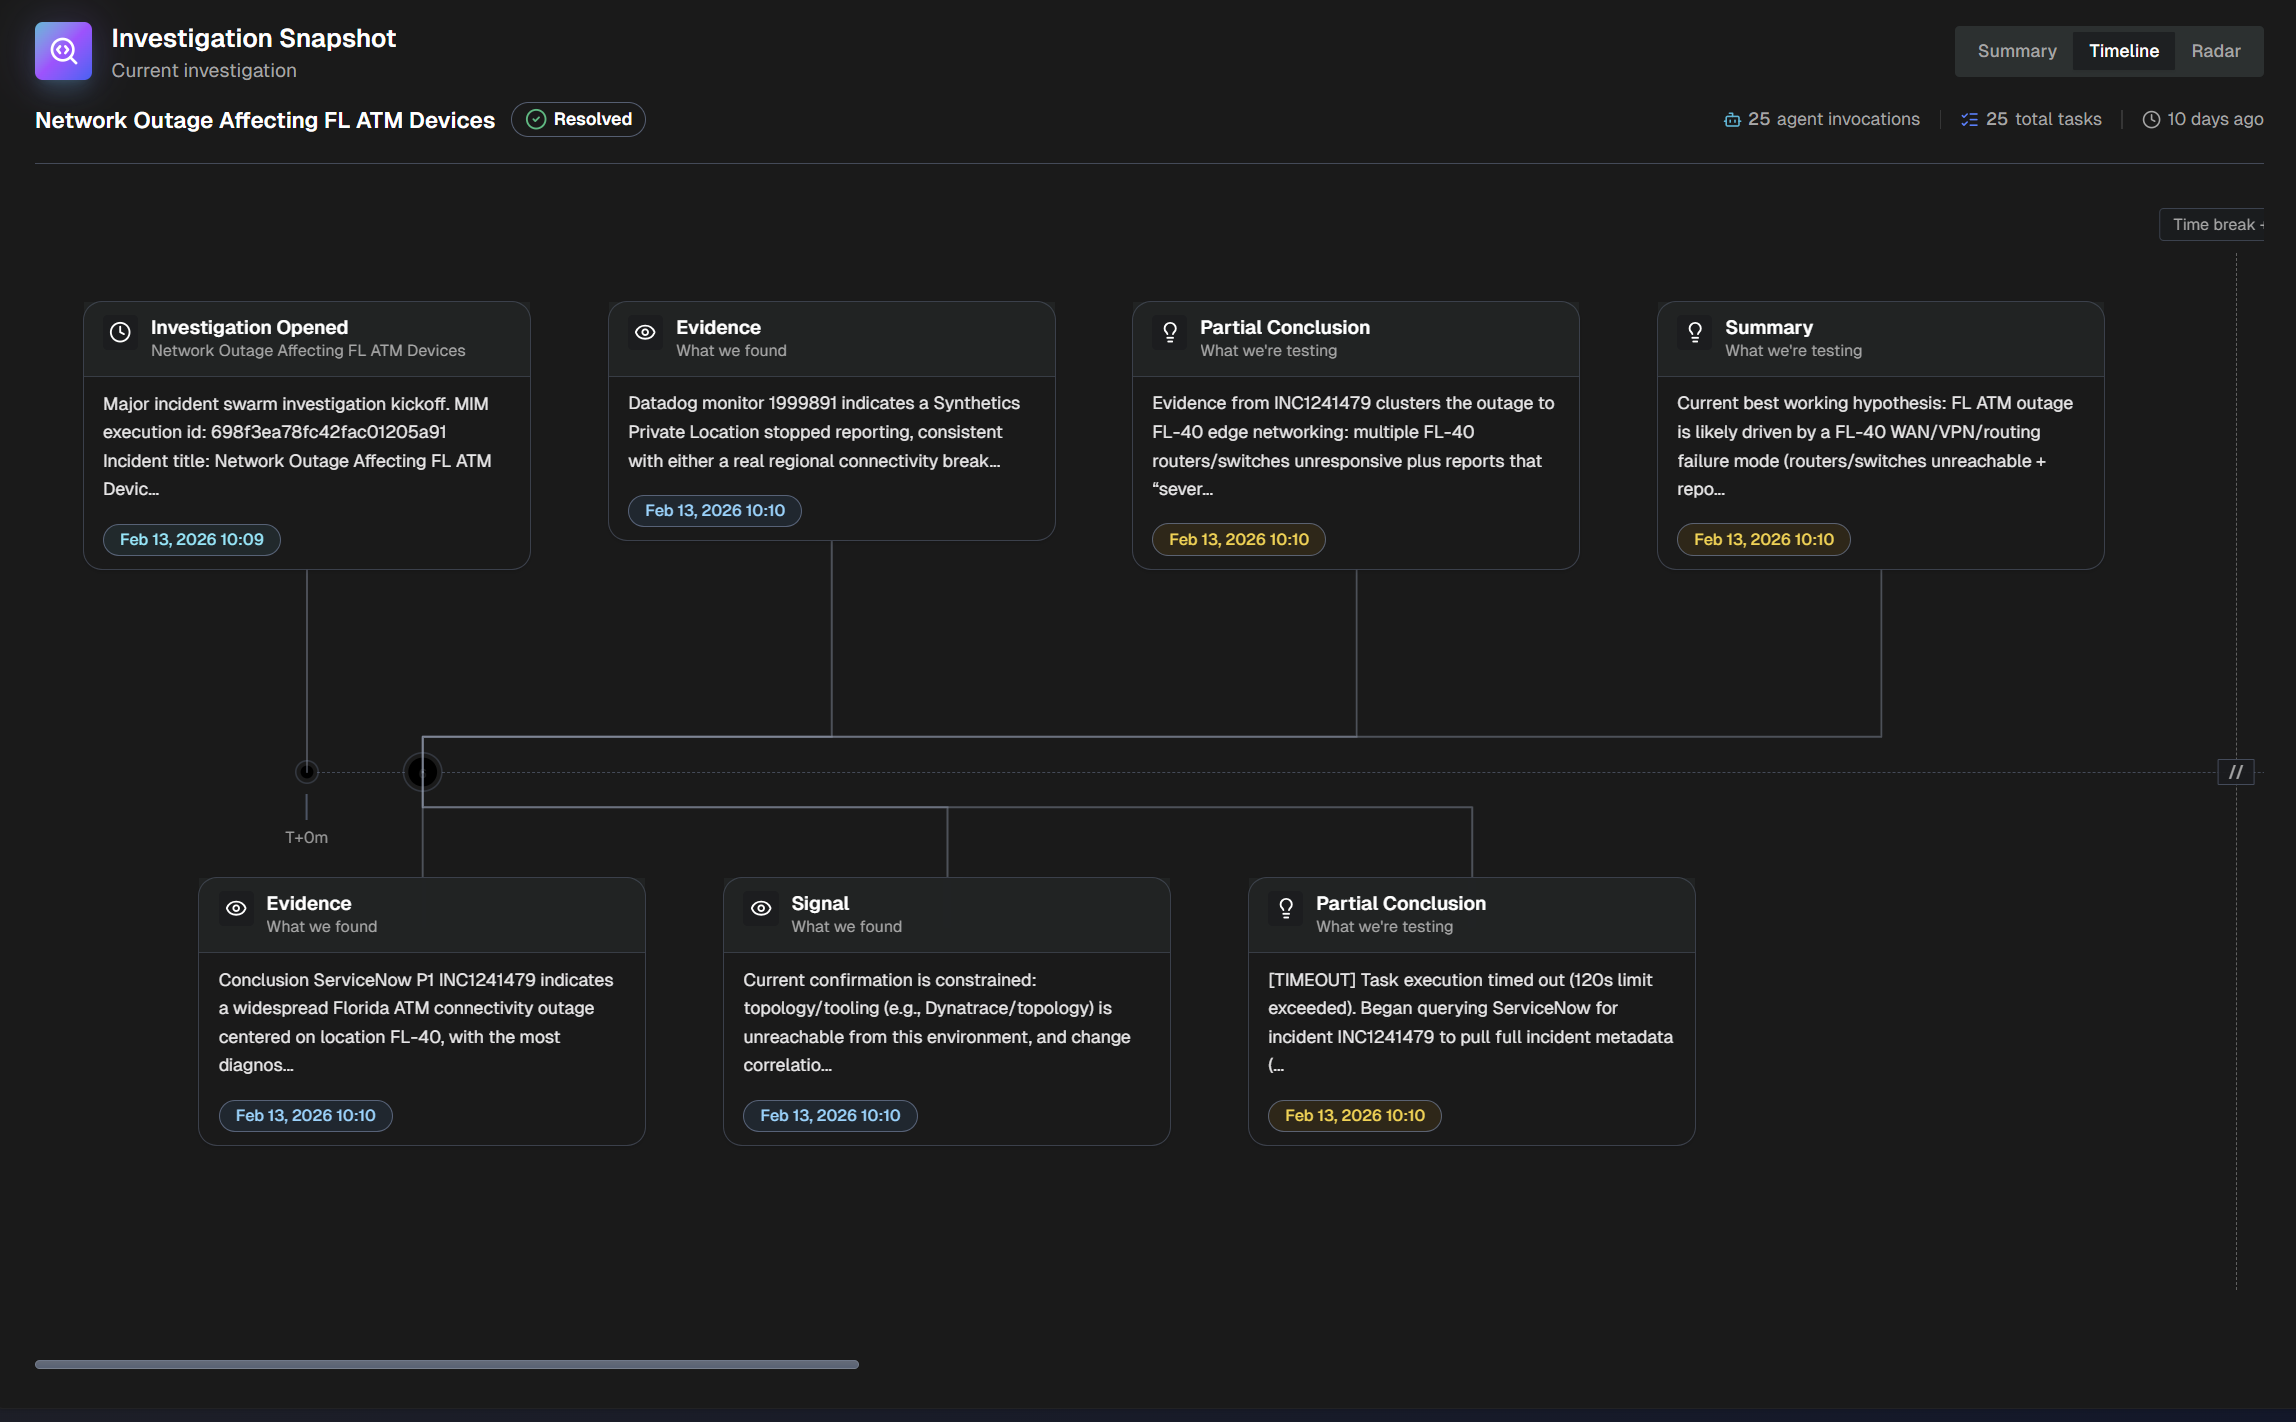
Investigation Snapshot
In the Investigation Snapshot section at the bottom of the page, view details of the swarm investigation at a glance.
The investigation snapshot has 3 views: Summary, Timeline, and Radar.
In the Summary view, the investigation's Key Findings, Working Hypotheses, Agent Invocations, and Decisions & Actions are available.

In the Timeline view, explore an interactive timeline of each action within the investigation.
Scroll left and right in the section to view the entire timeline. Hover over a specific part of the timeline to view the time and date when an action occurred.
In the Radar view, visualize the relationship of all tasks in the investigation.
The outer blue ring shows evidence and signal tasks.
The purple middle ring shows agent invocations.
The yellow middle ring shows working hypotheses for why the incident is occurring.
The purple inner ring shows decisions and conclusions that were reached by the swarm.

Action Templates
In the Action Templates tab, create templates that define specific automated actions agents will use during investigations.
Action templates required
An action must be configured for an agent to perform it. Agents will not perform actions unless a template exists instructing them on what to do.
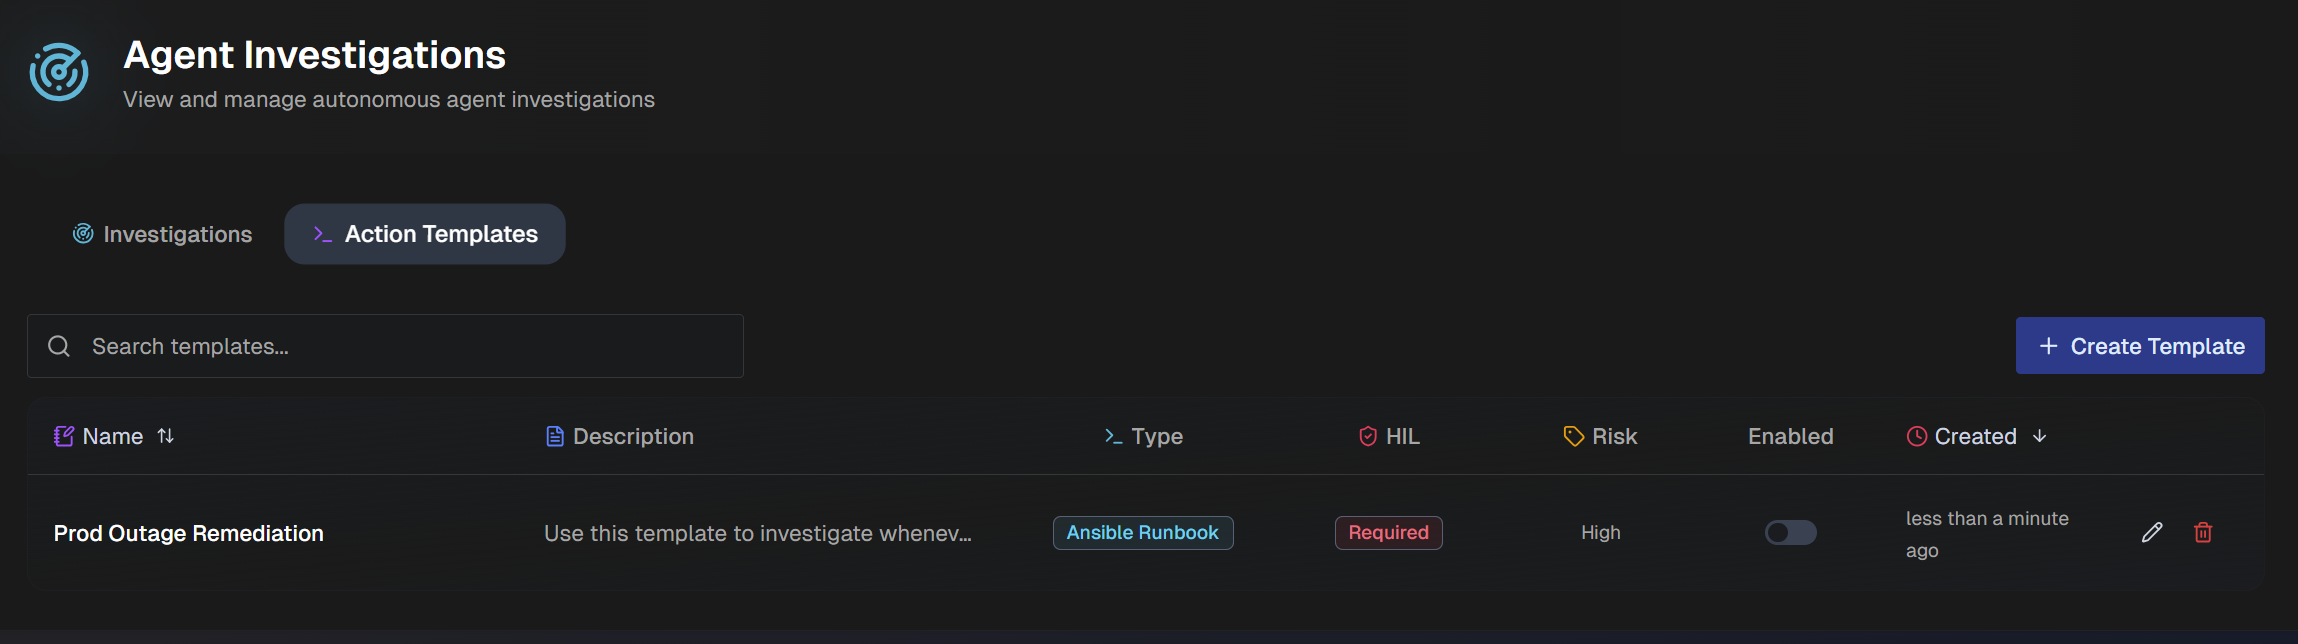
The following information about each template is available in the list:
Name
Description
Type
Human in the Loop (HIL)
Risk
Enabled
Created date
The list can be sorted by Name or Created date. Use the Search bar to find a specific template.
Create an Action Template
To create an action template:
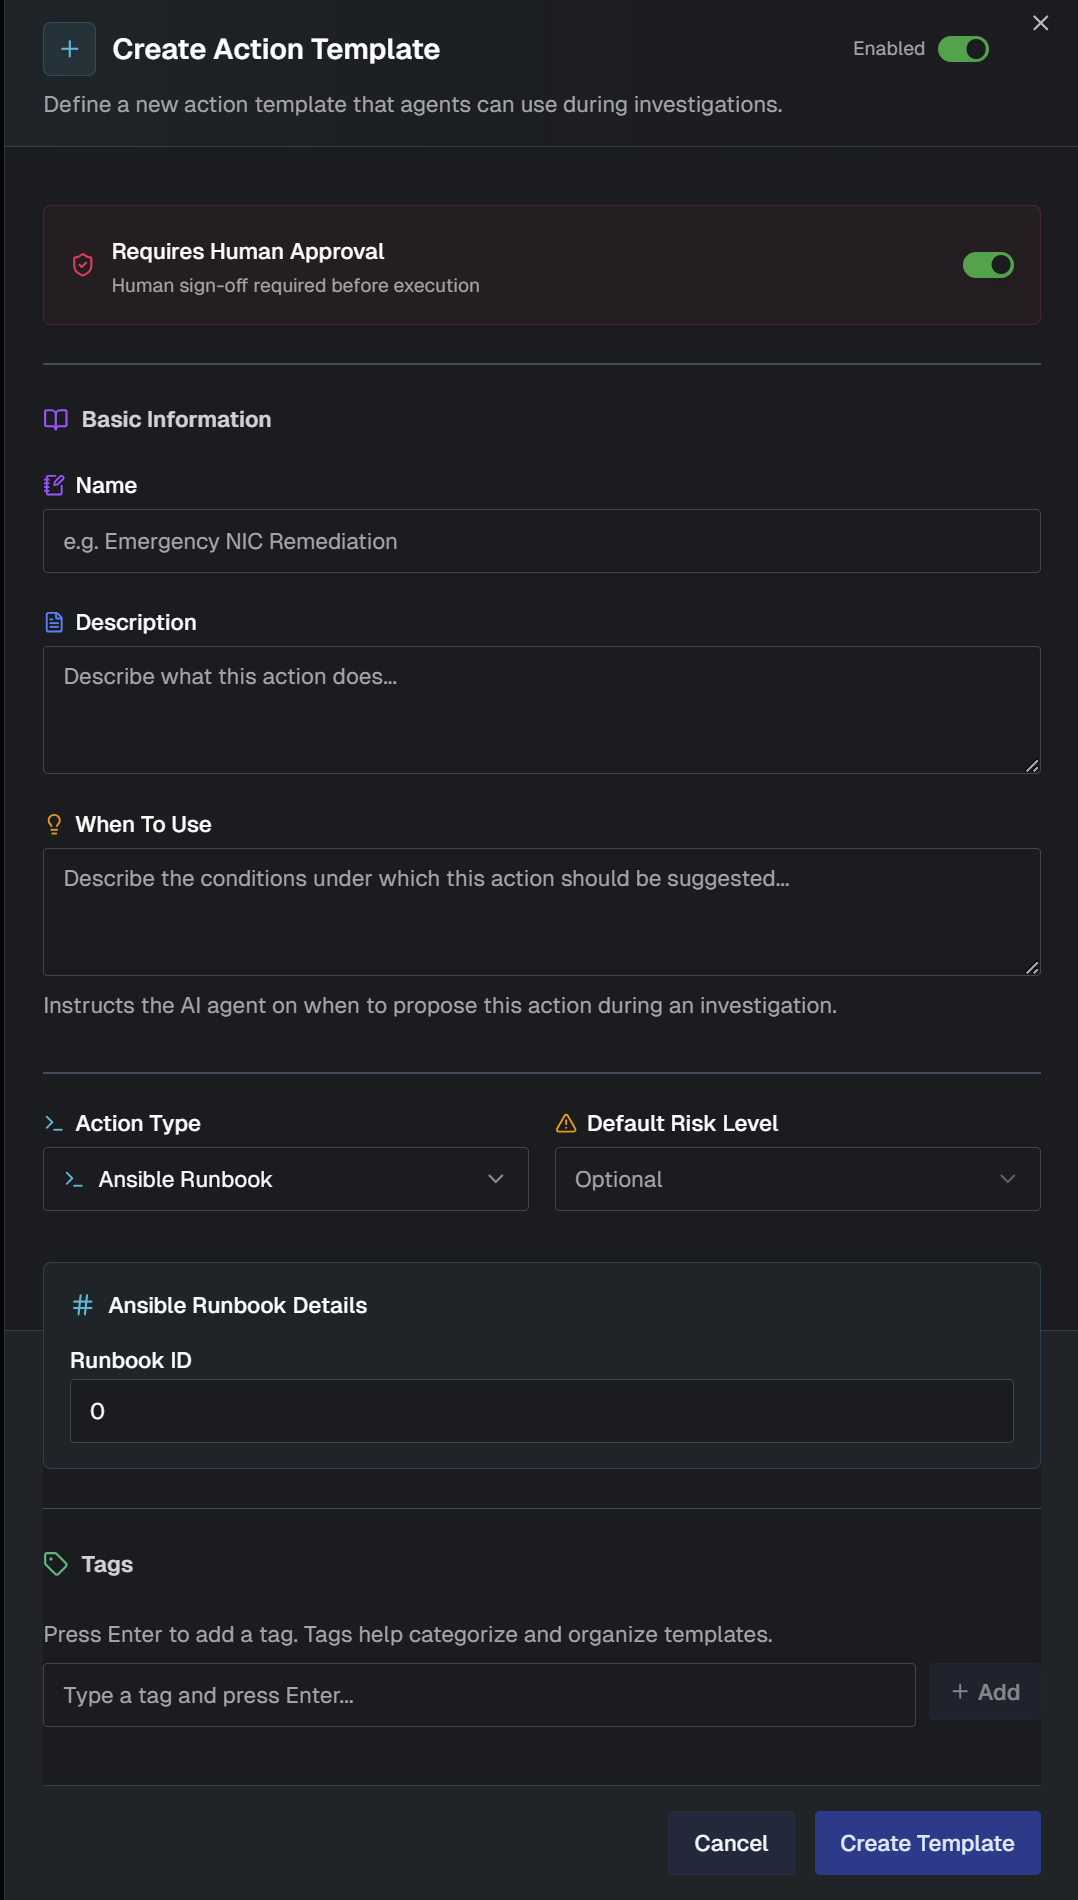
In the Action Templates tab, click + Create Template.
In the Create Action Template window, populate the following fields:
Field
Description
Enabled
Toggle on to enable the template for use. Toggle off to disable it.
Requires Human Approval
Toggle on to require human approval before execution of this action. Toggle off to allow this action to execute without approval.
Name
Descriptive title of the template.
Description
Description of what the action does.
When to Use
Describe when this action should be used. The AI agent uses this field to determine when to use this action during an investigation.
Action Type
Select an action type from the drop-down menu. The following action types are available:
Default Risk Level
Select the risk level associated with running the action.
Ansible Runbook Details
Enter the Ansible Runbook ID.
Tags
Optionally add tags to organize or filter the template list.
Click Create Template.