Sensing and Knowledge (IA and IP)
The Sensing and Knowledge page shows what Biggy knows about your environment and where that knowledge comes from. Use this to see tools and data stores Biggy is connected to, explore the IT Knowledge Graph (ITKG) that links your services, infrastructure, people, and records, review what Biggy has learned from past incidents, and check your organization's data index.
The page is located in the web app at Manage > Knowledge & Data > Sensing & Knowledge.
All counts on the page are specific to your organization's connected data.
Connected systems
The What Biggy is connected to section at the top of the page maps connections to the AI Incident Assistant, which appear in the center of the diagram. Connections are grouped by the role they play.
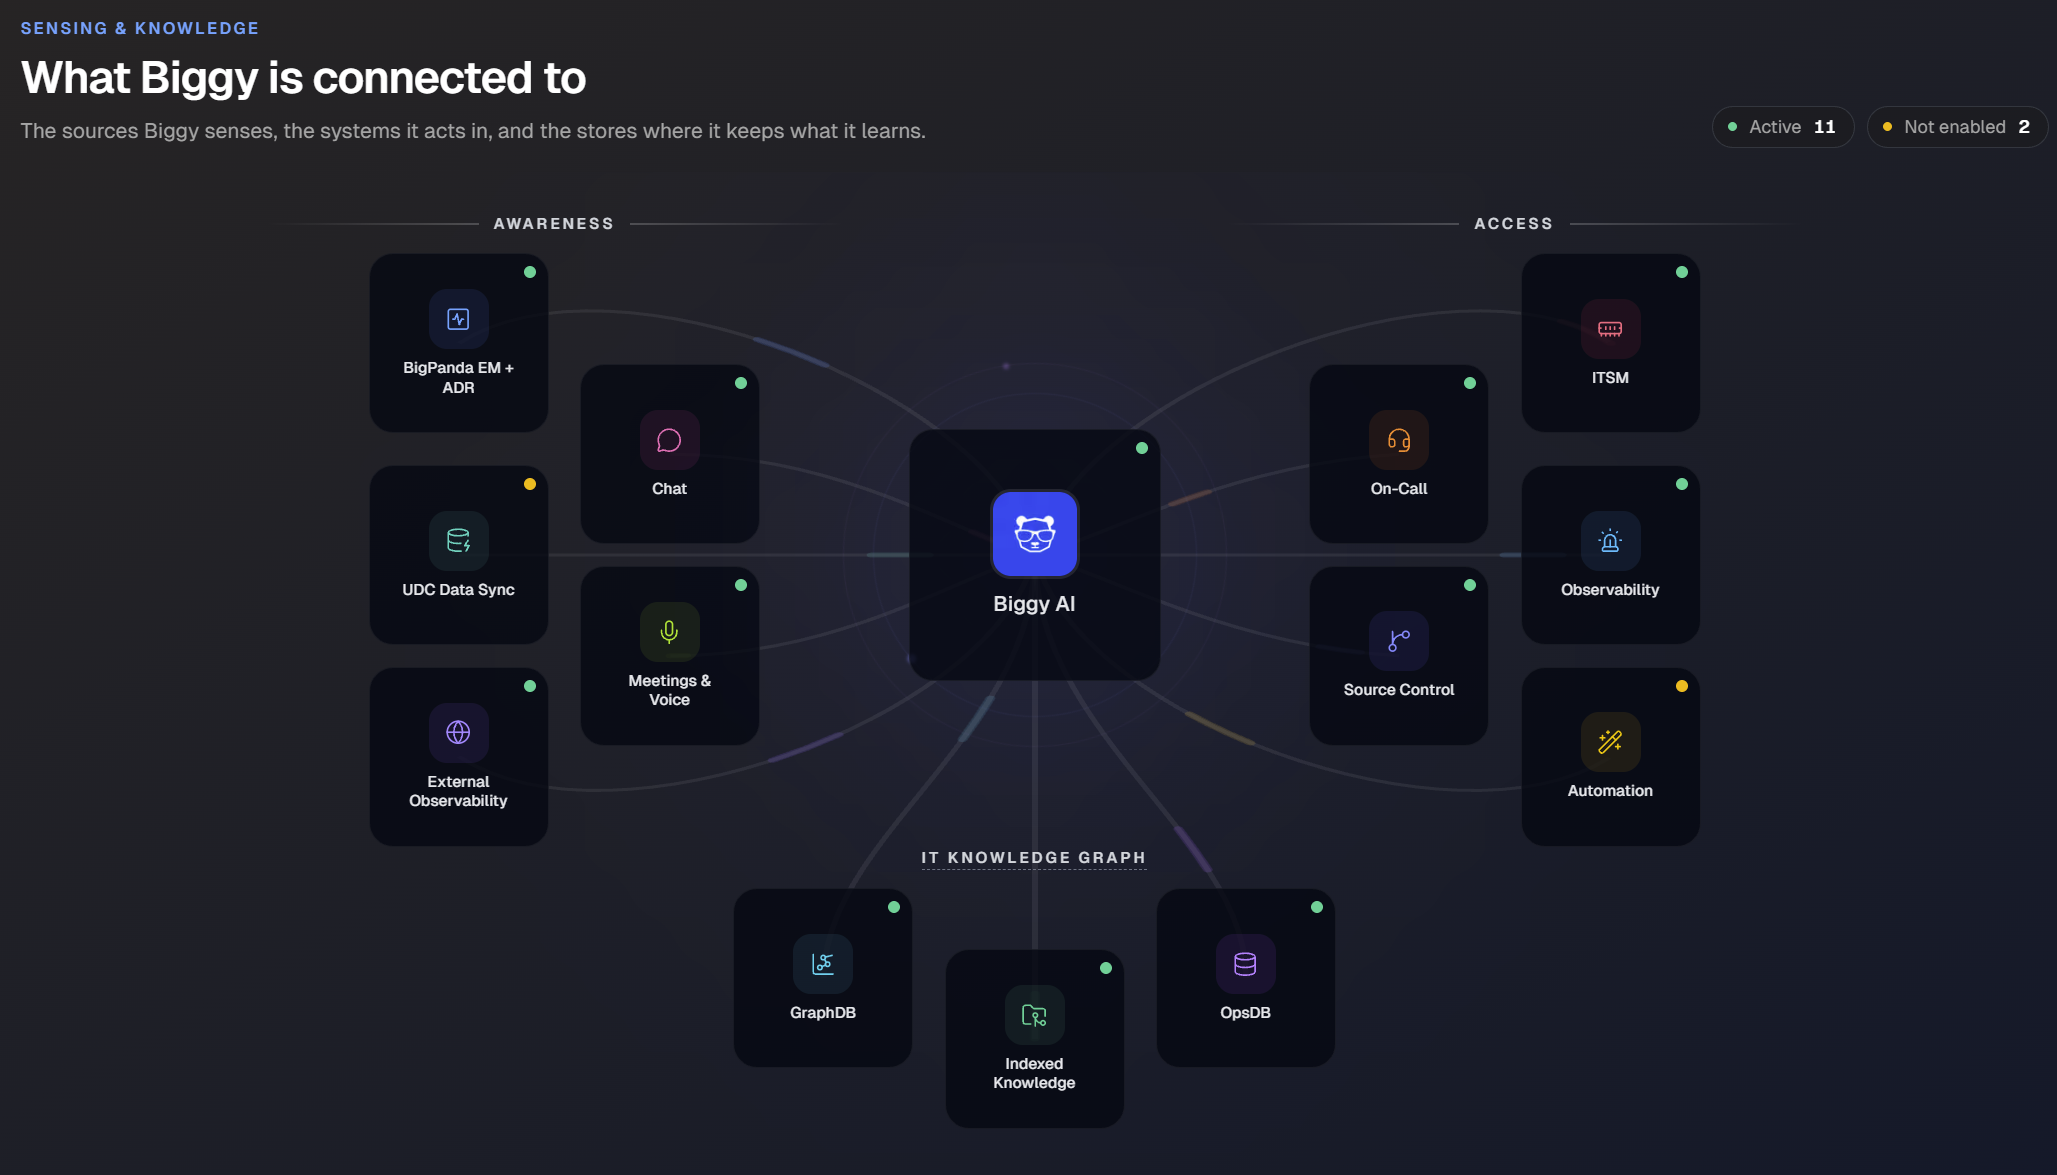
Group | Description | Connections |
|---|---|---|
Awareness | Sources Biggy senses for signals, records, and conversations. | BigPanda EM + ADR, Chat, UDC Data Sync, Meetings & Voice, and External Observability |
Access | Systems Biggy acts in when it investigates an issue or takes the next step. | ITSM, On-Call, Observability, Source Control, and Automation |
IT Knowledge Graph | Stores where Biggy keeps what it indexes and learns. | GraphDB, Indexed Knowledge, and OpsDB |
The colored dot in the upper-right corner of each connection shows its current status. The Active and Not enabled counters show the total number of connections in each status.
Indicator | Status | Description |
|---|---|---|
Green dot | Active | The connection is enabled and Biggy is using it. |
Yellow dot | Not enabled | The connection is available but is not enabled for your organization. |
Hover over a connection to view additional information about the data source.
IT Knowledge Graph
The IT Knowledge Graph section displays the ITKG as an interactive graph with three views of the same data. Summary stats across the top of the section show the total number of nodes, relationships, layers, entity types, and sources in your organization's graph.
At the top of the canvas, select World, Strata, or Memory to switch views. In the upper-right corner of the canvas, click the Expand icon to open the graph in full screen.
Every view organizes the graph into the same layers: Observability, ITSM, Services, Infrastructure, People, Knowledge, and Incident Assistant memory.
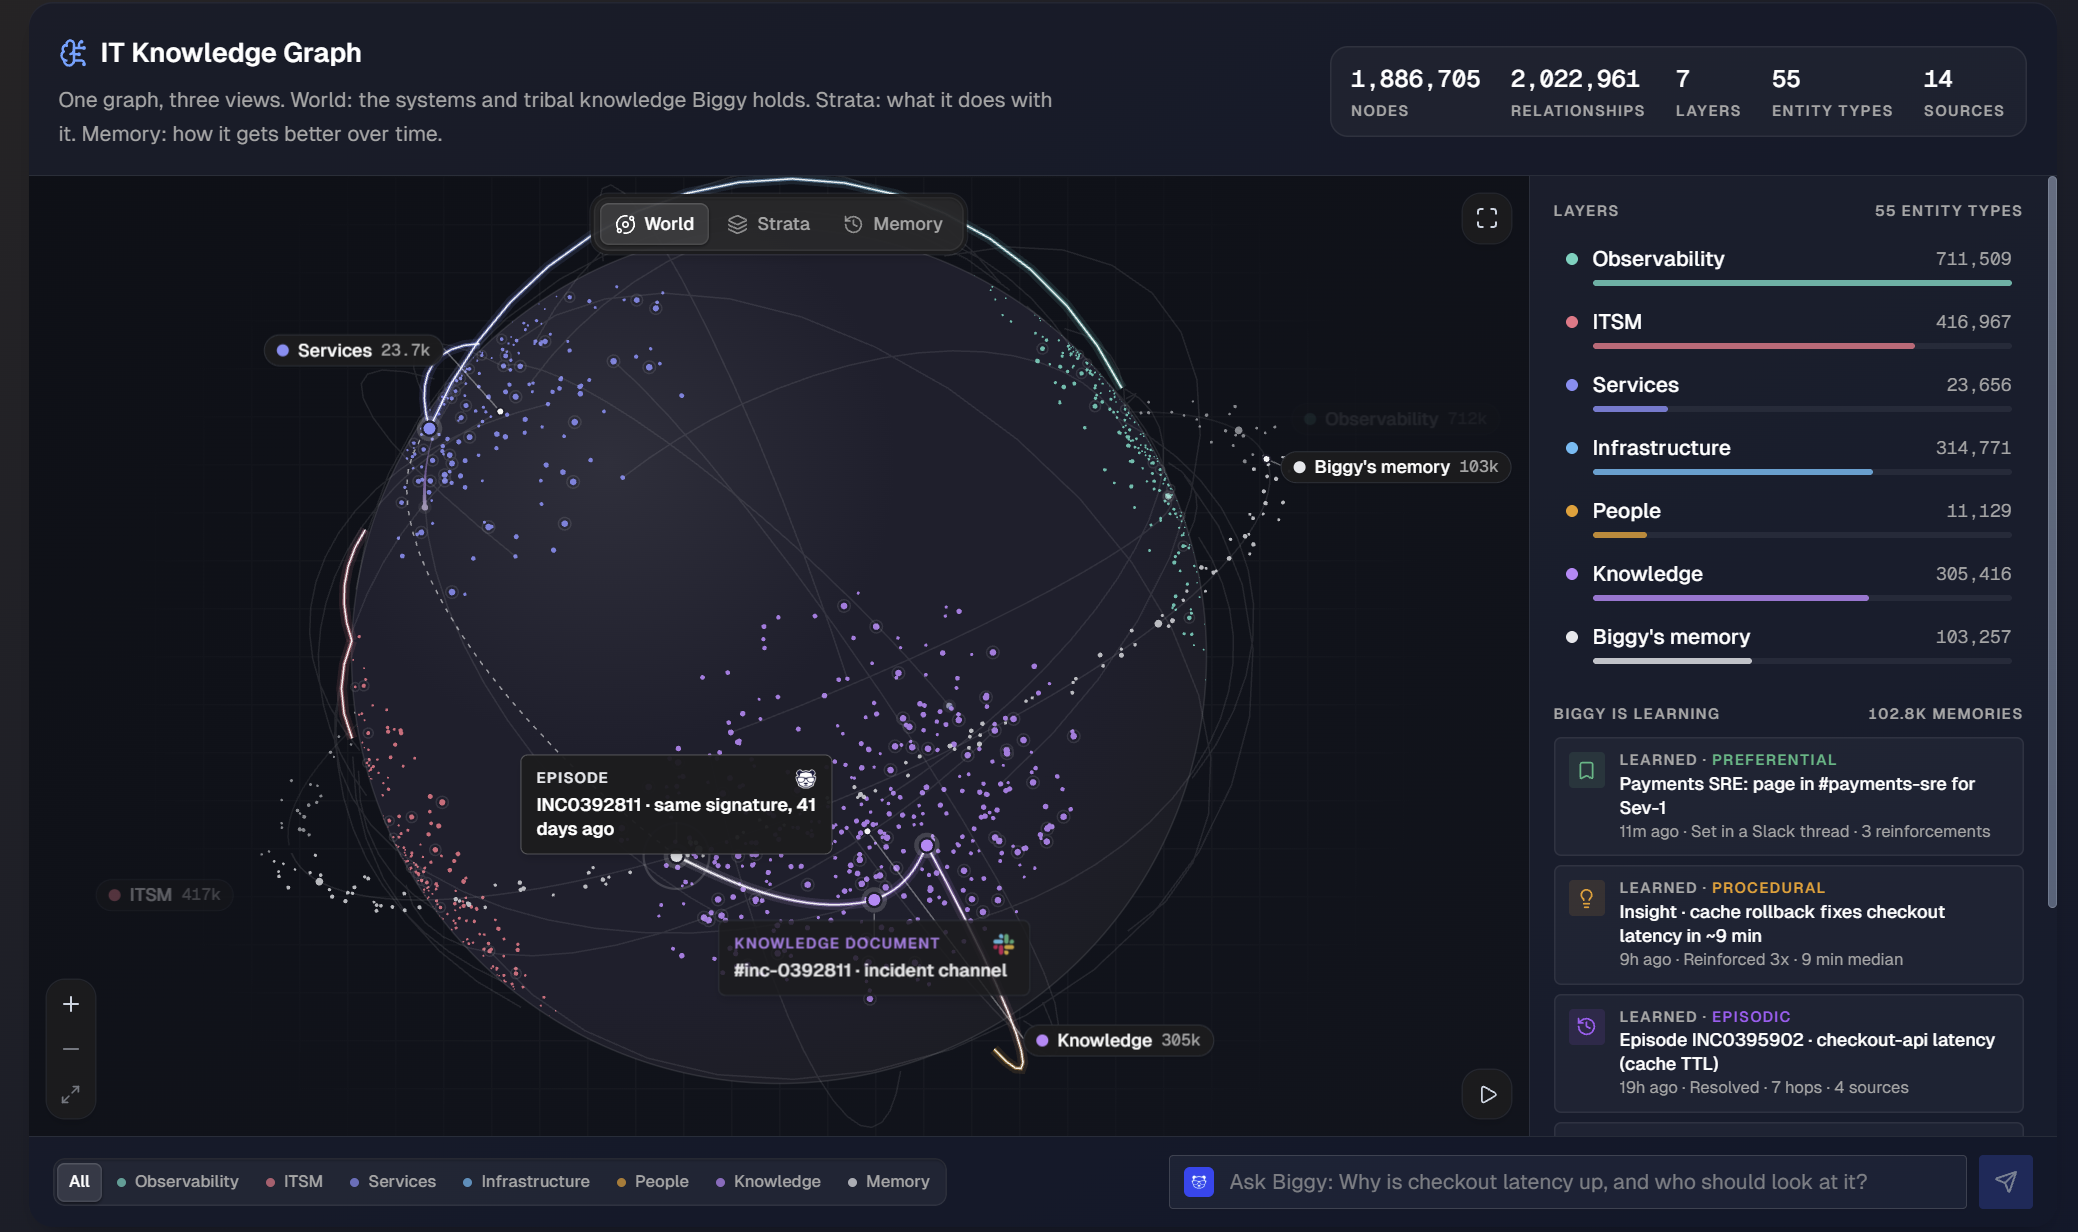
The World view shows the systems and tribal knowledge the Incident Assistant holds, with nodes clustered by layer on a 3D sphere.
Area | Description |
|---|---|
Graph canvas | Displays each node as a point colored by its layer. A label on each cluster shows the layer name and entity count. Highlighted paths and cards show how the Incident Assistant connects entities across layers, for example, an incident linked to a past episode with the same signature. |
Graph controls | In the lower-left corner of the canvas, click the + (Zoom In) and - (Zoom Out) icons to change the zoom level, or click the Fit icon to reset the view. In the lower-right corner of the canvas, click the Play icon to animate the graph. |
Layer filter | Below the canvas, select All or a single layer to filter the nodes shown in the graph. Options include Observability, ITSM, Services, Infrastructure, People, Knowledge, and Memory. |
Ask Biggy field | To the right of the layer filter, enter a question about your environment and click the Send icon. For example, enter |
Layers panel | On the right-hand side of the section, lists each layer with its entity count and a bar that shows its relative size. The total number of entity types appears at the top of the panel. Click a layer to filter the world view. |
Biggy is learning feed | Below the Layers panel, lists recent memories the Incident Assistant has created, along with the total number of memories. Each entry shows the memory type, a short summary of what Biggy learned, when Biggy learned it, and supporting details. For example how many times the memory was reinforced, how many sources it draws on, or its confidence score. See the memory types in the Biggy stages and memory section. |
Sources | At the bottom of the panel, shows an icon for each connected source and the total number of connected sources. |
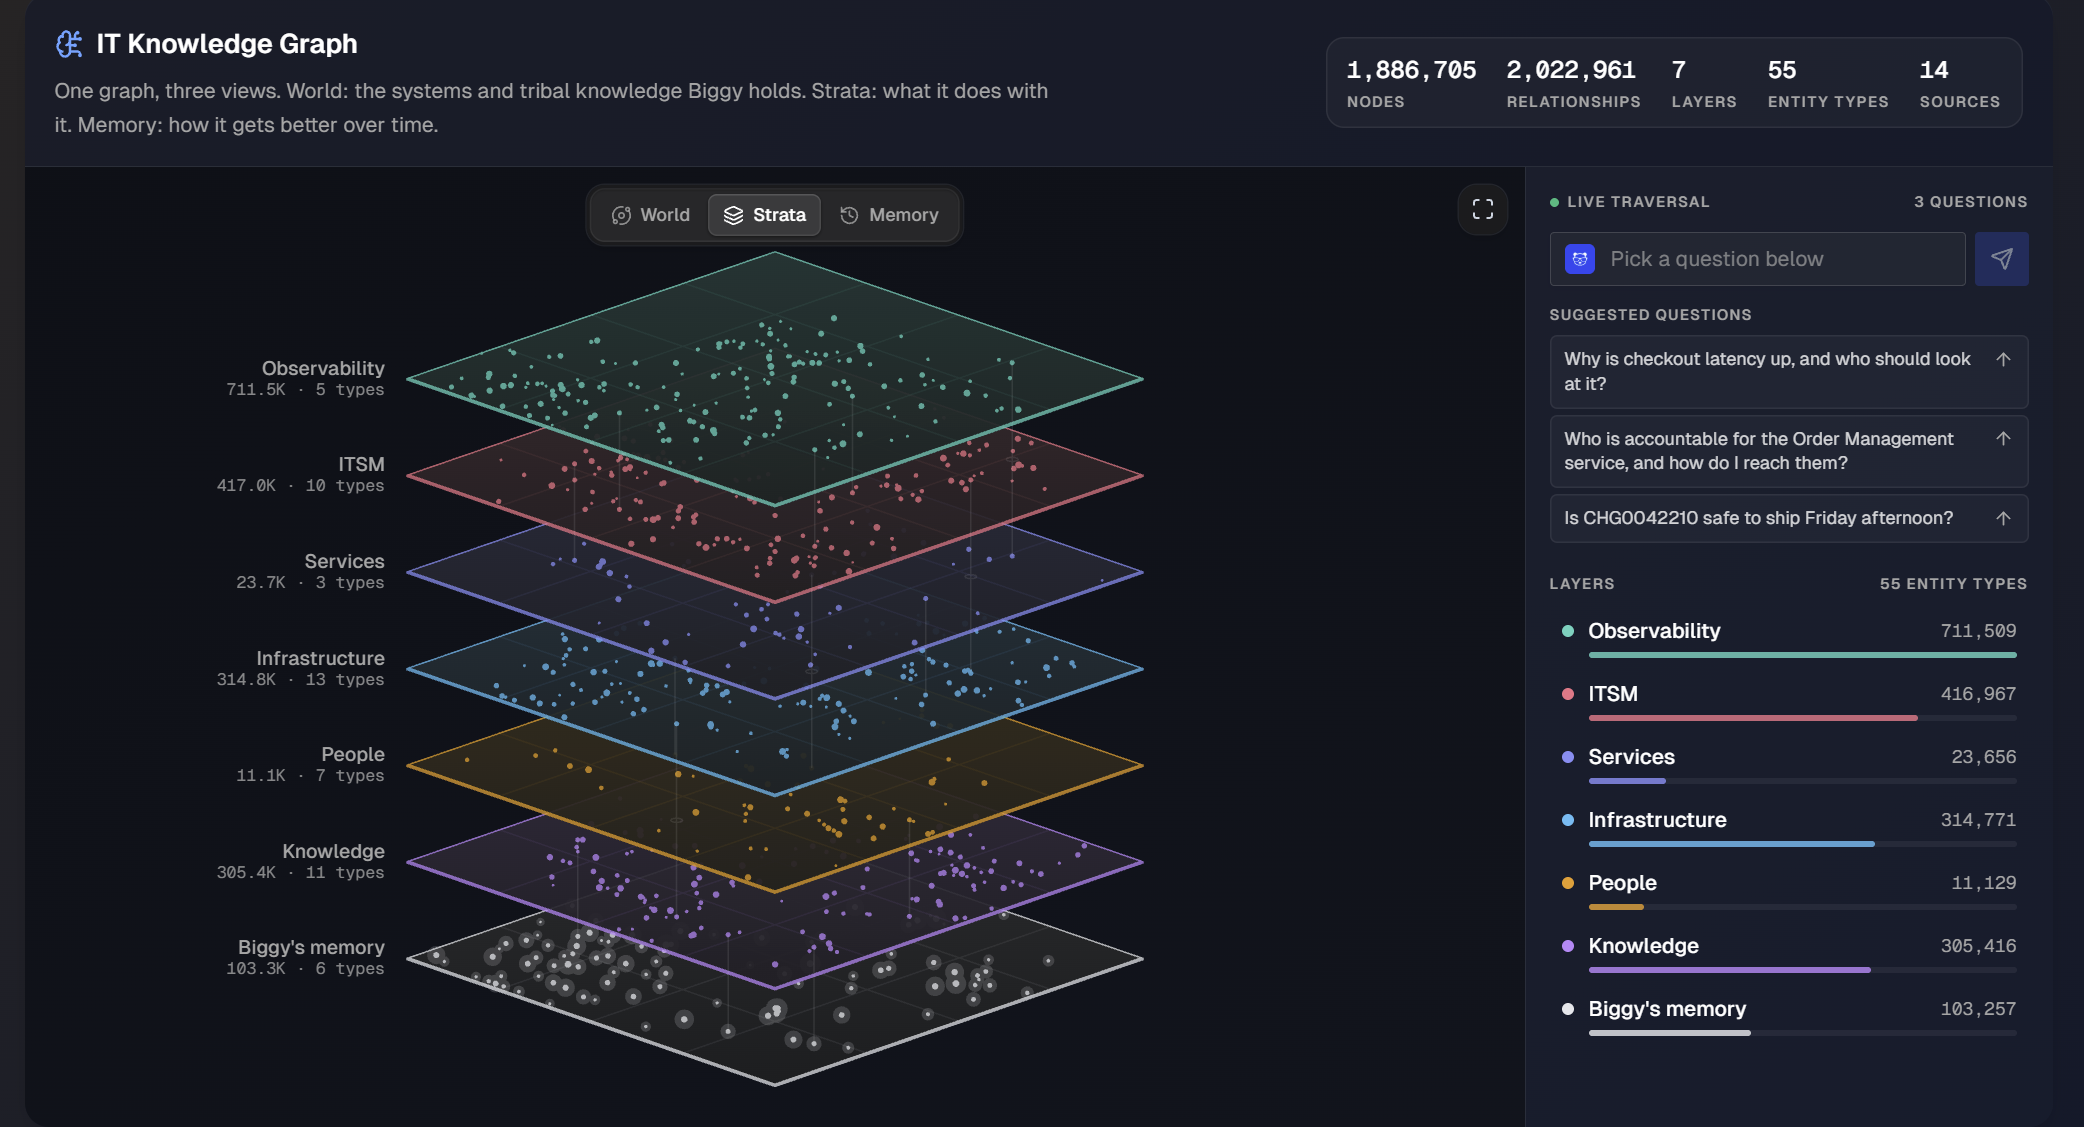
The Strata view shows what Incident Assistant does with what it knows. Each layer appears as a stacked plane, from Observability at the top to Incident Assistant memory at the bottom. When animated, you can see how Incident Assistant works across layers to answer a question.
Area | Description |
|---|---|
Layer planes | Each plane shows the nodes in one layer. The label next to each plane shows the layer name, entity count, and number of entity types. Lines between planes show relationships that connect entities in different layers. |
Entity type labels | When you select a layer, its plane is highlighted and labels show its largest entity types and their counts, for example Alert, Event, and Observation in the Observability layer. |
Live traversal | At the top of the panel, select a question from the Suggested questions list and click the Send icon to watch Incident Assistant traverse the graph layers to answer it. The count in the panel header shows how many suggested questions are available. |
Layers panel | Below the Live traversal area, lists each layer with its entity count and a bar that shows its relative size. Select a layer to expand the list of entity types in that layer, with the count for each type. |
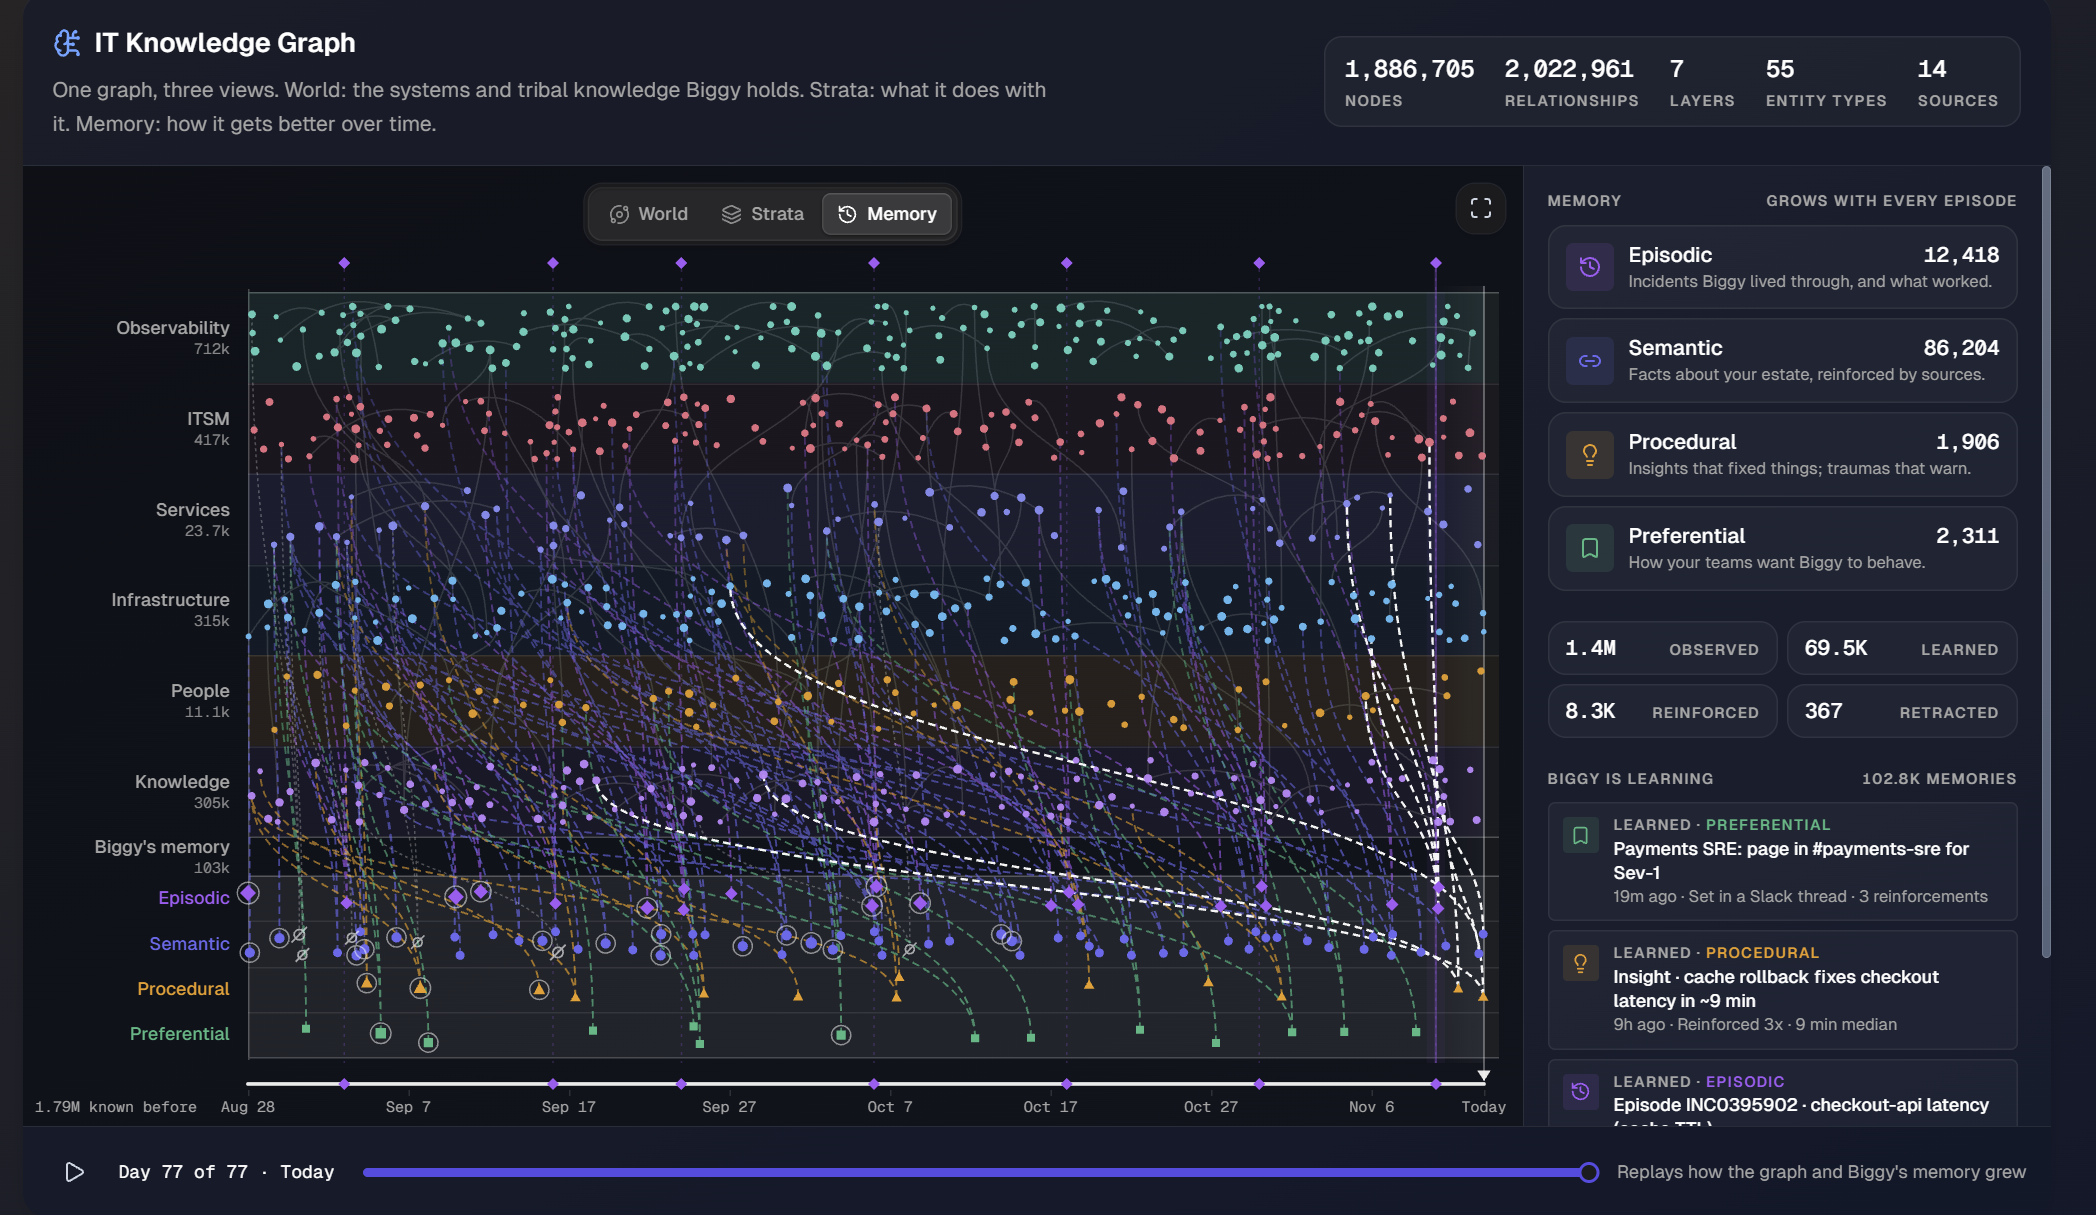
The Memory view shows how Biggy improves over time. It plots activity in each layer over time and shows how Incident Assistant turns that activity into memories.
Area | Description |
|---|---|
Memory timeline | Each row represents a layer, and Incident Assistant's memory is split into separate rows for Episodic, Semantic, Procedural, and Preferential memory. Dots show nodes in each layer over time, and dashed lines trace how activity in the upper layers becomes new memories. Symbols on the memory rows mark individual memories, including memories that Biggy later reinforced or retracted. |
Timeline axis | Along the bottom of the chart, dates mark the timeline, ending at Today. On the left of the axis, the known before count shows how many entities were already in the graph when the timeline begins. Diamond markers along the top and bottom of the chart mark episodes. |
Playback bar | Below the chart, click the Play icon to replay how the graph and Incident Assistant's memory grew. Drag the slider to move to a specific day. Next to the Play icon, the label shows the current day and the total number of days in the timeline, for example |
Memory panel | On the right-hand side of the section, lists the four memory types and the number of memories of each type. See the memory types in the Biggy stages and memory section. |
Memory counters | Below the memory types, the Observed, Learned, Reinforced, and Retracted counters show how many items Incident Assistant has observed, how many memories it has learned, how many memories later interactions reinforced, and how many memories were retracted. |
Biggy is learning feed | Below the counters, lists recent memories Incident Assistant has created, as in the World view. |
Biggy stages and memory
Below the graph, the How Biggy works section explains how Incident Assistant turns connected data into answers. Each stage card shows counts for your organization.
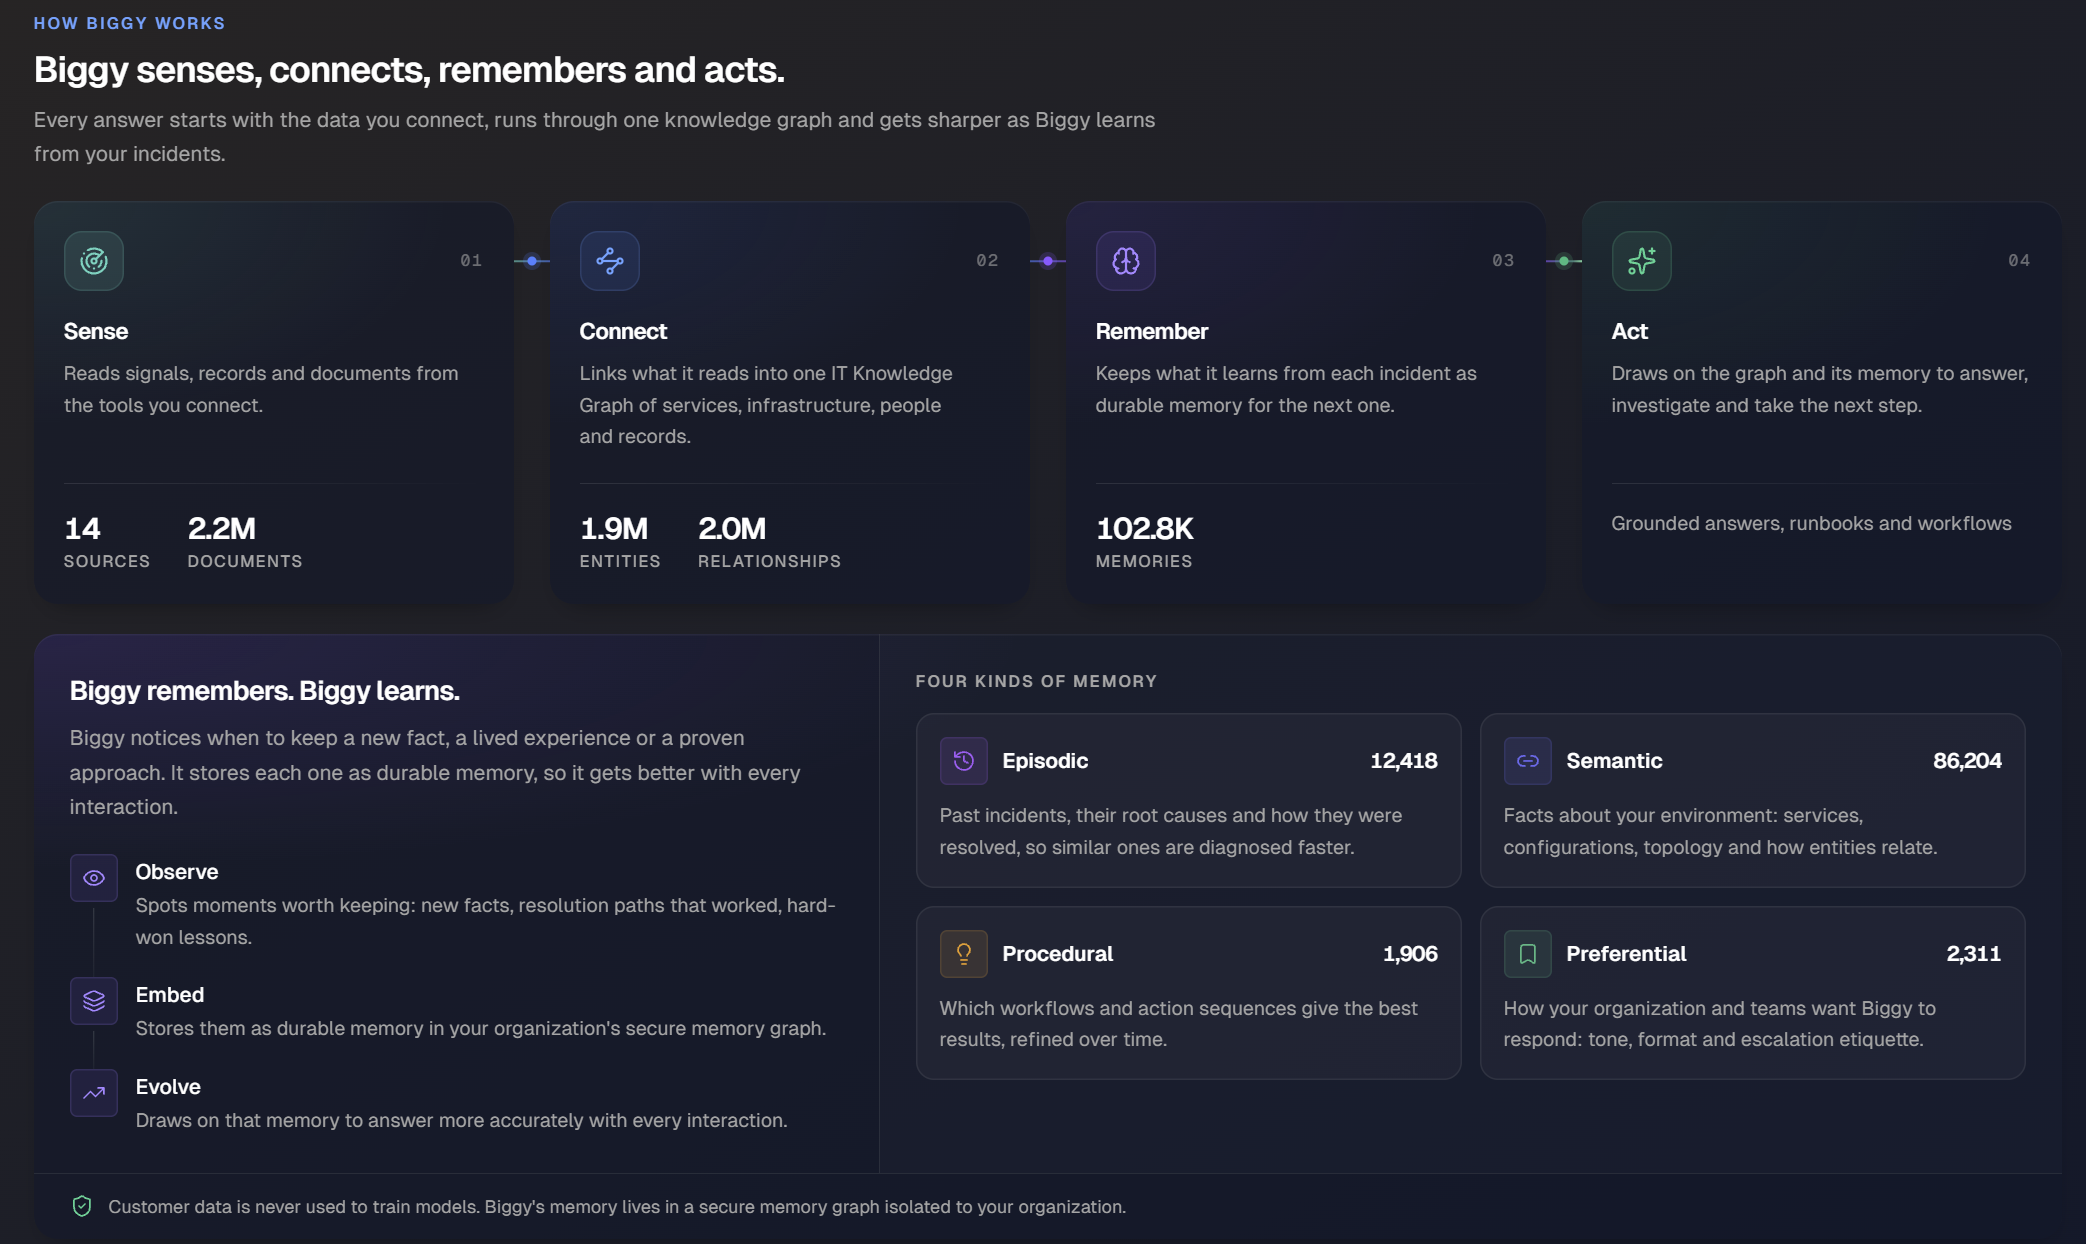
Stage | What Biggy does | Metrics shown |
|---|---|---|
01 Sense | Reads signals, records, and documents from the tools you connect. | Sources and Documents |
02 Connect | Links what it reads into one ITKG of services, infrastructure, people, and records. | Entities and Relationships |
03 Remember | Keeps what it learns from each incident as durable memory for the next incident. | Memories |
04 Act | Draws on the graph and its memory to answer questions, investigate, and take the next step. | None. The card lists the results Incident Assistant produces: grounded answers, runbooks, and workflows. |
A panel below the stage cards shows how Incident Assistant builds memory. Incident Assistant recognizes when to keep a new fact, a lived experience, or a proven approach, and stores each one as durable memory so it improves with every interaction.
Observe: Spots moments worth keeping, such as new facts, resolution paths that worked, and hard-won lessons.
Embed: Stores each memory in your organization's secure memory graph.
Evolve: Draws on stored memory to answer more accurately with every interaction.
Incident Assistant stores four kinds of memory. Each memory type card shows the number of memories of that type.
Memory type | Description |
|---|---|
Episodic | Past incidents, their root causes, and how they were resolved, so Incident Assistant can diagnose similar incidents faster. |
Semantic | Facts about your environment, including services, configurations, topology, and how entities relate to each other. Your connected sources reinforce these facts over time. |
Procedural | Workflows and action sequences that give the best results, refined over time. Procedural memory also includes warnings from approaches that caused problems in the past. |
Preferential | How your organization and teams want Biggy to respond, including tone, format, and escalation etiquette. |
Data privacy
BigPanda never uses customer data to train models. Incident Assistant's memory lives in a secure memory graph that is isolated to your organization.
Indexed data
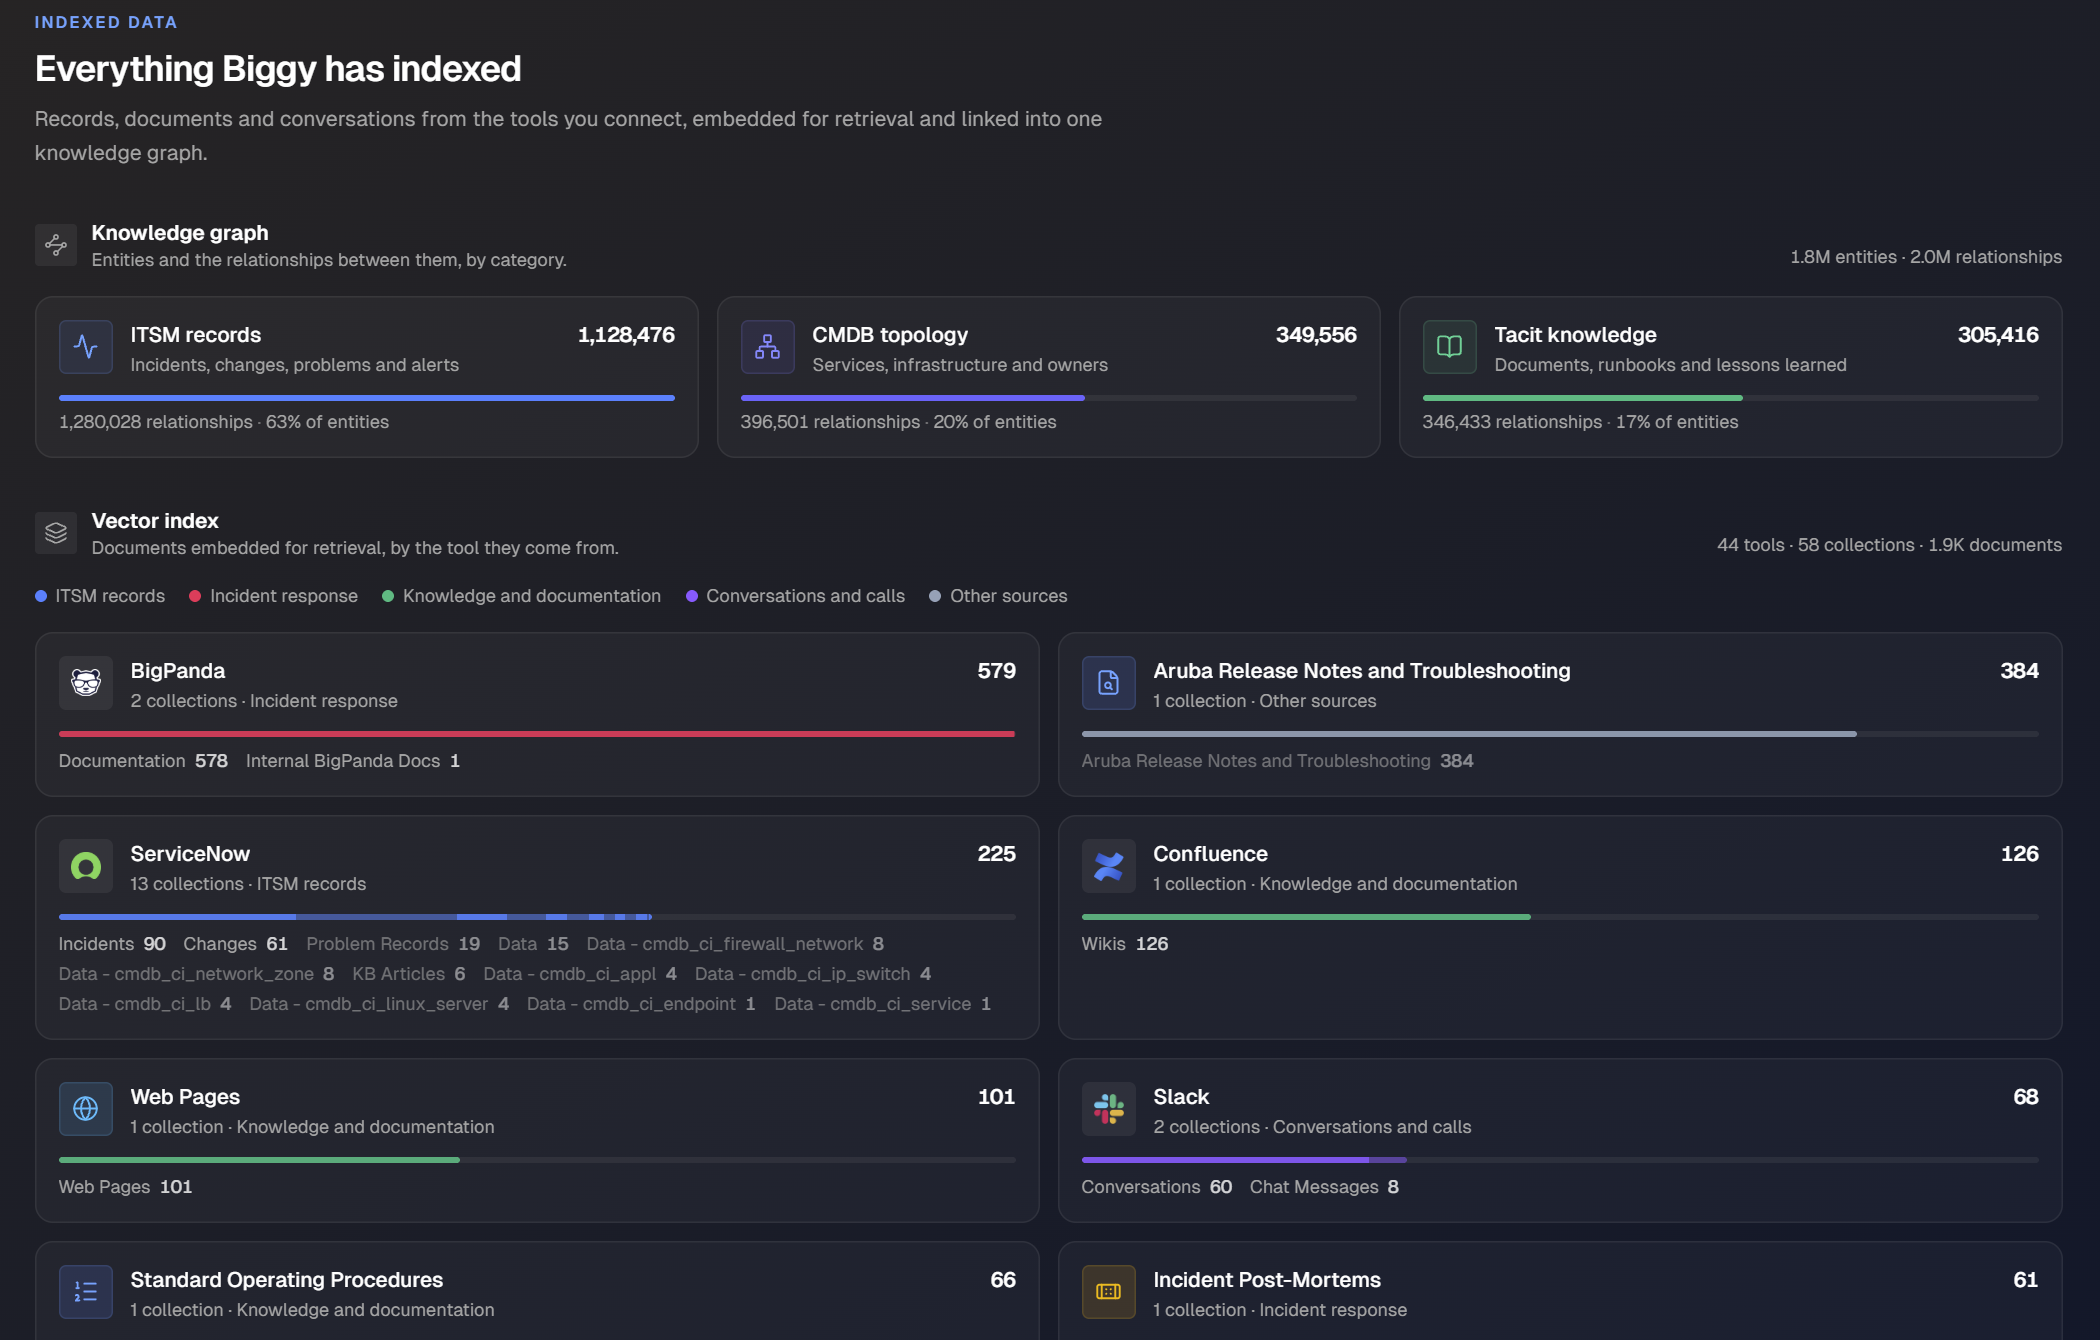
The Everything Biggy has indexed section shows the records, documents, and conversations Incident Assistant has collected from the tools you connect.
The section has two parts: the Knowledge Graph, which links entities and the relationships between them, and the Vector Index, which embeds documents so Biggy can retrieve them.
Area | Description |
|---|---|
Knowledge graph summary | The total number of entities and relationships in the knowledge graph. |
Knowledge graph categories | One card for each entity category. Each card shows the entity count, the number of relationships, and the category's percentage of all entities. Categories include ITSM records (incidents, changes, problems, and alerts), CMDB topology (services, infrastructure, and owners from your configuration management database (CMDB)), and Tacit knowledge (documents, runbooks, and lessons learned). |
Vector index summary | The total number of tools, collections, and documents in the vector index. |
Category legend | The color that identifies each source category: blue for ITSM records, red for Incident response, green for Knowledge and documentation, purple for Conversations and calls, and gray for Other sources. |
Source cards | One card for each tool or source, sorted from the highest document count to the lowest. Each card shows the source name, the number of collections, the source category, the total number of documents, a bar in the category color, and the number of documents in each collection. |