External Observability (IA)
Monitor external events that may affect your operations with External Observability.
External Observability plots active events on an interactive map so you can see where events are happening. Track cloud and SaaS outages, power outages, severe weather, and natural disasters for the regions your organization operates in.
The page is available in the web app at Operate > Incidents > External Observability.
For a full list of the providers, regions, and event types that are checked, see the External Observability Sources documentation.
Key Features
See the number of active, recent, and currently visible external events at a glance.
Search events by title, service, source, or location.
Turn map layers on and off to show markers, affected areas, clusters, heatmaps, and more.
Open the External Observability page
In the left navigation pane, go to Operate > Incidents > External Observability.
The page header shows the event summary. Below the header, the Filters panel and event list appear on the left side of the page, and the map appears on the right.
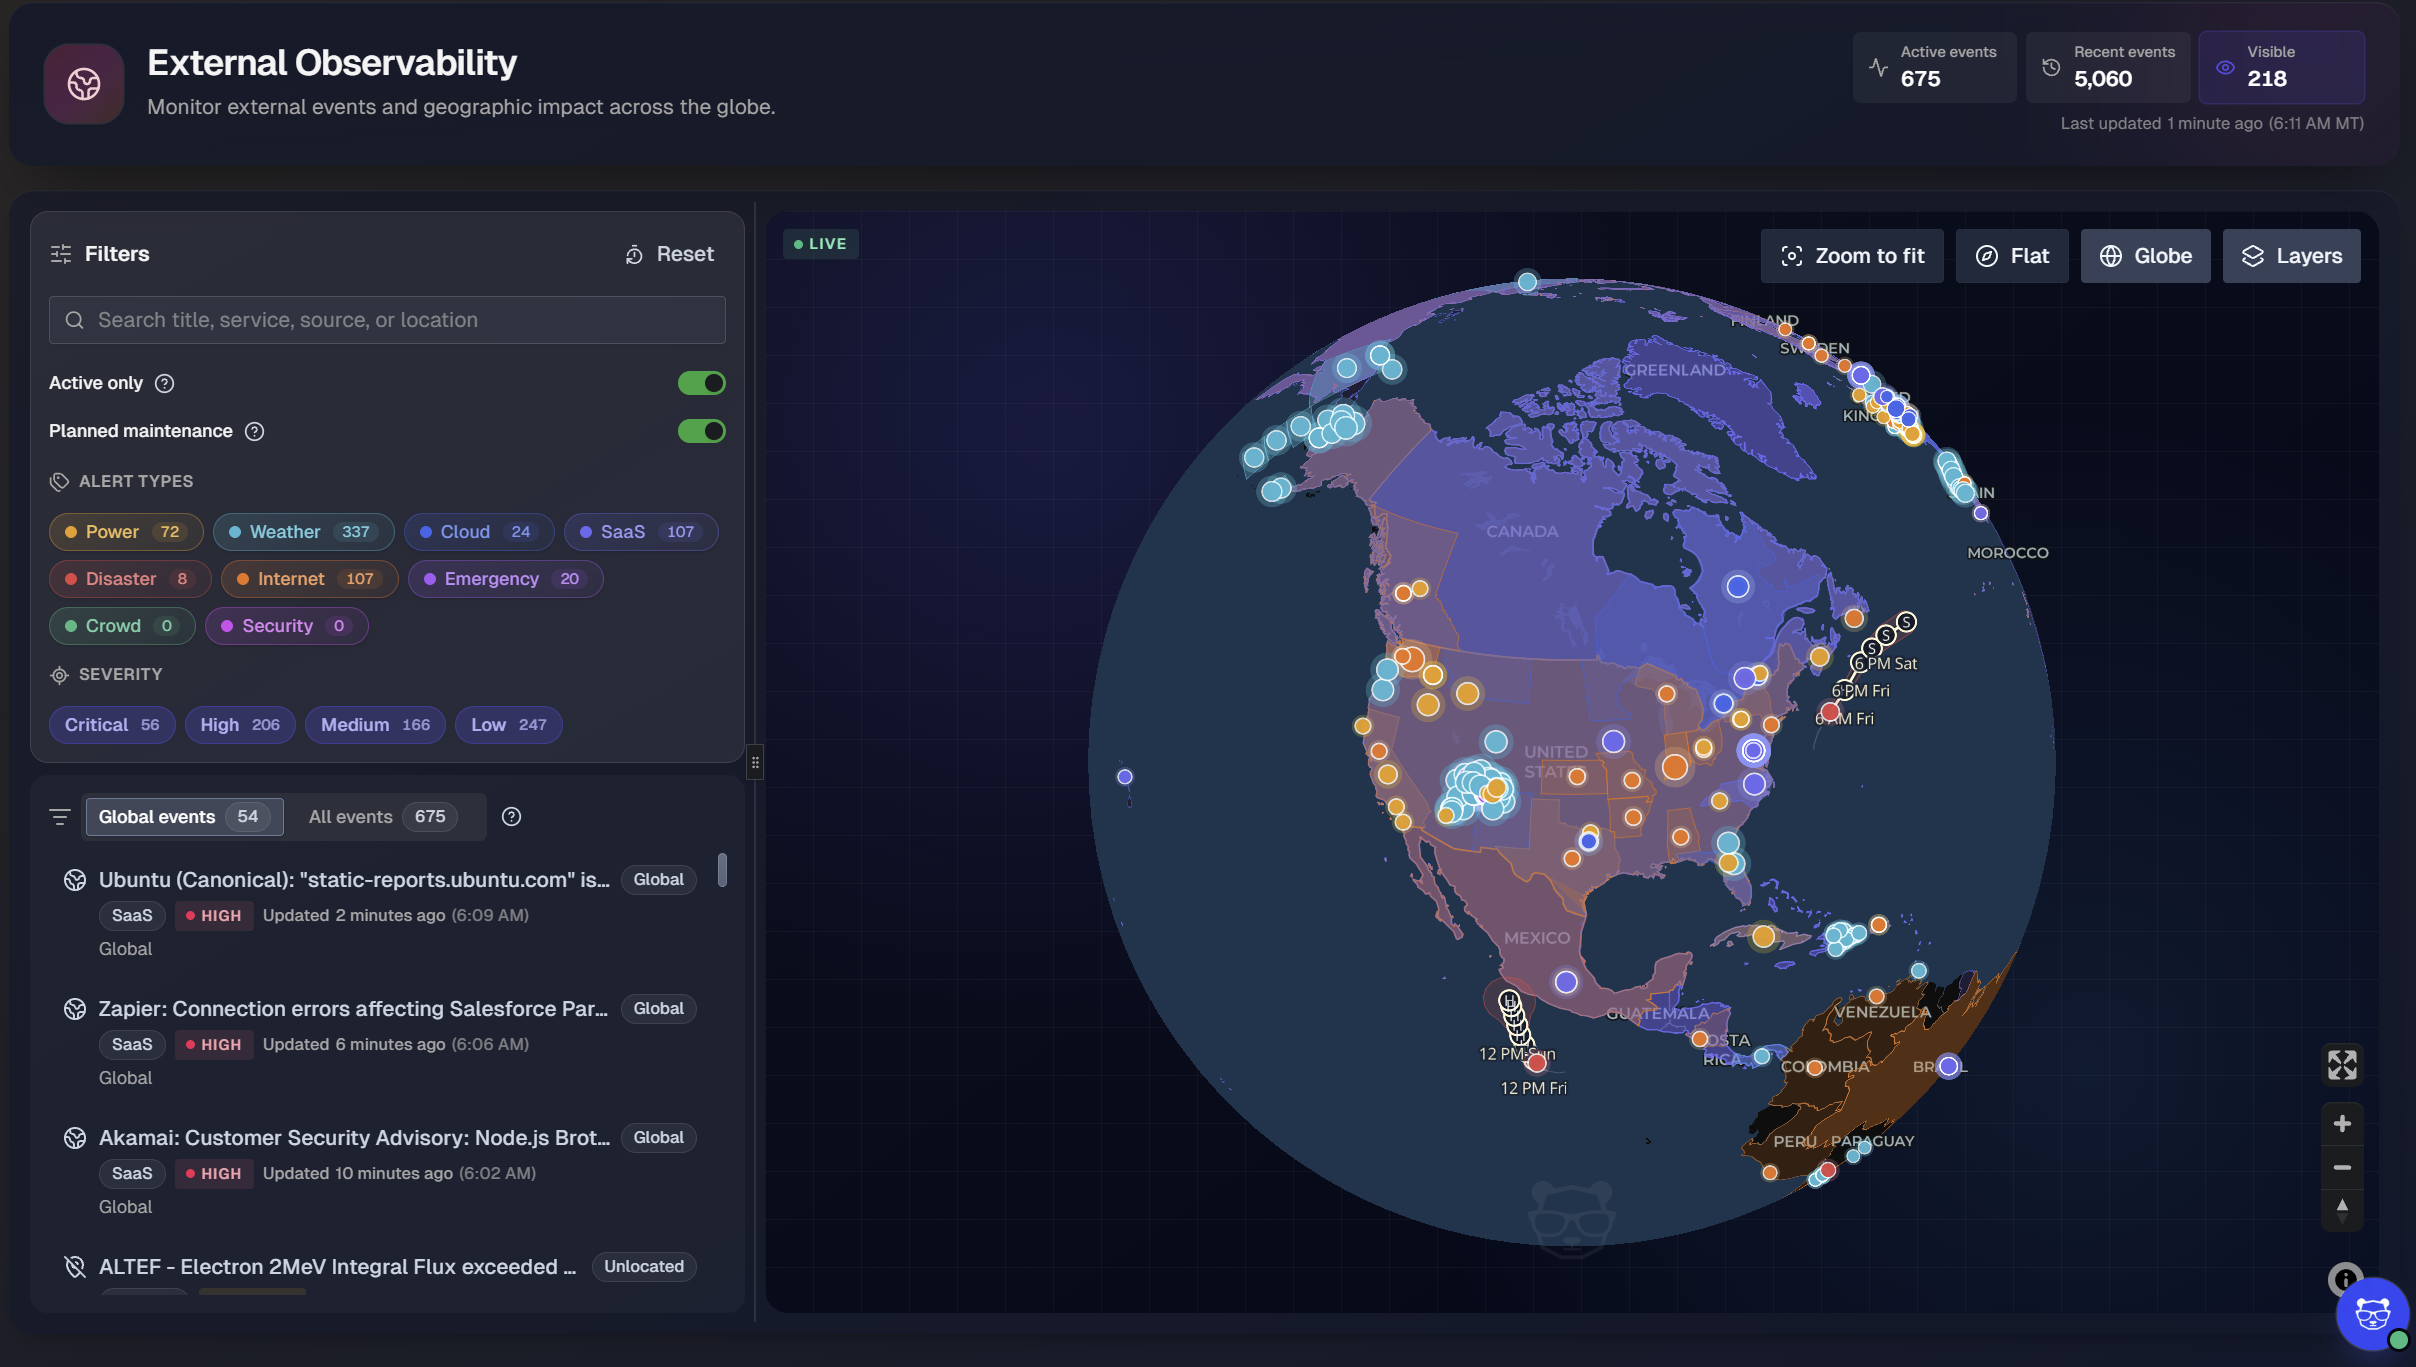
Event summary
At the top right of the page, summary tiles show the current event counts:
Tile | Description |
|---|---|
Active events | Number of external events that are currently active. |
Recent events | Number of external events that are no longer active, with activity that occurred within the past 48 hours |
Visible | Number of events currently displayed in the map view, based on your filters and the visible area of the map. |
Below the tiles, the Last updated timestamp shows when the event data was last refreshed, in both relative and local time.
Filter events
Use the Filters panel on the left side of the page to narrow the events shown on both the map and in the event list.
The Filters panel includes the following options:
Search: Enter a keyword to search event titles, services, sources, and locations.
Active only: Turn on to show only events that are currently active.
Planned maintenance: Turn on to include planned maintenance events from providers.
Alert types: Select one or more alert types to show only events of those types. Each alert type displays the number of matching events. See Alert Types for more information.
Severity: Select one or more severity levels to show only events of those severities. Events are assigned one of four severity levels: Critical, High, Medium, or Low. Each severity level displays the number of matching events.
To clear all filters and return to the default view, at the top right of the Filters panel, click Reset.
Filter application
Filters apply to both the map and the event list.
Alert types
Each alert type has its own color. Event markers on the map use the same color as their alert type, so you can identify event types at a glance.
Alert type | Color | Description |
|---|---|---|
Power | Yellow | Power outages reported by utility providers. See Power Outages. |
Weather | Turquoise | Severe weather alerts. See Severe Weather. |
Cloud | Blue | Issues with Infrastructure-as-a-Service (IaaS) and Platform-as-a-Service (PaaS) providers. See Cloud Platforms. |
SaaS | Purple | Issues with SaaS products. See SaaS Products. |
Disaster | Red | Natural disasters, such as earthquakes, tsunamis, tropical cyclones, volcanic eruptions, and flooding. See Natural Disasters. |
Internet | Orange | Outages and disruptions with internet service providers and communication service providers. See Internet Outages and Disruptions. |
Emergency | Magenta | Non-natural emergencies, evacuations, wildfire emergencies, and official emergency alerts. See Other Emergencies. |
Event list
The event list appears below the Filters panel. Use the tabs at the top of the list to choose which events to display:
Global events: Includes global, non-geolocated, and near-Earth events.
All events: All events that match your current filters.
Affects your organization: Include only events that match your organization's footprint.
Each tab shows the number of events it contains.
Each event in the list includes:
Title: The provider or source name, followed by a summary of the event. For example,
Zapier: Connection errors affecting Salesforce....Location tag: Shows Global for events that affect a broad area, the specific locale, or Unlocated for events without location data.
Alert type: The type of event, such as SaaS or Power.
Severity: The severity level of the event.
Updated: How long ago the event was last updated, followed by the local time of the update.
Location: The area affected by the event.
Select any event in the list to view additional details about it. Selecting an event will zoom the map to its location, if applicable.
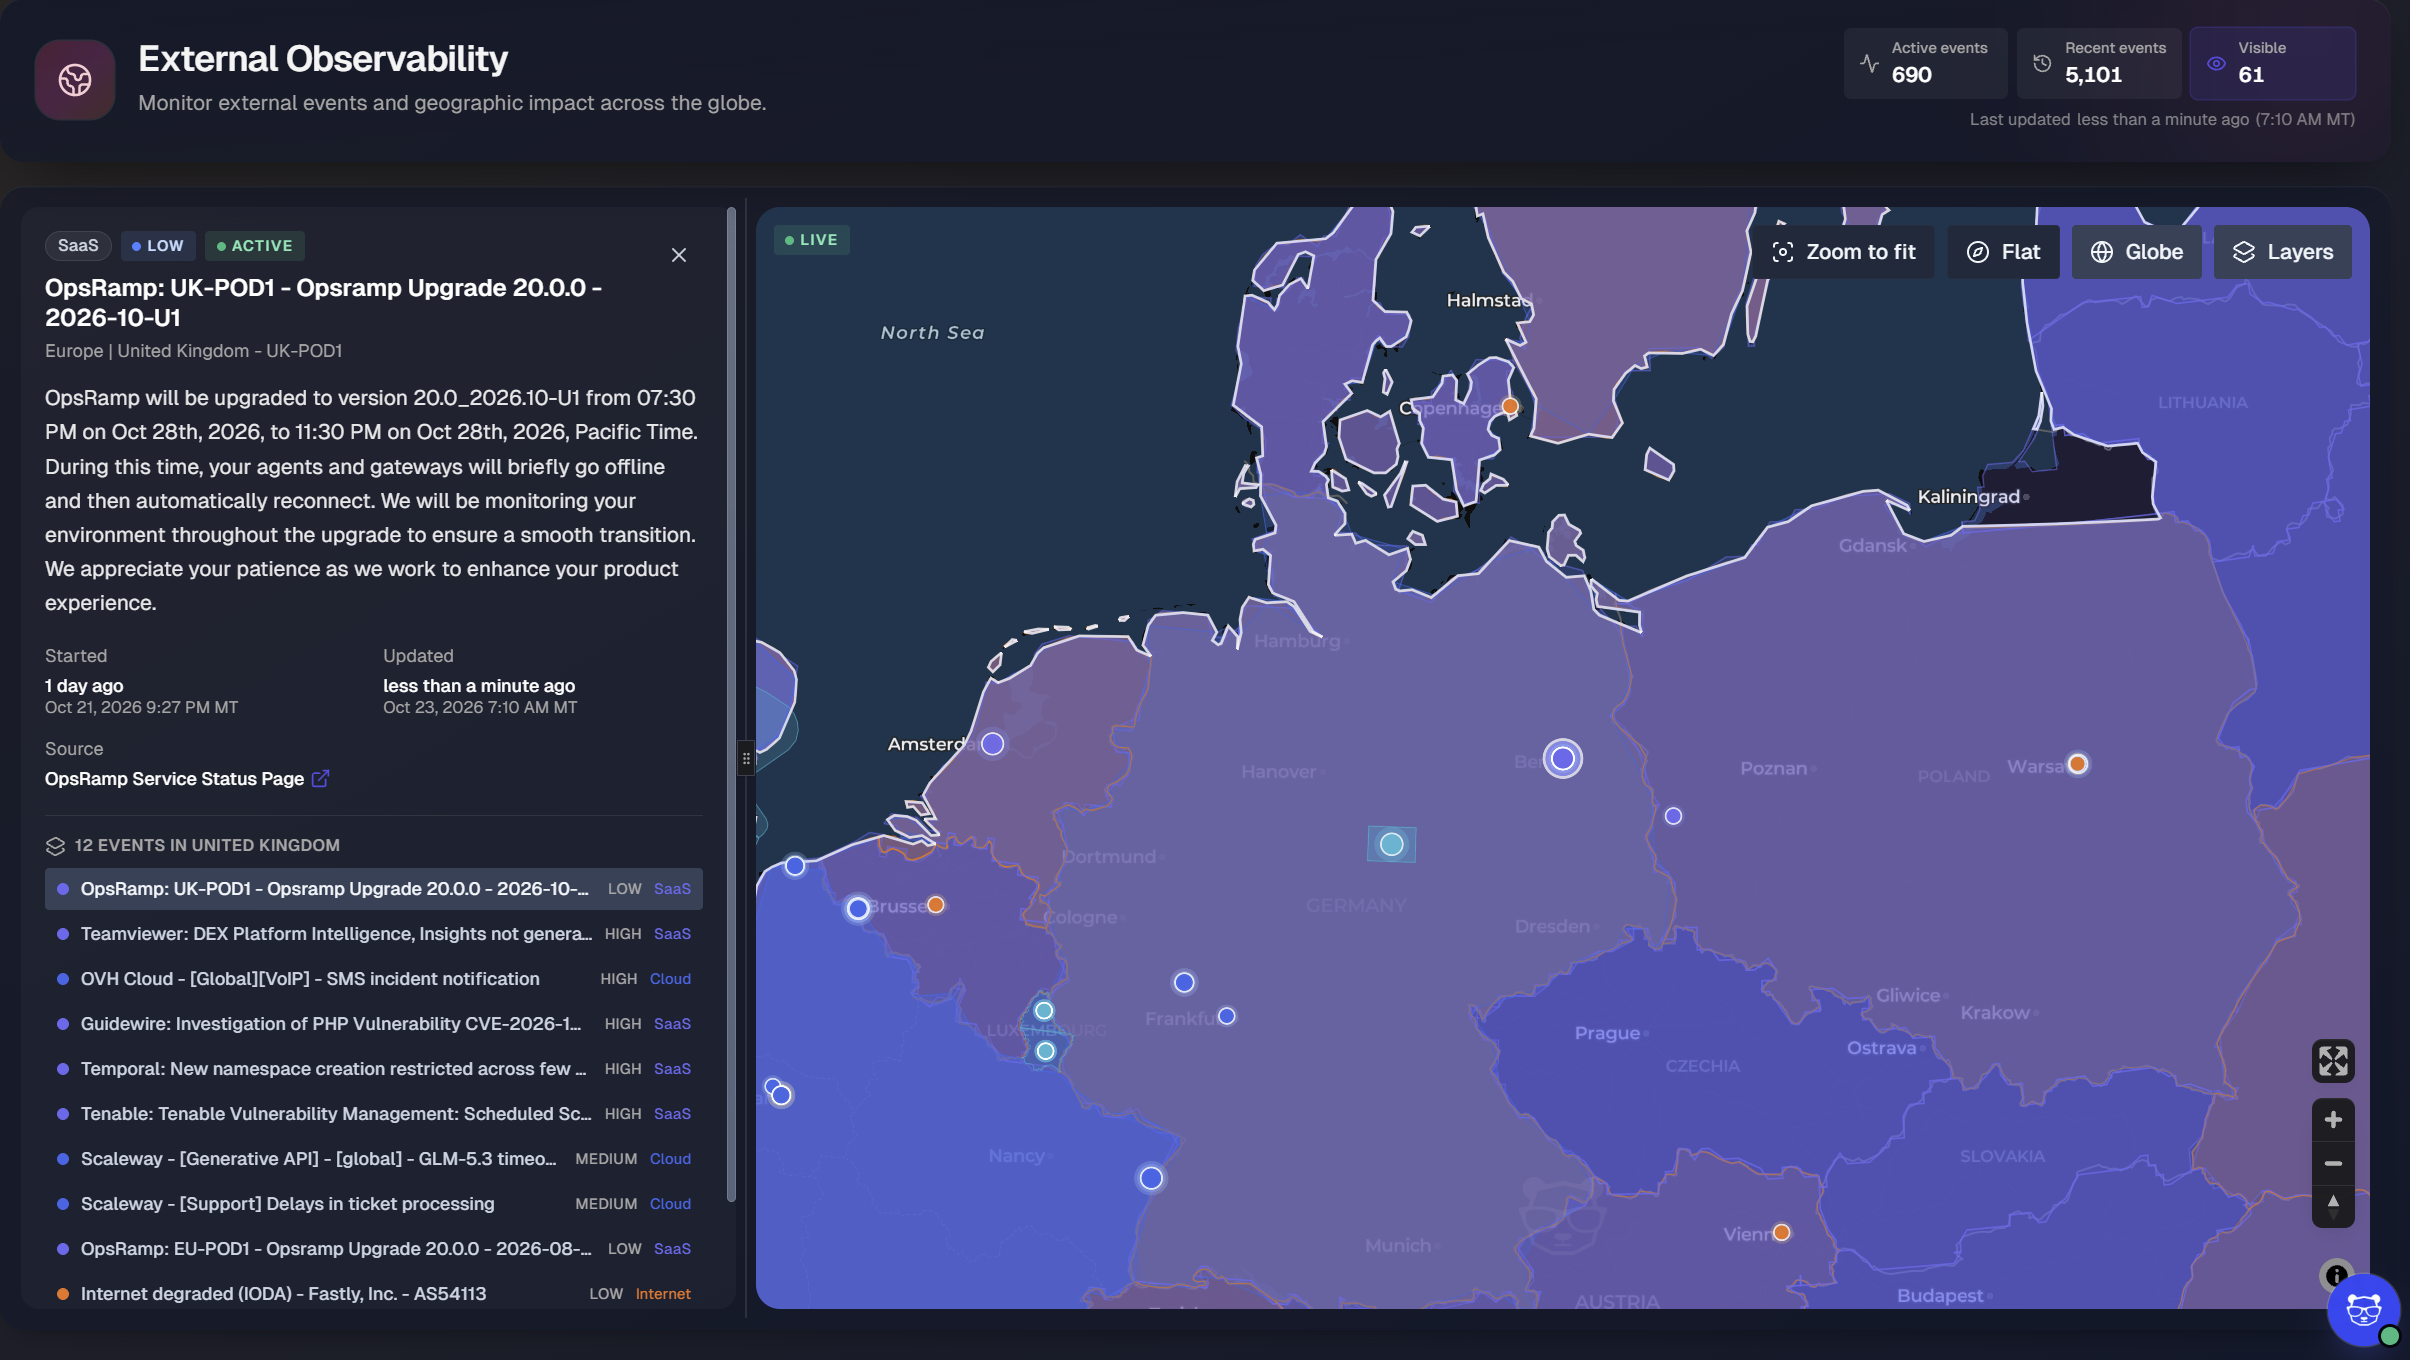
Map
The map shows the location of each external event. Event markers are color-coded by alert type. Additional markers may be shown on the map depending on the selected layers.
Click and drag to move the map. Scroll to zoom in and out.
At the bottom right of the map, use the following controls:
Full screen: Expands the map to fill the screen.
Zoom in and Zoom out: Increases or decreases the map zoom level.
Reset orientation: Returns the map to a north-up orientation.
Change the map view
At the top right of the map, use the view controls to change how the map is displayed:
Control | Description |
|---|---|
Zoom to fit | Adjusts the zoom level so that all visible events fit in the map view. |
Flat | Displays the map as a flat, two-dimensional projection. |
Globe | Displays the map as a three-dimensional globe. |
Layers | Opens the Layers panel, where you can turn map layers on and off. |
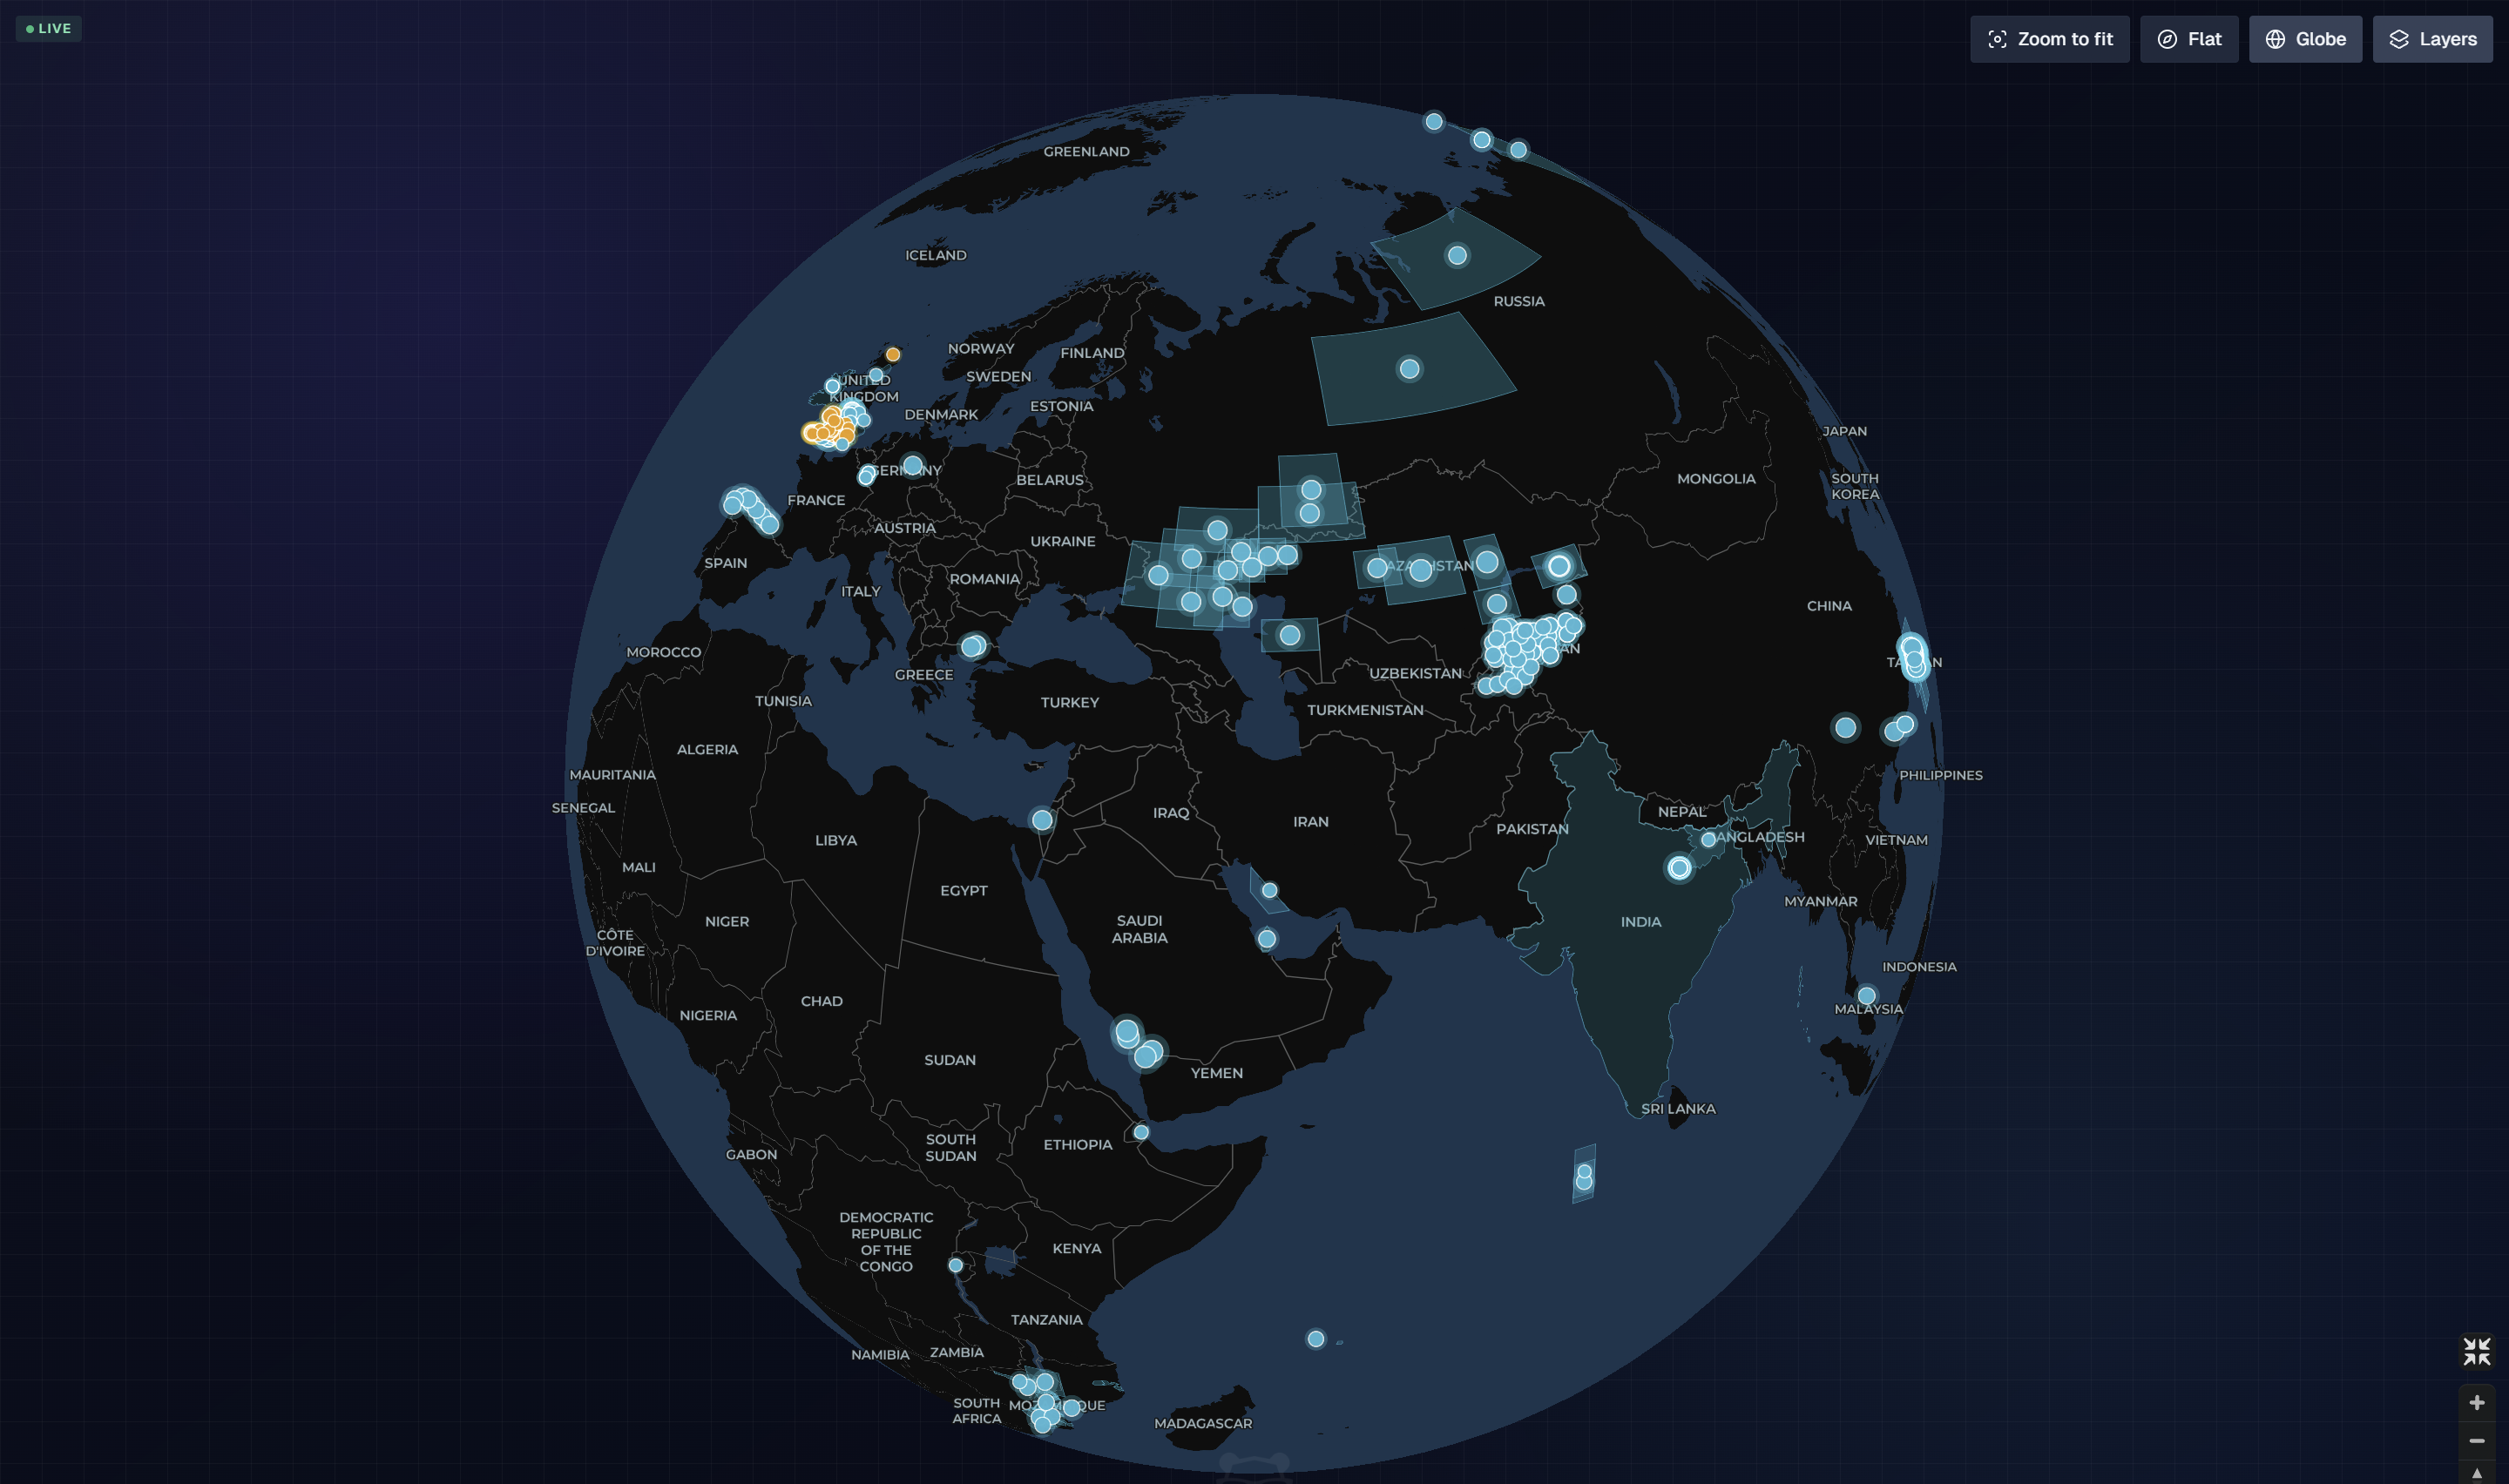
Globe view
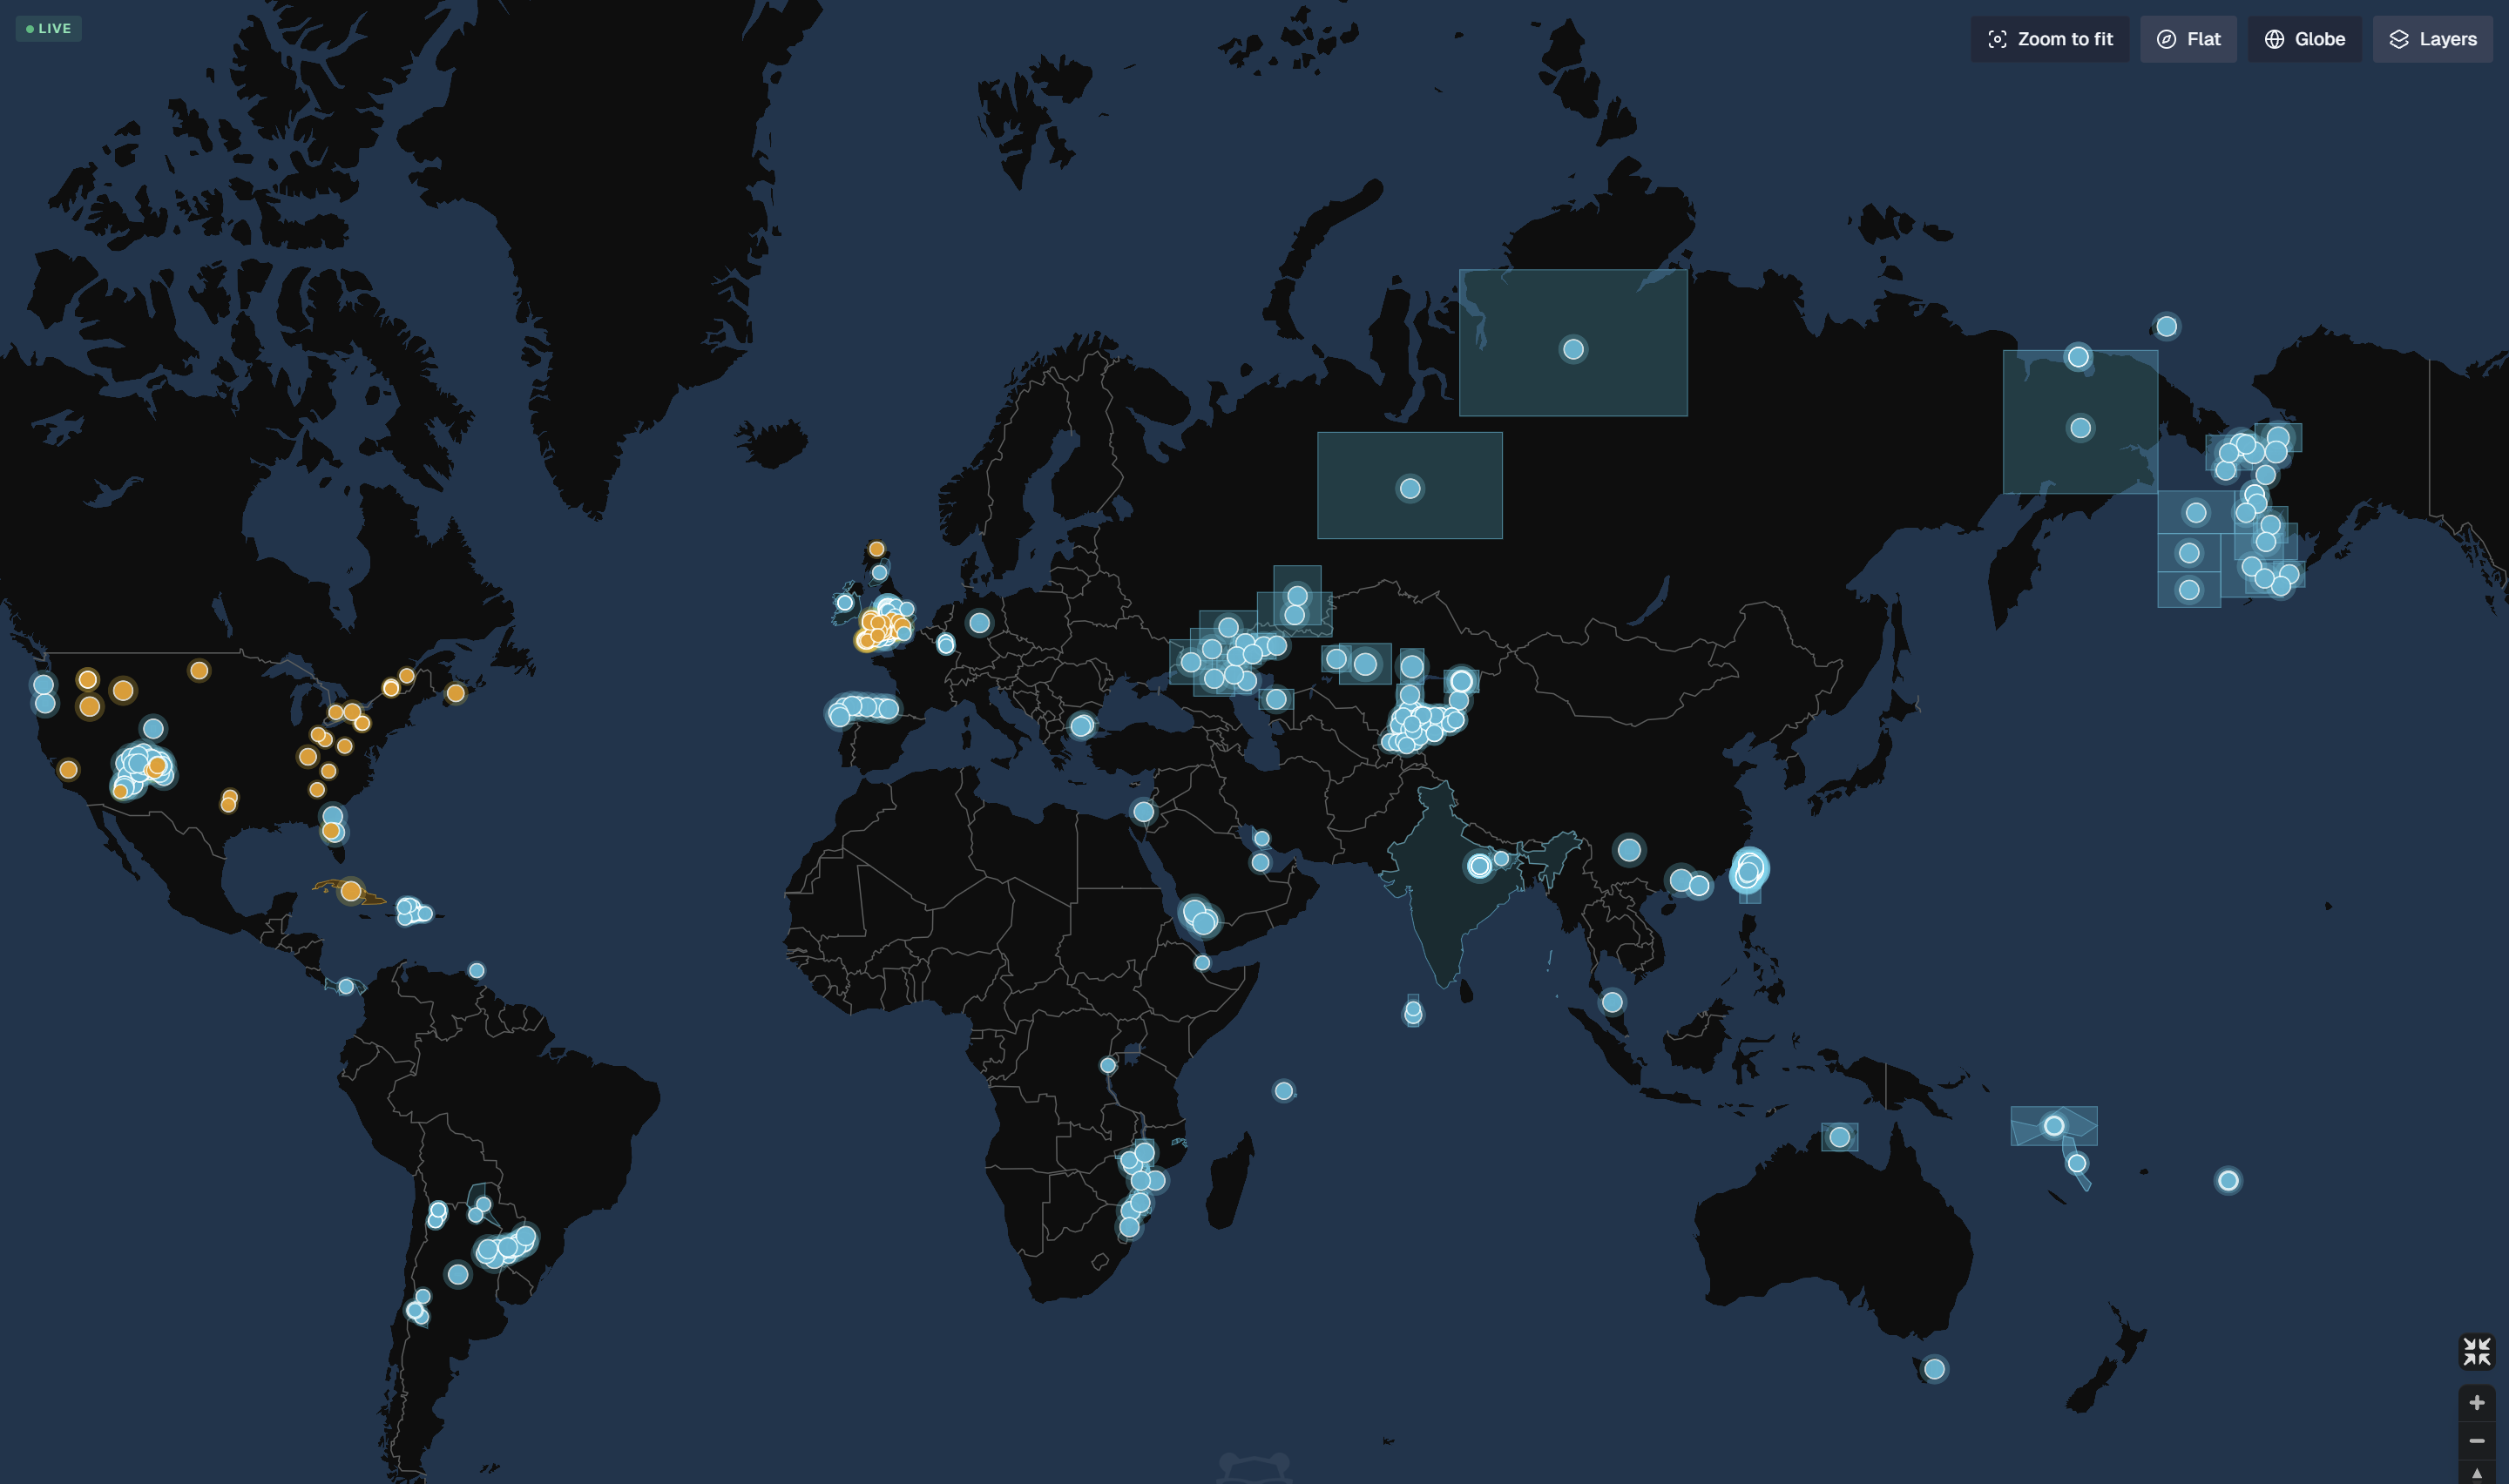
Flat view
Map layers
To show or hide map layers, at the top right of the map, click Layers, then click a layer to turn it on or off. Active layers are highlighted.
The following layers are available:
Layer | Description |
|---|---|
Markers | Shows each event as a marker on the map. |
Bounds | Shows a rectangular impact area for an event. |
Polygons | Shows the affected area of an event as a shaded shape. |
Clusters | Groups nearby event markers into a single cluster. |
Heatmap | Shows the density of events across the map. |
Details | Displays tropical cyclone tracks, forecast zones, and earthquake map bands. |
Cables | Shows the routes of undersea cables. |
Night | Shades the areas of the world that are currently in darkness. |
Zones | Shows time zone and international date boundaries. |
Stats | Shows event statistics on the map, including the number of areas and events. |
By default, the Markers, Bounds, Polygons, and Details layers are enabled.
Configure External Observability
Use the Configure window to tailor External Observability to your organization. Choose the services, utilities, and regions your organization depends on, put your own sites on the map, and define saved views for Operations Mode.
To open the configuration, go to the top right of the External Observability page and click Configure.
The Configure window has three tabs:
Impacts
<Your org>: Choose the third-party services, utilities, and regions that affect your organization. Matching events are tagged Impacts You and appear in your organization's tab of the event list.Mapped Location Pins: Add your organization's sites, such as hotels, stores, data centers, and offices, to the map as pins.
Operations Mode Views: Define location-based views for your operations center, including carousels that rotate through several views.
Each tab shows the number of items configured in it.
Define the events that affect your organization
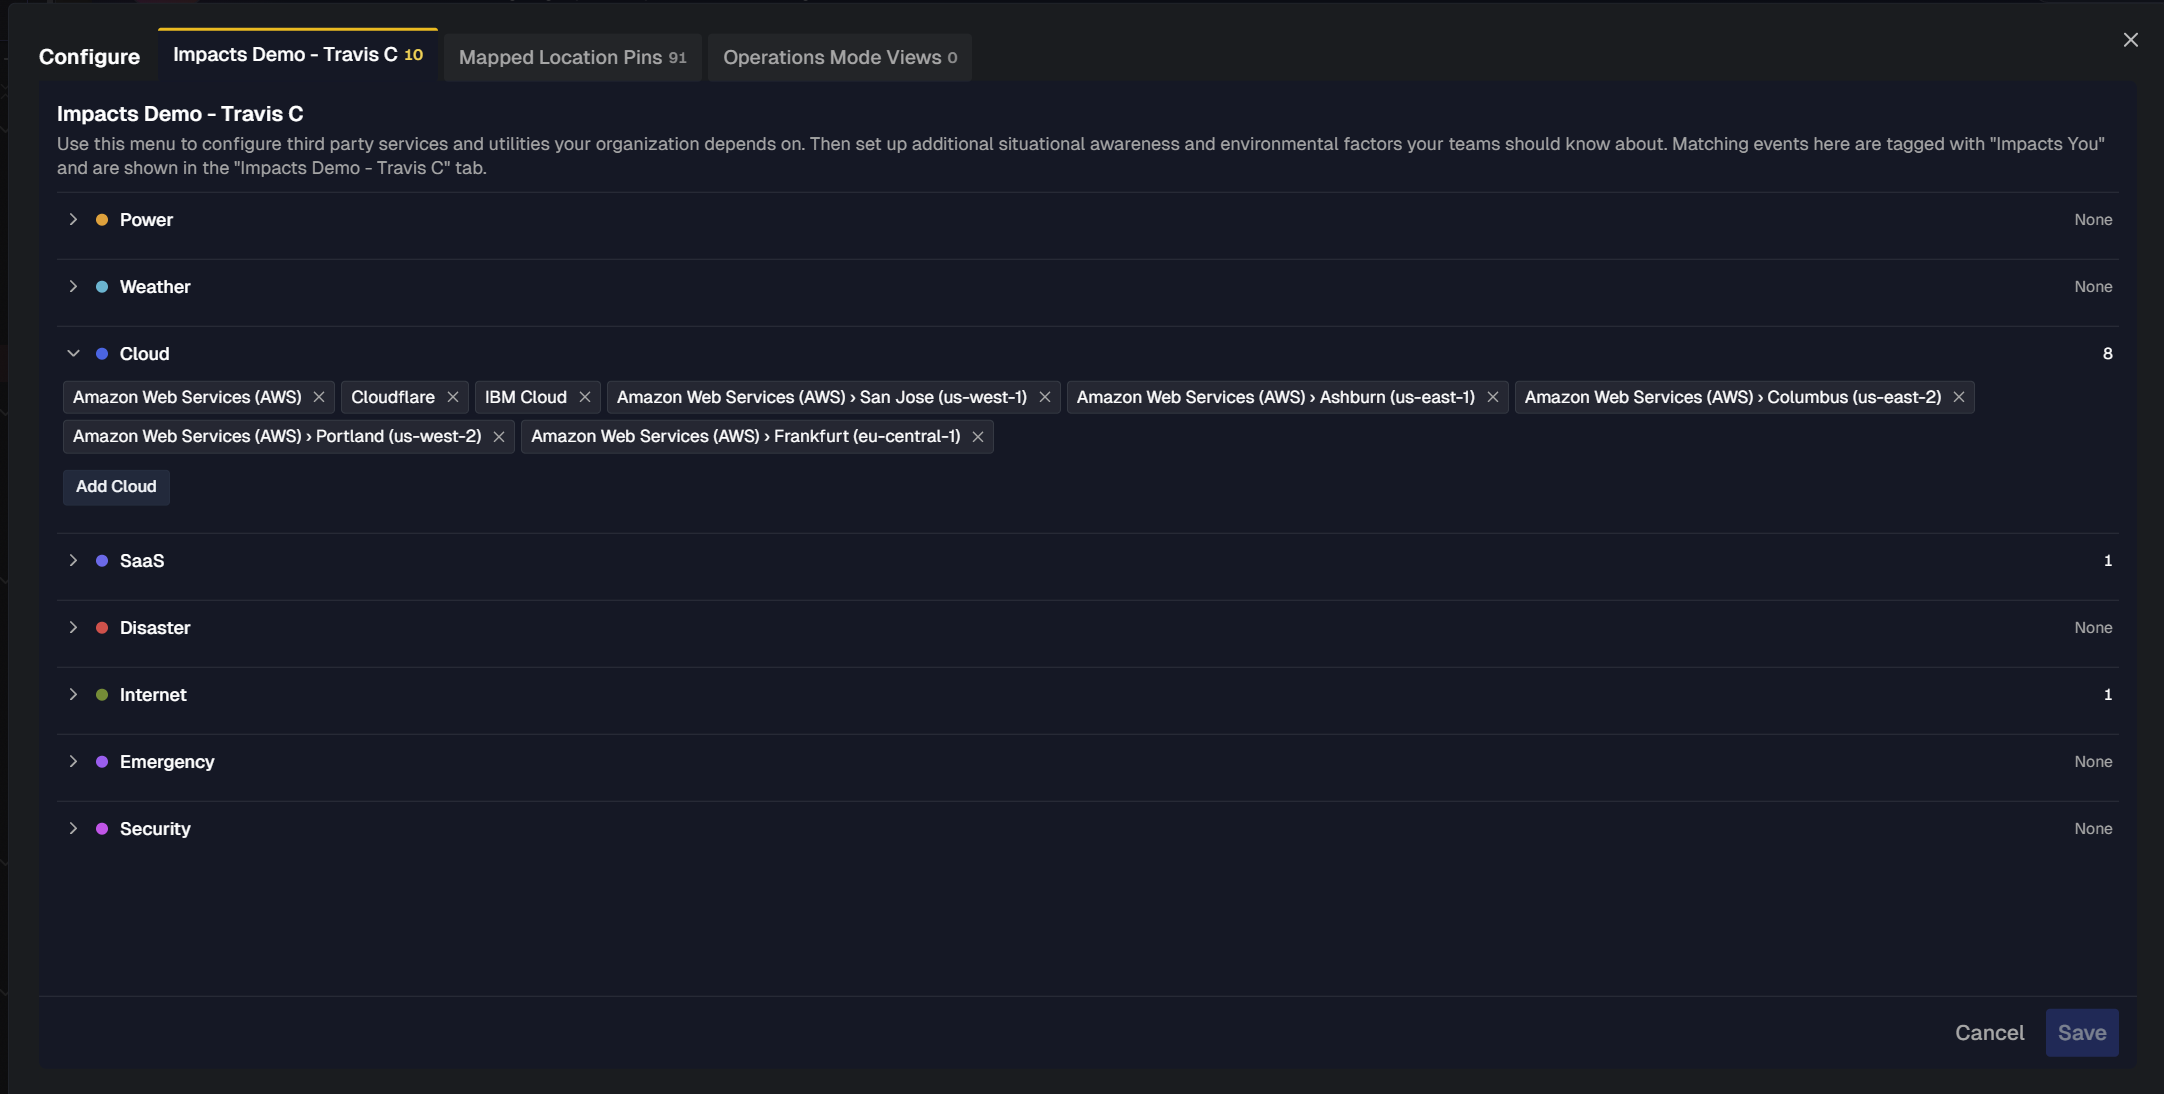
On the Impacts <Your Org> tab, choose the third-party services and utilities your organization depends on, and the regions where situational and environmental events matter to your teams. When an event matches your selections, BigPanda tags it Impacts You and shows it in your organization's tab of the event list.
Selections are grouped by alert type. Each alert type shows the number of selections it contains. The following alert types are available:
Power
Weather
Cloud
SaaS
Disaster
Internet
Emergency
Security
See External Observability Sources for more information about the categories.
Add a service, utility, or region
In the Configure window, open the
<organization name>tab.Click an alert type to expand it. For example, click Power.
Click Add
<alert type>. For example, click Add Power.In the picker, find and select the item to track:
Regions: For alert types such as Power, the picker lists continents and the number of countries in each. Search for a continent, or click a continent to choose a country within it. For example, North America › Belize.
Providers and provider regions: For alert types such as Cloud, choose a global provider, such as Amazon Web Services (AWS), Cloudflare, or a specific provider region, such as Amazon Web Services (AWS) › Ashburn (us-east-1).
Click Done.
At the bottom right of the window, click Save.
Each selection appears under its alert type. To remove a selection, click the x on it, then click Save.
Add your sites to the map
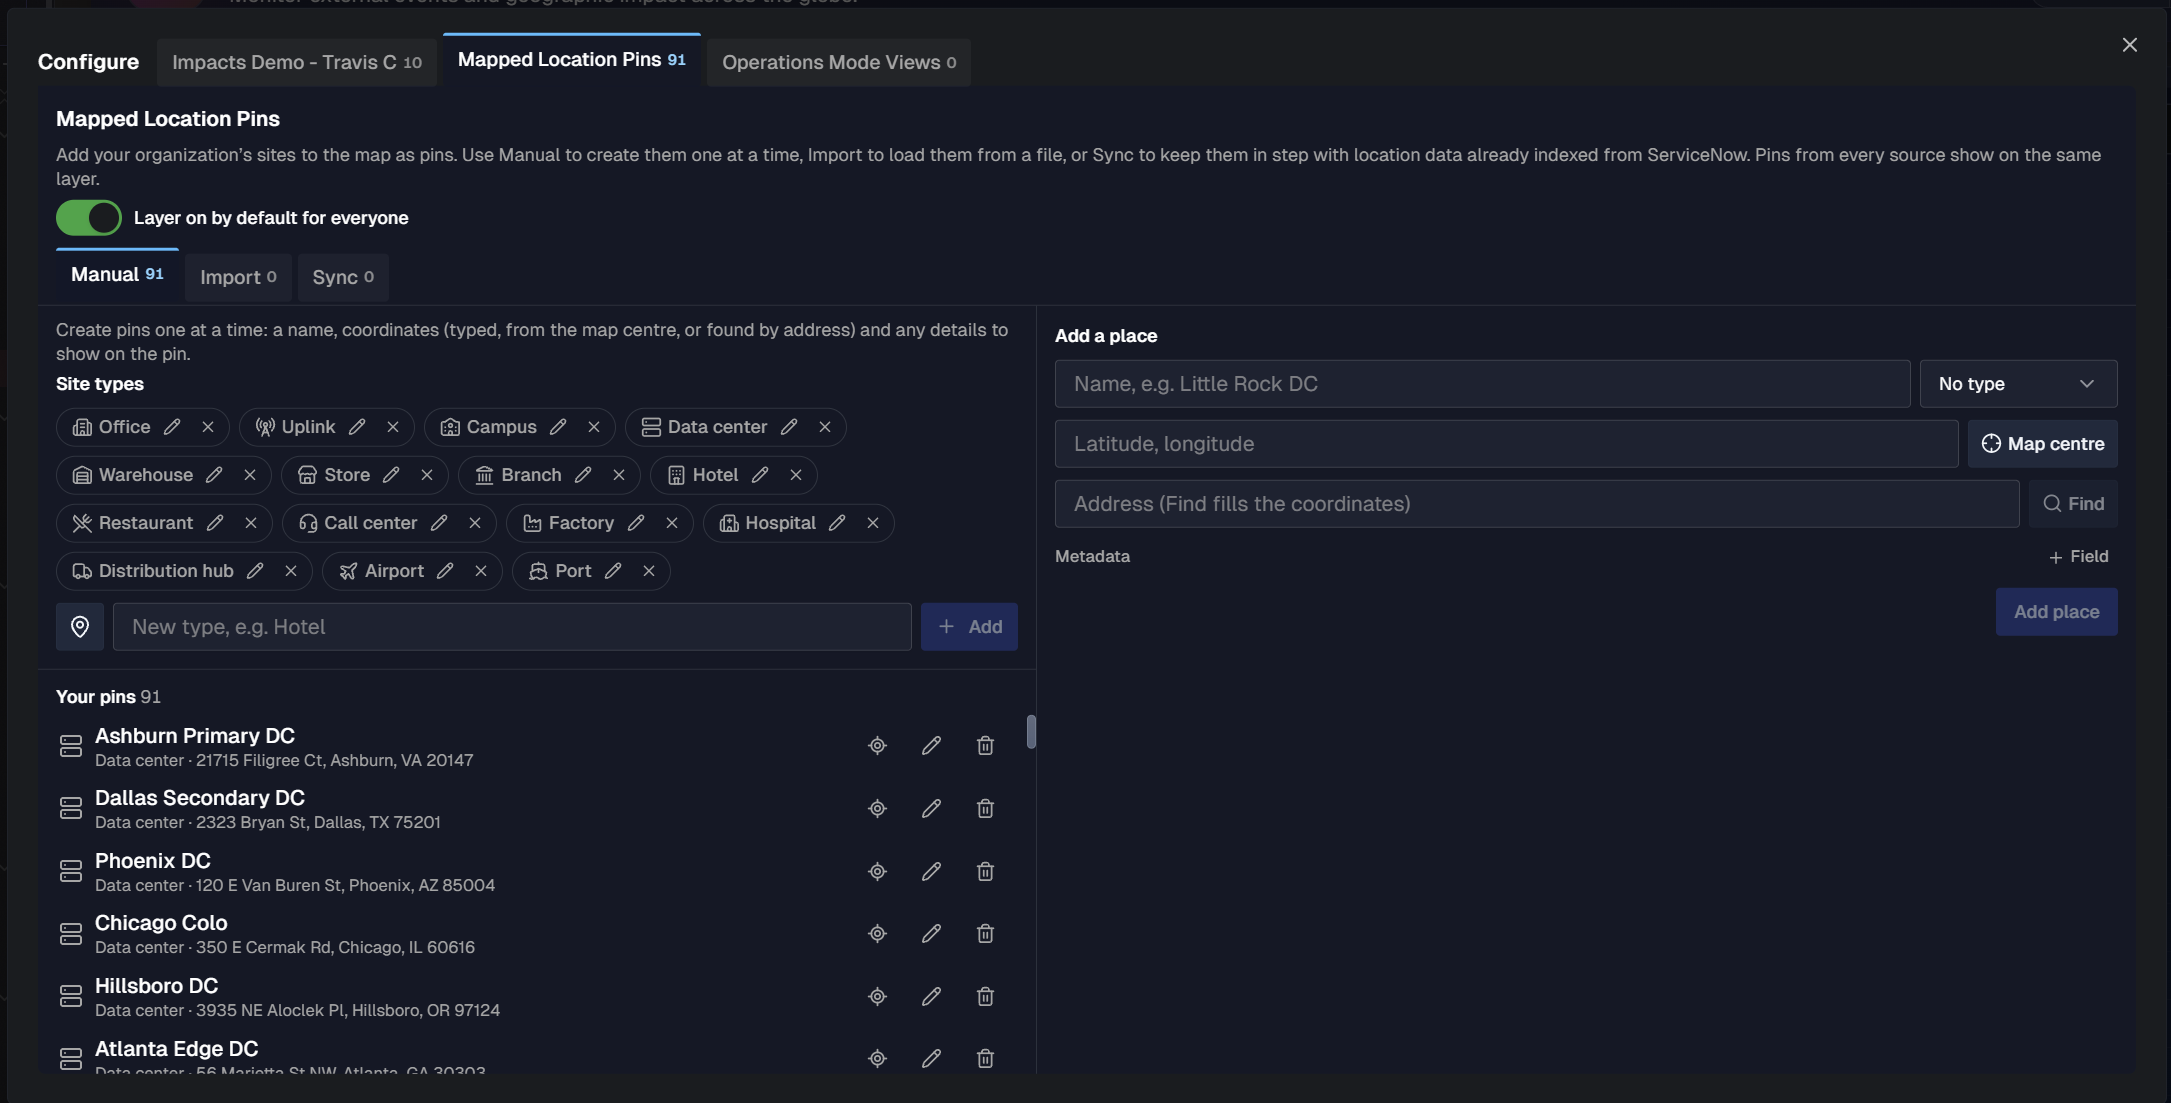
On the Mapped Location Pins tab, add your organization's sites to the map as pins, using site type to add the correct icon. Outside events will then appear next to the sites they could affect.
Add pins from any of three sources. Pins from every source appear on the same Locations layer of the map.
Source | Use it to |
|---|---|
Manual | Create pins one at a time. Choose to create the pin with coordinates you type, by selecting the current map center, or find a place by address. |
Import | Load pins from a CSV or TSV file. |
Sync | Keep pins in step with the ServiceNow location table indexed in your IT Knowledge Graph (ITKG). Synced pins refresh every day. |
Each source tab shows the number of pins it contains.
To show the Locations layer to everyone in your organization by default, at the top of the Mapped Location Pins tab, turn on Layer on by default for everyone. Each person can still turn the layer on or off from the map's Layers panel.
Manage site types
Each site type will have a dedicated icon related pins show on the map. Name the site type a familiar name your business calls it, such as Hotel, Branch, or Corporate Office, and give it an icon from a curated set.
The site types list includes common types such as Office, Uplink, Campus, Data center, Warehouse, Store, Branch, Hotel, Restaurant, Call center, Factory, Hospital, Distribution hub, Airport, and Port. Types you add from a sync appear in the same list.
To add a site type:
On the Mapped Location Pins tab, click Manual.
To the left of the New type field, click the icon button, then select an icon.
In the New type field, enter a name for the site type. For example,
Hotel.Click Add.
To rename a site type or change its icon, click the Edit (pencil) icon on the site type. To remove a site type, click its x.
Add a site manually
On the Mapped Location Pins tab, click Manual.
In the Add a place panel, enter a Name for the site.
From the Type list, select a site type.
Set the site's coordinates using one of these options:
In the Latitude, longitude field, enter the coordinates as
<latitude>, <longitude>. For example,39.0438, -77.4874.Click Map centre to use the coordinates at the center of the current map view.
In the Address field, enter the site's address, then click Find. BigPanda fills in the coordinates.
(Optional) To add details to the pin, next to Metadata, click + Field, then enter a label and a value. For example, enter
CriticalityandTier 1. Repeat for each detail.Click Add place.
The new pin appears in the Your pins list, which shows each pin's name, site type, and address.
Edit or delete a manual site
In the Your pins list, use the icons next to a pin:
Edit (pencil): Opens the Edit
<site name>panel. Change the name, type, coordinates, address, or metadata, then click Save. To discard your changes, click Cancel.Delete (trash can): Removes the pin from the map.
Locate (diamond): Go to the location on the map.
Import sites from a file
Import pins from a CSV or TSV file whose columns follow the import template.
The file supports the following columns:
Column type | Examples |
|---|---|
Required |
|
Address |
|
Other standard columns |
|
Additional details | Any other column becomes an additional detail on the pin. |
A template file is available for download in the UI.
The following limits apply to imported files:
Your organization can have up to 1,000 manual and imported places in total. BigPanda refuses a file that would exceed this limit.
The first five additional detail columns show on the place card. Columns 6 through 10 are stored but hidden. BigPanda refuses a file with more than 10 additional detail columns.
Files with more than 500 places can include at most five additional detail columns.
Rows without latitude and longitude are located from their address on import, unless the location is in China. Chinese locations must include latitude and longitude.
To import a file:
On the Mapped Location Pins tab, click Import.
Click Import file, then select your file.
Sync sites from the IT Knowledge Graph
If your ServiceNow location table is indexed in your IT Knowledge Graph (ITKG), the Sync tab reads it directly. Map the table's columns once, and BigPanda can refresh your pins every day.
Indexed location table required
Sync is available only after the ServiceNow cmn_location table is indexed for your organization. If the table isn't indexed, the Sync tab shows a message instead of the configuration options.
The Sync tab supports two sync sources:
Sync source | Source path | How pins update |
|---|---|---|
Automated | Knowledge Graph > ServiceNow | Reads the location table already indexed in your IT Knowledge Graph (ITKG). Pins refresh every day. Click Resync Now to refresh them immediately. |
Ad-hoc | Direct > ServiceNow | Pulls the location table once through your ServiceNow integration. Pins stay as pulled until you click Sync Now again. |
Connect the source table using automated sync
On the Mapped Location Pins tab, click Sync.
From the Sync source list, select Automated. The source path shows Knowledge Graph › ServiceNow.
From the Source table list, select the location table. For example,
cmn_location (ServiceNow location).
Below the source table, a status line shows the number of rows indexed, the number of columns, when the table was last indexed, and when pins were last synced.
Ad-hoc sync
Use ad-hoc sync to pull the ServiceNow location table once, directly through your ServiceNow integration. Ad-hoc sync doesn't refresh on its own, so use it when your site list rarely changes or when the table isn't indexed in your ITKG.
ServiceNow integration required
Ad-hoc sync pulls the location table through your organization's ServiceNow integration. Set up the integration before you use ad-hoc sync. See the ServiceNow integration documentation
On the Mapped Location Pins tab, click Sync.
From the Sync source list, select Ad-hoc. The source path shows Direct › ServiceNow.
From the Source table list, select the location table. For example,
cmn_location (ServiceNow location).Configure the field mapping, map icons, address, additional details, and filtering. See Map the required fields and the sections that follow.
At the bottom of the configuration, click Apply configuration.
At the right of the status line, click Sync Now to pull the table and create the pins.
Below the source table, a status line shows the number of rows in the table, the number of columns, and when pins were last synced. Before the first pull, the status line shows pins synced never.
Pins from an ad-hoc sync stay as pulled. When locations change in ServiceNow, click Sync Now again to update the pins.
Map the required fields
In the Field Mapping section, select the source column for each required field:
Required field | Example source column |
|---|---|
Name |
|
Latitude |
|
Longitude |
|
Last changed |
|
Next to each field, Coverage shows the percentage of rows that have a value in the selected column. If some locations have no latitude and longitude data, a message shows how many locations BigPanda is not able to include in the map.
Assign an icon to each site type
In the Map Icons section, from the Site type column list, select the column that describes each kind of site. For example,
u_site_type.For each value in the column, select an icon.
Each value shows the number of locations that BigPanda will map to that icon after location filtering.
Choose the details each pin shows
In the Additional Details section, select up to 10 details to show in the pin detail view when someone clicks a pin. You can include custom columns.
In the Find a detail field, search for a column, or scroll the list of available details.
Select the checkbox next to each detail you want to include. The Example detail and Filled columns show a sample value and the percentage of rows with a value.
(Optional) To change how a detail appears on the pin, edit its name in the Detail label column. For example, rename
u_roomstoRooms.
Selected details appear as numbered chips at the top of the section, in the order they show on the pin. To remove a detail, click the x on its chip, or uncheck the box.
Filter locations
In the Location Filtering section, use conditional rules to include or exclude locations from appearing on the map.
Select Include or Exclude.
Select a column. For example,
u_status.Select an operator. For example, is.
Enter a value. For example,
Closed.To add another rule, click + Add condition.
Preview and apply the configuration
The Location Preview section shows what will land on the map with the current configuration.
Click Mapped or Excluded to switch the preview between the locations BigPanda will or won't map.
Search by name or address to find a specific location.
Click a location to preview its pin, including its site type, address, and additional details.
At the bottom of the tab, a summary shows how many locations BigPanda will map, how many locations will be excluded, and how many details and conditions you configured. For example, 2,281 of 2,400 locations will be mapped · 83 excluded by rules · 36 excluded for missing data · 4 details · 1 condition.
To save the configuration, click Apply configuration. To revert your changes, click Discard changes.
After you apply the configuration, BigPanda refreshes your synced pins. To refresh them immediately, click Resync Now.
Define Operations Mode views
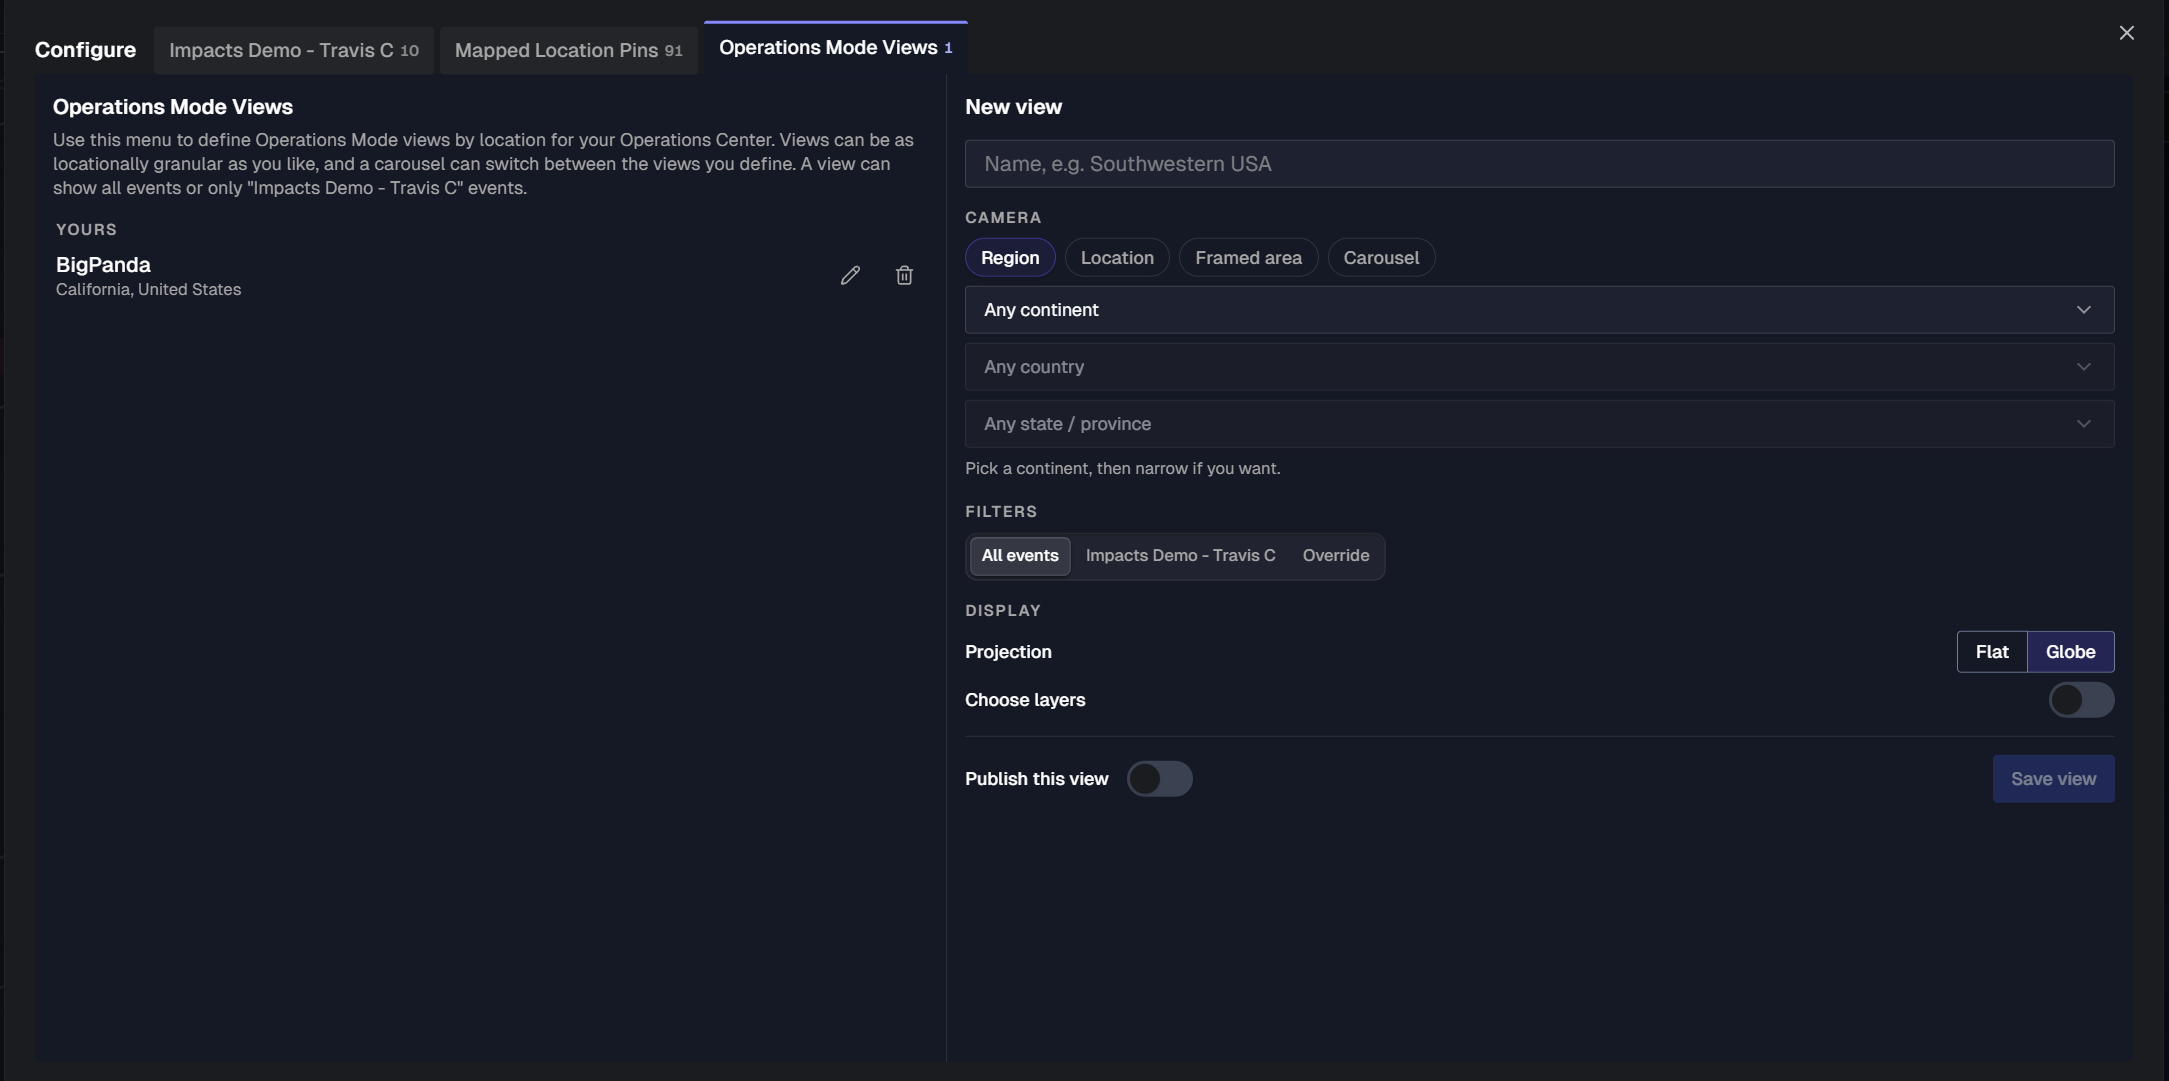
On the Operations Mode Views tab, define location-based views for your operations center. Views can be as broad or as granular as you need, and a carousel view can rotate through several locations. A view can be configured to show all events or only the events that affect your organization.
Create a view
In the Configure window, open the Operations Mode Views tab.
In the New view panel, enter a Name for the view. For example,
Southwestern USA.Under Camera, select how the view frames the map. See Camera options.
Under Filters, select which events the view shows:
All events: Shows all events.
<Your organization>: Shows only the events that affect your organization.Override: Choose specific event types to display.
Under Display, select a Projection: Flat or Globe.
(Optional) To choose which map layers the view shows, turn on Choose layers, then select the layers.
(Optional) To make the view available to others, turn on Publish this view.
Click Save view.
Saved views appear in the list on the left side of the tab.
Camera options
Camera | Description |
|---|---|
Region | Shows a geographic region. Select a continent, then narrow the view to a country and a state or province if needed. |
Location | Centers the view on a single place. Select a place, then select a Zoom level. The default zoom level is City. |
Framed area | Shows an area you frame yourself. Click Frame it on the map, pan and zoom the map to the area, then return to the Configure window. |
Carousel | Rotates through a list of stops. Under Stops, select the mapped location pins to include, then select a Dwell time for each stop. The default dwell time is 3 minutes. |