Environment Dashboards
The Environment Dashboards provide real-time statistics on operational health and bandwidth in a visually simple format ideal for status tracking. Within the Environment Dashboards, you can:
See overall service health at a glance.
Understand which services and applications are affected by current incidents.
Visualize important trends, and make sure the right team members are responding.
Focus your teams on the highest priorities by showing only the Environments for the most critical infrastructure and applications.
Access Environment Dashboards at Dashboards > Environment Dashboards.
Each dashboard displays key operational data for selected environments. While a dashboard is open, the data is refreshed every minute.
The color coding and simple format of the Dashboards are designed for a NOC wall or extra monitor displays to make passive monitoring of key environments easy.
Environment Changes
Dashboards are created based on environments. Changes in environments will affect the data that is displayed within the dashboard.
Dashboard Navigation
To access BigPanda Dashboards, sign in to the BigPanda UI and select the Dashboards Tab > Environment Dashboards.
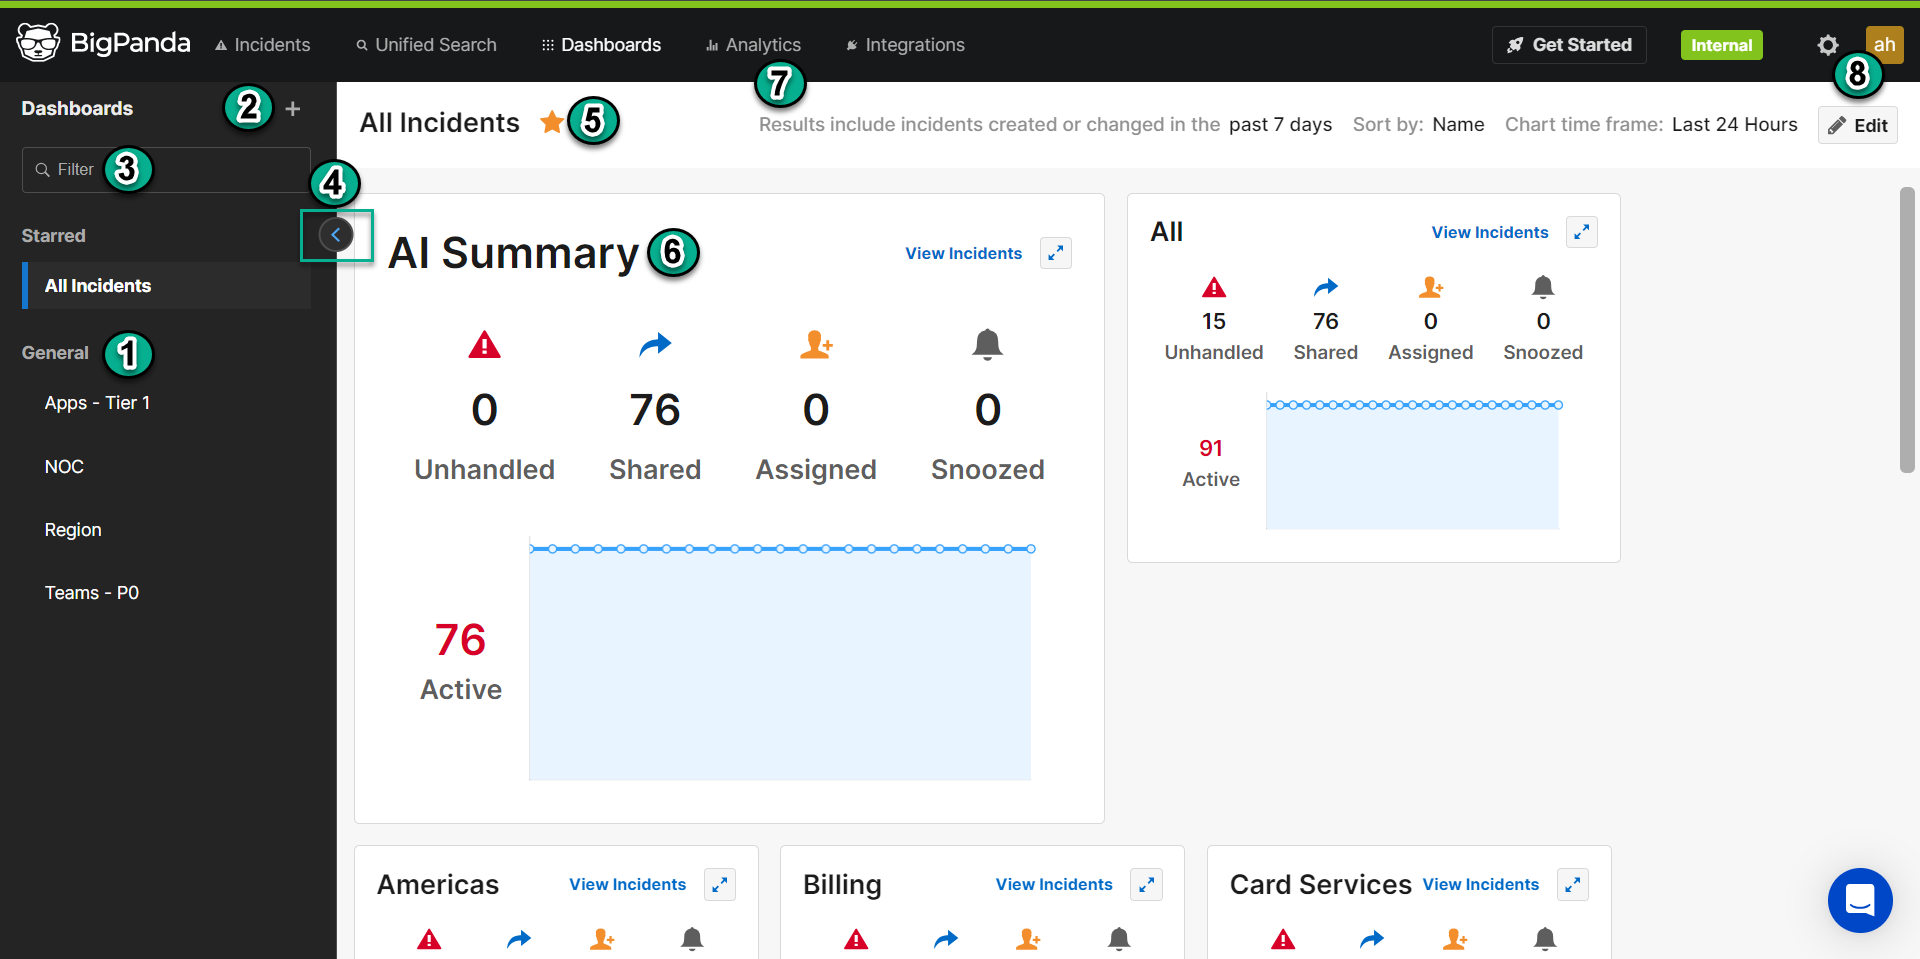
Live Dashboard
Field | Description | Related Documentation |
|---|---|---|
1 - Dashboard Selection Pane | Choose a dashboard to display. | |
2 - New Dashboard | Click the blue New Dashboard icon to create a new dashboard. | |
3 - Filter | Filter the dashboard selection pane to find a specific dashboard. | |
4 - Collapse Dashboard Selection Pane | Click the blue arrow to completely minimize the pane. | |
5 - Dashboard Name and Star Icon | The name of the dashboard appears. Click the Star icon next to the title to add the dashboard to the list of starred dashboards. Starred dashboards appear at the top of the Dashboard Selection Pane. | |
6 - Widgets | Dashboard widgets appear in the main display pane of the screen. Widgets display information about active incidents in BigPanda. To resize a widget, hover over the right corner and click the Resize widget icon. You can select from Small, Medium, or Large. | |
7 - Dashboard Defaults | The selected sort order and chart time frame. | |
8 - Edit | Click Edit to open the Edit Dashboard screen. Within this screen, you can adjust the dashboard name, widget type, sort order, time frame, and selected environments. |
Next Steps
Learn more about Using Environment Dashboards
Learn about navigating the The Analytics Tab
Dig into analytics options with BigPanda Analytics