Major Incident Management (MIM) Executions Analytics
Track major incident response performance and automation effectiveness in the MIM Executions analytics page.
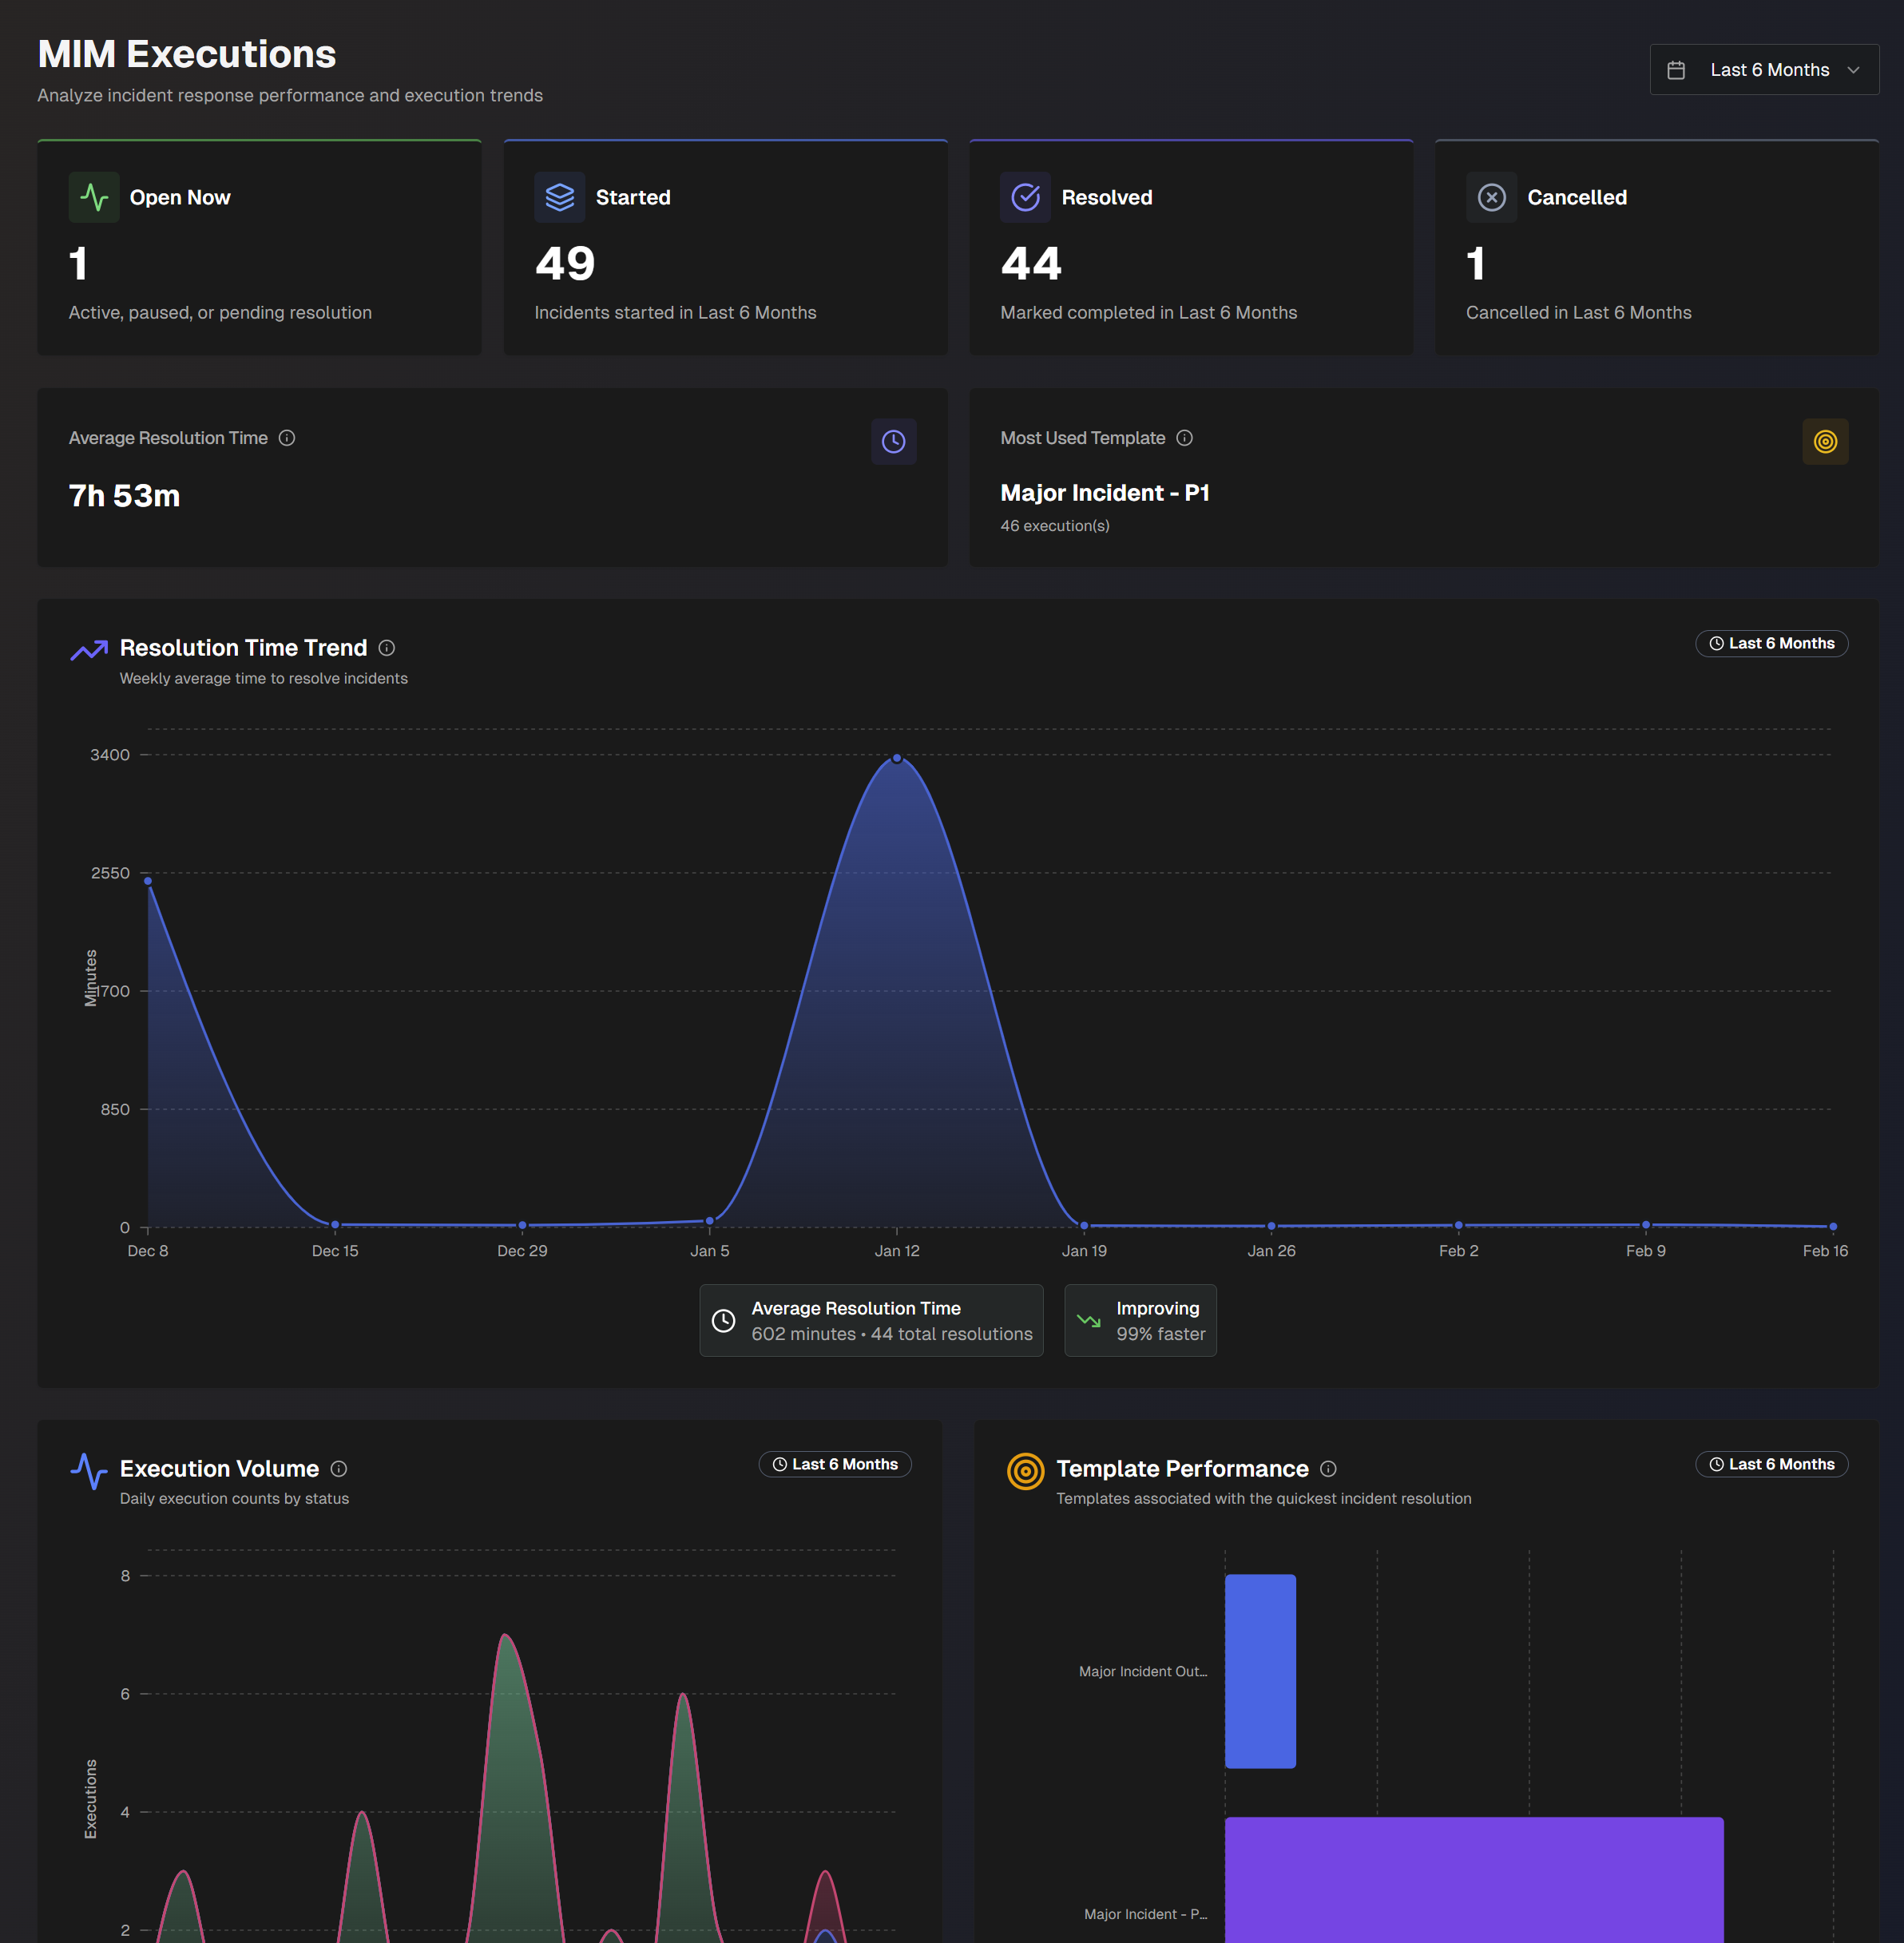
Use the drop-down menu at the top right of the screen to adjust the selected time period.
The following report widgets are available in the MIM Executions section of the page:
Widget | Description |
|---|---|
Open Now | Number of major incidents currently active, paused, or pending resolution. |
Started | Number of major incidents that have started. |
Resolved | Number of major incidents that have been resolved. |
Cancelled | Number of major incidents that were cancelled. |
Average Resolution Time | Average amount of time it took to resolve a major incident. Resolution time is the time from when an incident starts to when it's marked completed. |
Most Used Template | MIM template that was used the most across major incidents opened by your organization. |
Resolution Time Trend | Weekly average time to resolve major incidents, over time. Each point on the chart displays incidents that were marked completed that week. The bottom of the widget displays the average resolution time and trend information. |
Execution Volume | Daily MIM execution counts, by incident execution status (Resolved, Open, Not Resolved). Open MIM executions are active, paused, or pending resolution. Not Resolved MIM executions that were canceled or failed. Resolved incidents are MIM executions that were marked as resolved. |
Template Performance | Average major incident resolution time for the templates with the fastest resolution times. Hover over a template to view the average resolution time, number of executions, percent resolution rate, and the total number of actions for that template. The calculation for resolution rate is Completed / (Completed + Canceled). The bottom of the chart displays the name of the template with the fastest average resolution time, and the average resolution time across all templates. |
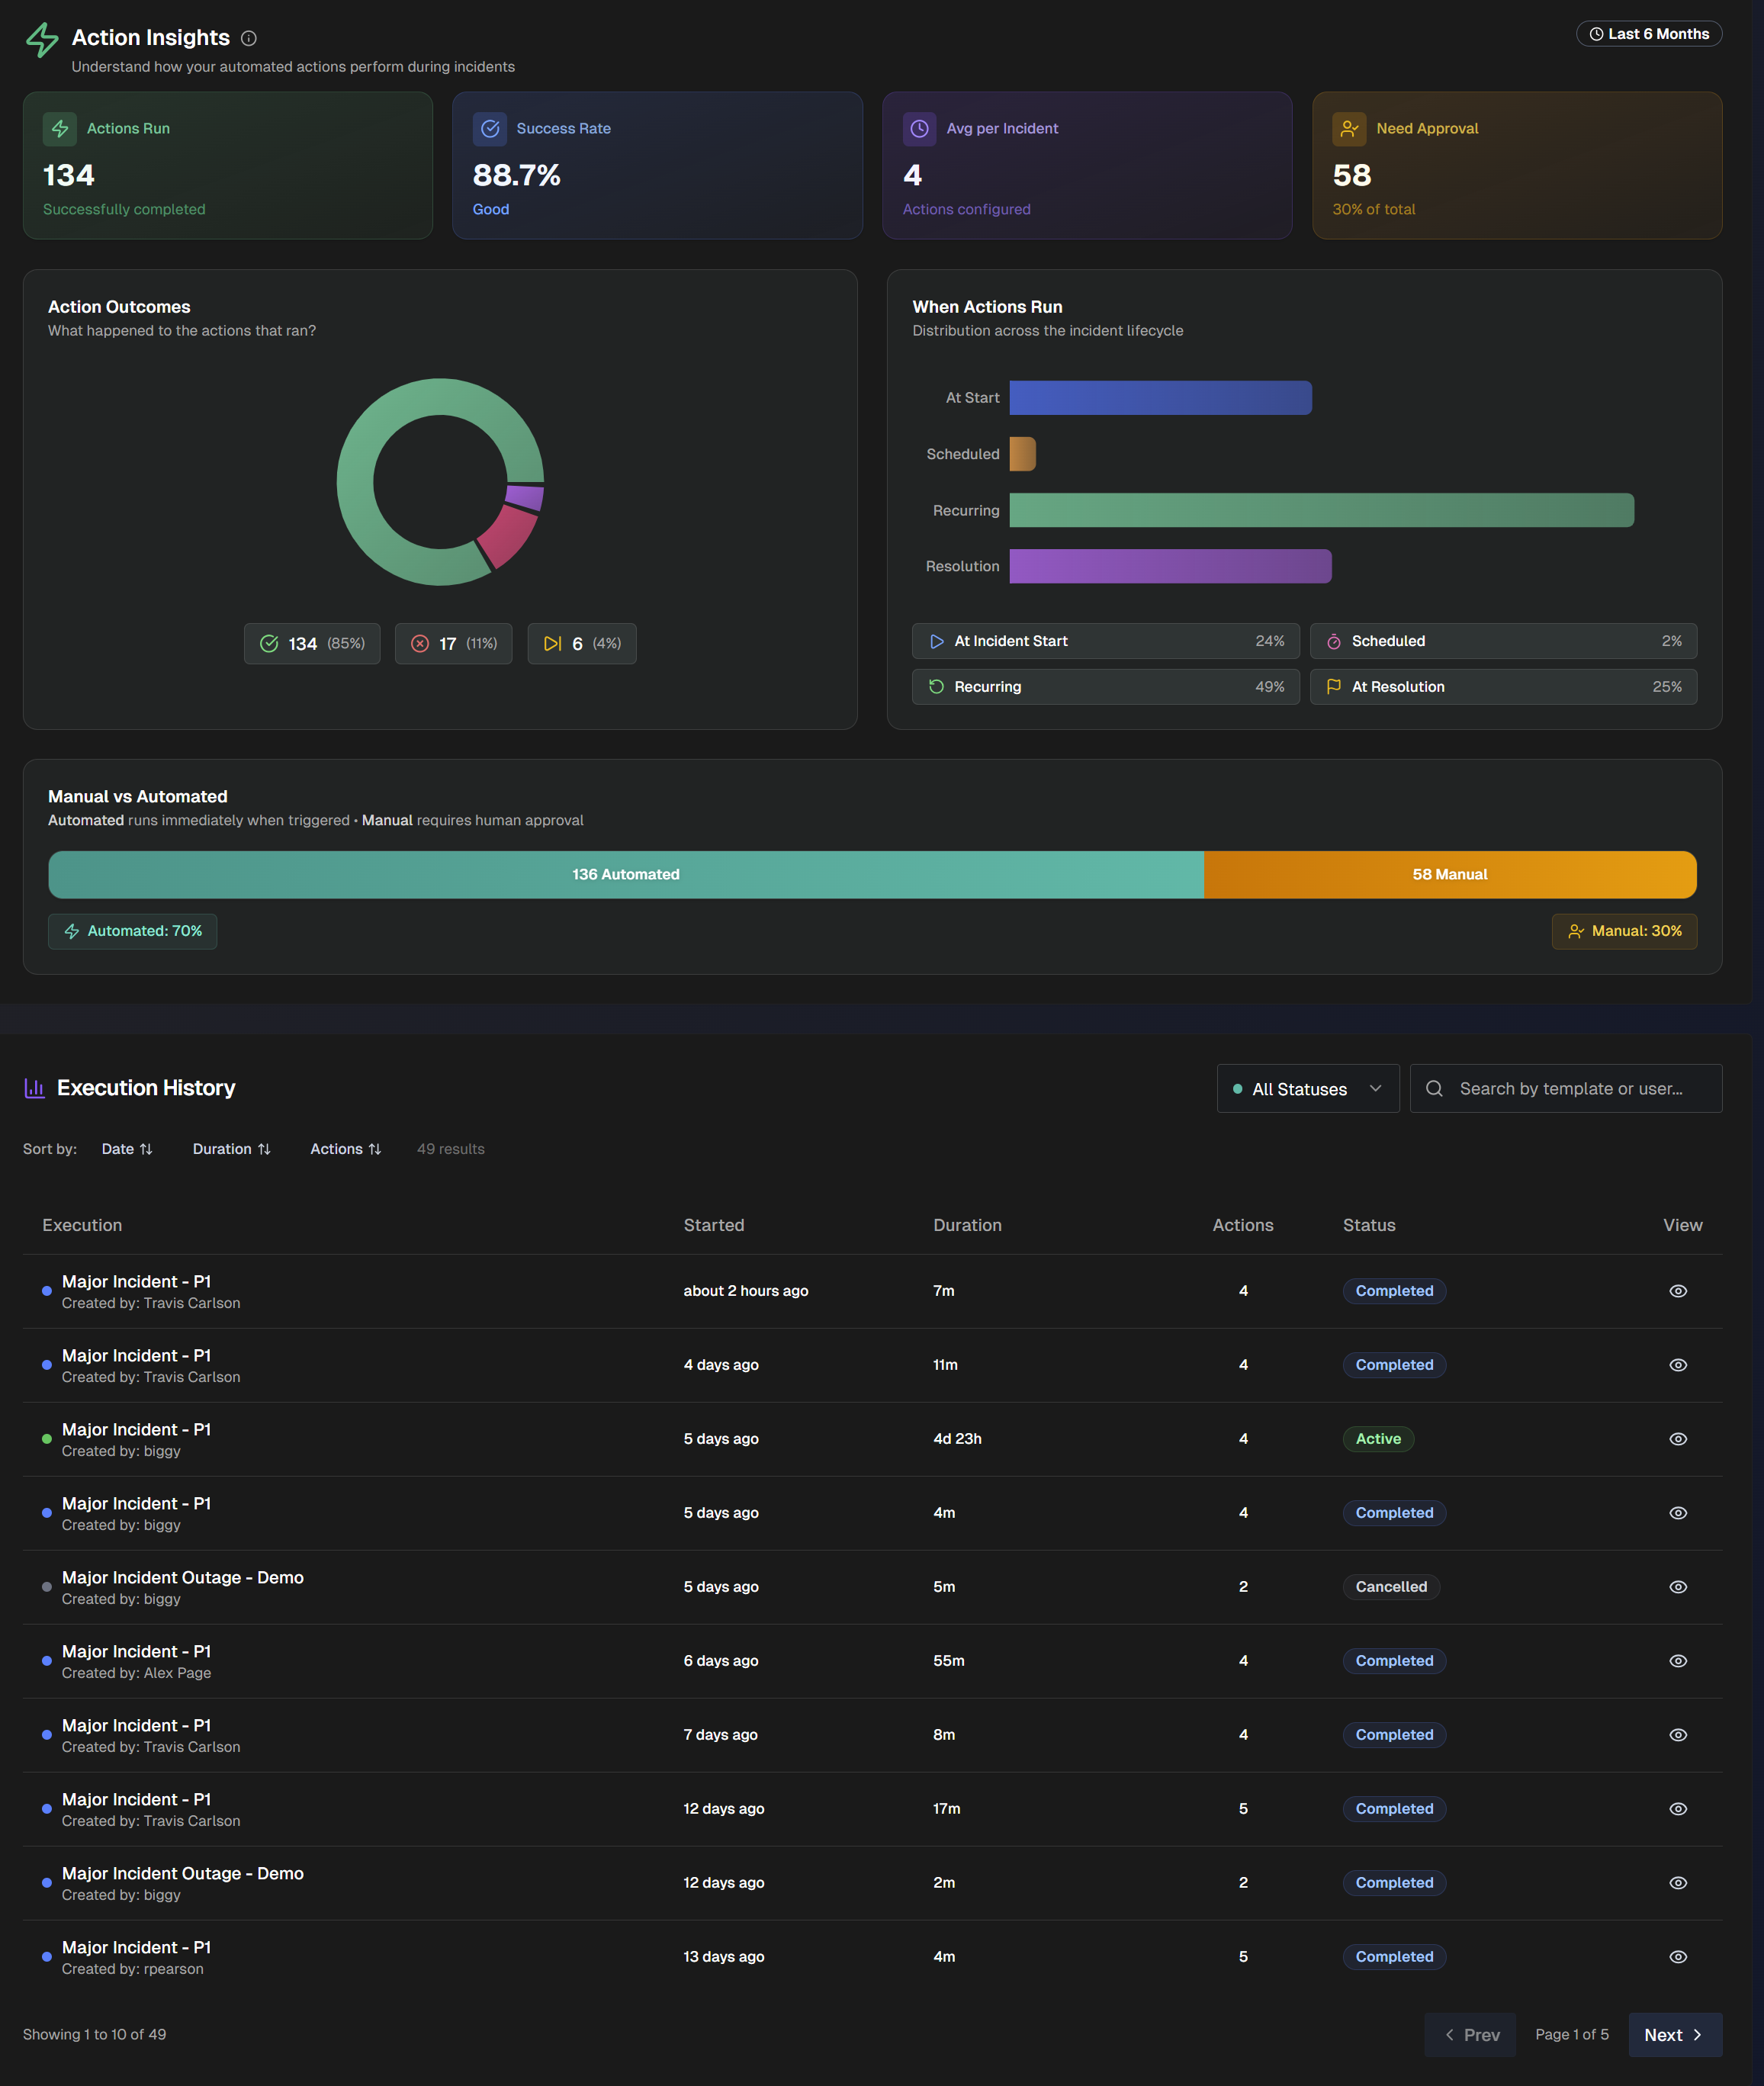
Use the Action Insights section of the page to understand how your automated actions perform during major incidents.
Actions
Actions are automated tasks that run during a major incident. See the MIM Templates documentation for more information.
The following widgets are available in the Action Insights section:
Widget | Description |
|---|---|
Actions Run | Number of actions that have successfully completed across major incidents. |
Success Rate | Percent success rate of actions across major incidents. |
Average per Incident | Average number of actions configured for each major incident. |
Need Approval | Number of actions that currently need human approval. |
Action Outcomes | Pie chart displaying the outcome of actions. (Completed, Failed, Skipped). |
When Actions Run | Displays at which point actions run across the incident lifecycle. The chart displays how many actions run at incident start, at a scheduled time, on a recurring basis, and at incident resolution. |
Manual vs. Automated | Distribution of actions that require human approval vs. automated actions. |
Execution History | Detailed list of each MIM execution. For each execution, the following information is displayed:
Click the View icon to view the execution in the MIM Executions dashboard. Sort the list by Date, Duration, or Actions. Filter the list by Status, or use the Search bar to find a specific execution. |