BigPanda MTTR Dashboard
The BigPanda MTTR (Mean Time to Resolve) Dashboard gives you visibility into trends and patterns in your organization’s BigPanda MTTR metrics. You can use this dashboard to see how your incident MTTR is trending, see the sources of your highest and lowest duration incidents, and find areas for improvement.
BigPanda MTTR calculation
BigPanda MTTR is calculated using the duration from when the BigPanda incident was resolved compared to when it opened.
Key Features
Visualize trends in your BigPanda MTTR.
Find the drivers in BigPanda MTTR improvement from a monitoring, environment, and incident share perspective.
Find the sources of your highest duration and short-lived incidents.
BigPanda MTTR Breakdown Widgets
The following widgets are available in the MTTR dashboard:
Actioned incidents
Only incidents where the is_actioned field is true are included in the MTTR metrics.
Widget | Description |
|---|---|
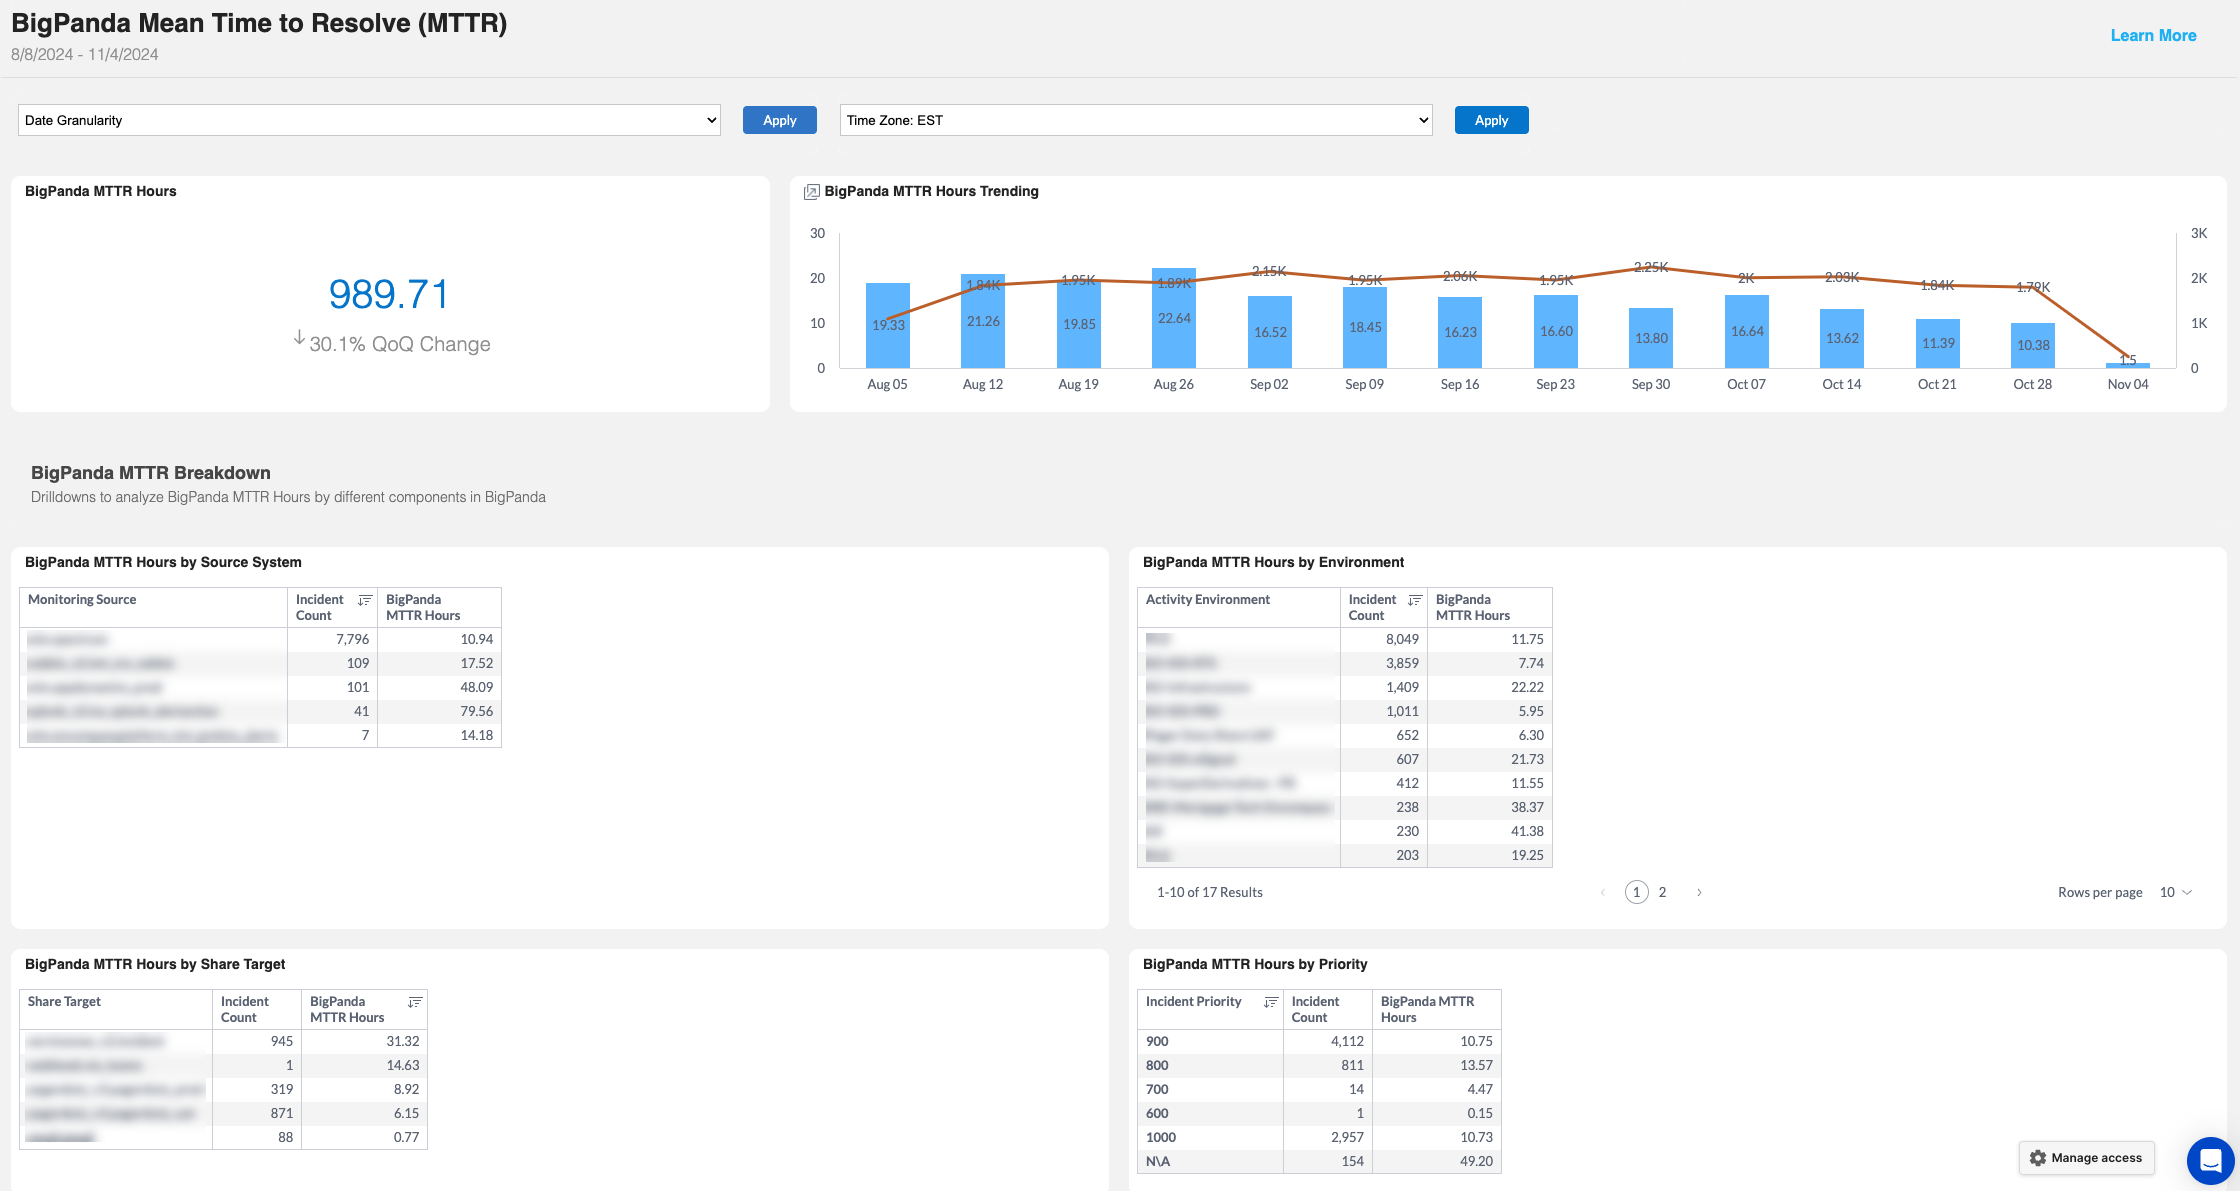
BigPanda MTTR Hours | The BigPanda MTTR in hours for the selected time frame, and the quarter over quarter change in MTTR. |
BigPanda MTTR Hours Trending | A bar chart showing the average BigPanda MTTR for each month in the selected time frame in hours. The red trend line displays the number of incidents over the time period. |
BigPanda MTTR Hours by Source System | Displays the incident count and BigPanda MTTR in hours for each source system. |
BigPanda MTTR Hours by Actioned Environment | Displays the incident count and BigPanda MTTR in hours for each BigPanda environment where the incident was actioned. |
BigPanda MTTR Hours by Share Target | Displays the incident count and BigPanda MTTR in hours for each share target. |
BigPanda MTTR Hours by Priority | Displays the incident count and BigPanda MTTR in hours for each incident priority level. |
Incident Resolution Buckets
The Incident Resolution Buckets section of the dashboard segments your incident resolution metrics into duration categories.
The following widgets are available in this section:
Widget | Description |
|---|---|
Incident Count Per Resolution Bucket Trending | A bar graph displaying the number of incidents in each BigPanda MTTR time frame for each month. The following time frames are tracked:
The purple trend line shows the average BigPanda MTTR in minutes. |
Incident Counts and Percent Per Resolution Bucket | Displays the incident counts and percentage of incidents in each BigPanda MTTR time frame by monitoring source. The following time frames are tracked:
|
Longest Duration Incident Buckets (Top 10 Sources) | A sankey diagram displaying the longest duration BigPanda MTTR timeframes and the corresponding monitoring sources. The 10 monitoring sources sending the largest number of incidents are displayed. The highest duration time frame buckets tracked in the sankey diagram are:
|
Shortest Duration Incident Buckets (Top 10 Sources) | A sankey diagram displaying the shortest duration BigPanda MTTR timeframes and the corresponding monitoring sources. The 10 monitoring sources sending the largest number of incidents are displayed. The lowest duration time frame buckets tracked in the sankey diagram are:
|
Incident Details
The Incident Details section displays the highest and longest duration incidents in table format. These widgets can be downloaded for external analysis.
The following widgets are available:
Widget | Description |
|---|---|
Highest Duration Incidents | Displays information about each of the incidents with the longest duration. The following information is displayed:
|
Shortest Duration Incidents | Displays information about incidents with the shortest duration. The following information is displayed:
|
Filters
The MTTR dashboard allows you to filter by:
Actioned incidents
Share target
Environment
Learn more about using filters and widget options in the Filter Dashboards documentation.
Next Steps
View Unified Analytics dashboards.
Learn how to Manage Unified Analytics.
Find definitions of Unified Analytics key metrics.
Dive into potential reporting fields in the Standard Data Model documentation.