Workflow Executions
The Workflow Executions section allows you to track how your Workflows are performing.
Workflow Executions is available in the web app at Operate > Insights > Workflow Executions.
Use the drop-down menu at the top right of the screen to adjust the selected time period.
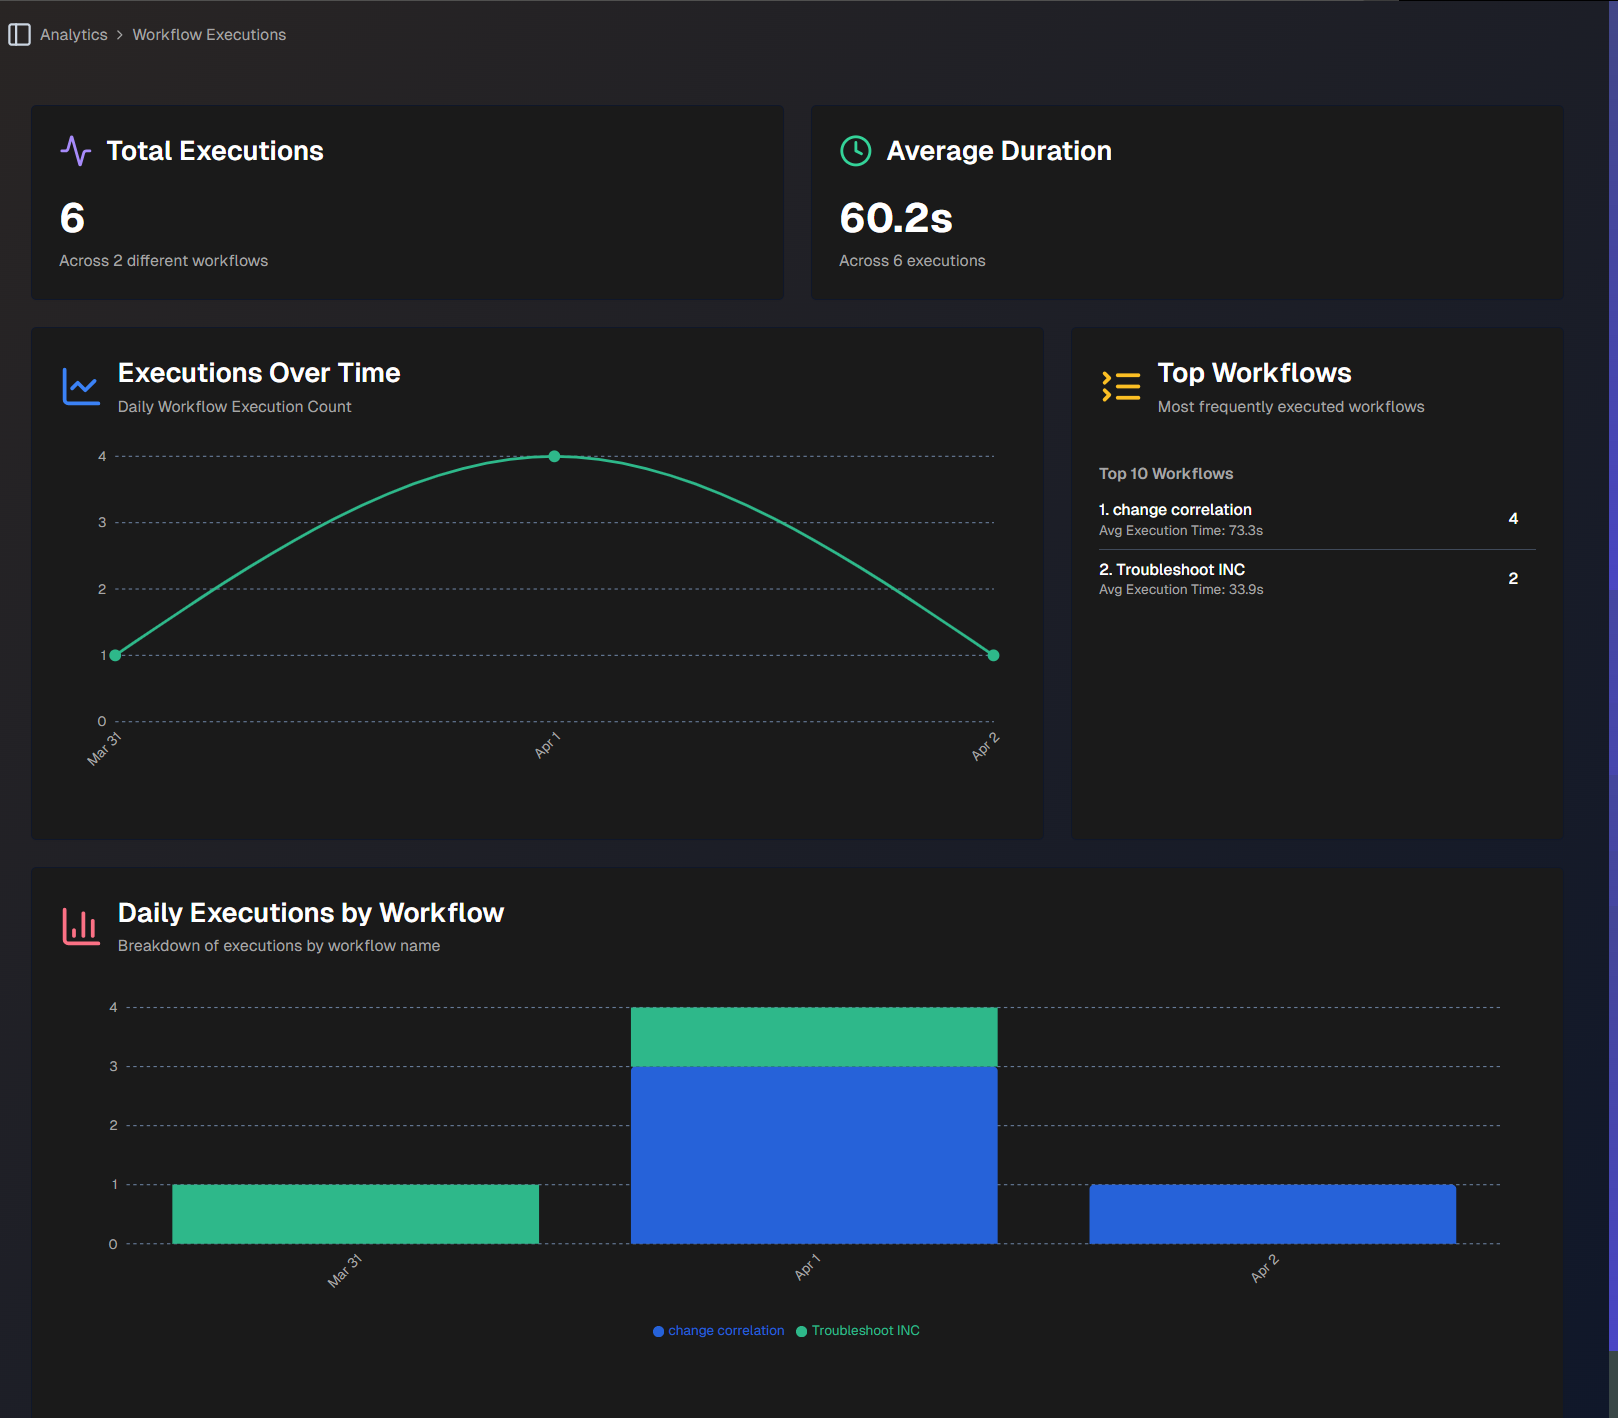
Workflow Executions
The page is divided into three tabs:
Workflow Runs
Workflows (Legacy)
ITSM Agents
Workflow Runs
The Workflow Runs tab is the default view of the Workflow Executions page. It reports on how your workflows are running across the selected time period. Use the drop-down menu at the top right of the screen to adjust the time period.
The following widgets are available in the Workflow Runs tab:
Widget | Description |
|---|---|
Total runs | The total number of workflow runs in the selected time period. |
Success rate | The percentage of runs in the selected time period that completed successfully. |
Failed | The number of runs that ended in a failed state. |
In flight | The number of runs that are currently in progress. |
Avg duration | The average length of time a run takes to complete. |
Runs over time | A daily bar chart of run volume by status, with each day's success rate overlaid as a line. The pills above the chart highlight the peak day and the average number of runs per day. |
Trigger mix | A donut chart showing what starts your runs. Each trigger type, such as On-demand or Message, displays the number of runs and its percentage of the total. |
Duration trend | A line chart of the average run duration for each day in the selected time period. |
Top workflows | The most active workflows in the selected range. Each workflow displays its total number of runs, its average duration, and a health status. |
Runs by workflow | A stacked area chart of daily run volume by workflow name, so you can see which workflows drive the load over time. |
Duration spread | A histogram of completed runs grouped into duration bands, from under 10 seconds to more than 5 minutes. |
When runs fire | A heatmap of run starts by weekday and hour, in Mountain Time. Recurring schedules appear as vertical stripes. |
Off-hours coverage | The share of runs that start outside standard business hours, defined as Monday through Friday, 9:00 AM to 6:00 PM Mountain Time. |
Recent Runs | A paginated list of the individual runs in the selected time period. Narrow the table by Trigger type or Status. The following information is displayed for each run:
|
Workflows (Legacy)
The Workflows (Legacy) tab tracks runs from the legacy workflows system. New workflows report to the Workflow Runs tab.
The following report widgets are available in the Workflows (Legacy) tab:
Widget | Description |
|---|---|
Total Executions | Total number of times that all of your workflows have been used. |
Unique Workflows | Total number of unique workflows, and the average number of times each has been used. |
Average Duration | The average number of time each workflow execution takes. |
Executions Over Time | Daily count of your workflow executions, over time. |
Top Workflows | Top 10 most frequently used workflows. Each workflow displays the number of times it was used, and the average execution time. |
Type Distribution | A pie chart comparing the types of workflows executed. Hover over a section of the chart to view the number of times the type of workflow was executed, and the percent of the total number of executions. |
Daily Workflow Type Trend | Displays trends in workflow executions over time, broken down by type. Hover over a specific section of the chart to view the number of workflows by type that were executed on that day. |
Daily Executions by Workflow | Breakdown of daily workflow executions by workflow name, over time. |
All Workflow Execution Metrics | Detailed statistics for all executions, by workflow. The following information is displayed for each workflow:
|
Recent Workflow Execution Results | The latest 500 workflow executions. At the top of the section, you can filter by Workflow Name, Workflow Type, or App Type. Click Export to CSV to download a CSV file containing the table. The following information is displayed for each workflow execution:
|
ITSM Agents
The ITSM Agents tab reports on how your ITSM trigger action rules are performing, including live automation and dry-run tests.
Use the controls at the top right of the screen to scope the data: the drop-down menu adjusts the time period, the All Teams menu filters by Biggy Team, and the All, Live, and Test toggle filters between live executions and test runs.
The tab is organized into a main performance area and a dedicated AI Field Updates section.
The following widgets are available in the ITSM Agents tab:
Widget | Description |
|---|---|
Total Executions | The total number of executions in the selected time period, along with the number of active rules that produced them. |
Success Rate | The percentage of executions that completed successfully, along with the number that failed out of the total attempted. |
Average Duration | The mean agent action time across all executions. |
Status breakdown | A strip of chips summarizing execution counts by status: Completed, Skipped, Failed, Timed Out, and Dry Runs. |
Processing Funnel | A stage-by-stage funnel from detection to delivery. Each stage, such as Records evaluated, Materially changed, Passed condition gate, and Output delivered, displays the number of records that reached it and its percentage of the total, so you can see where records drop off. |
Executions Over Time | A daily area chart that breaks down execution outcomes over time. Use the Chart series legend above the chart to show or hide outcome types, such as Completed, Skipped (Condition), Skipped (Output Gate), Skipped (No Change), Failed, and Timed Out. |
Top Rules | The most frequently executed rules in the selected range. Each rule displays its average duration, its success rate, and its total number of executions. |
Outcome Distribution | A donut chart showing the proportion of executions by outcome. The legend lists each outcome with its execution count and percentage of the total. |
Duration Trend | A line chart of the average execution time for each day in the selected time period. |
Where Time Goes | A breakdown of the mean latency per processing stage, such as Condition gate, Attachments, Agent action, Output gate, Format outputs, Deliver outputs, and Field updates. Each stage displays its average duration as a horizontal bar. |
Top Failure Reasons | Failures grouped by error and ordered by frequency. Each entry displays the error message, the number of times it occurred, and when it was last seen. |
Daily Executions by Rule | A stacked area chart of daily execution volume by rule name, so you can see which rules drive the load over time. |
Runner Type | A breakdown of executions by the agent runner that carried them out, such as an orchestrator or a custom agent. |
Trigger Source | A breakdown of executions by how they were started, such as automated runs or manual test runs. |
Output Delivery | A summary of output delivery results, broken down into Delivered, Skipped, and Failed. The By Channel section lists each delivery channel, such as Work Note, Email, and Comment, with its sent, skipped, and failed counts. |
Rule Performance | A table of detailed metrics for every trigger action rule. The following information is displayed for each rule:
|
Team Performance | A table of execution volume and outcomes for each Biggy Team. Each row displays the team name, along with the same Total, Completed, Skipped, Failed, Success %, and Avg duration columns as the Rule Performance table. |
Total field updates attempted | In the AI Field Updates section, the total number of individual field and tag evaluations in scope. |
Apply success rate | In the AI Field Updates section, the percentage of attempted field writes that were successfully applied, out of the total attempted. |
Most common field updated | In the AI Field Updates section, the field with the most update attempts. |
Most common tag added | In the AI Field Updates section, the tag added most often. Displays a dash when there are no tag-type updates yet. |
Field update status | In the AI Field Updates section, a donut chart showing the proportional mix of field update statuses: No Change, Applied, Failed, Skipped, and Dry Run. The legend lists each status with its count and percentage of the total. |
Top fields by update count | In the AI Field Updates section, a bar chart of up to five fields with the most update attempts. |
Confidence distribution | In the AI Field Updates section, a horizontal stacked bar that groups field updates by confidence level: Certain, High, Medium, and Low. |
Execution History | A paginated table of all trigger action executions across rules. Filter the table with the All statuses menu, the All rules menu, or the Search record field. The following information is displayed for each execution:
|