Usage
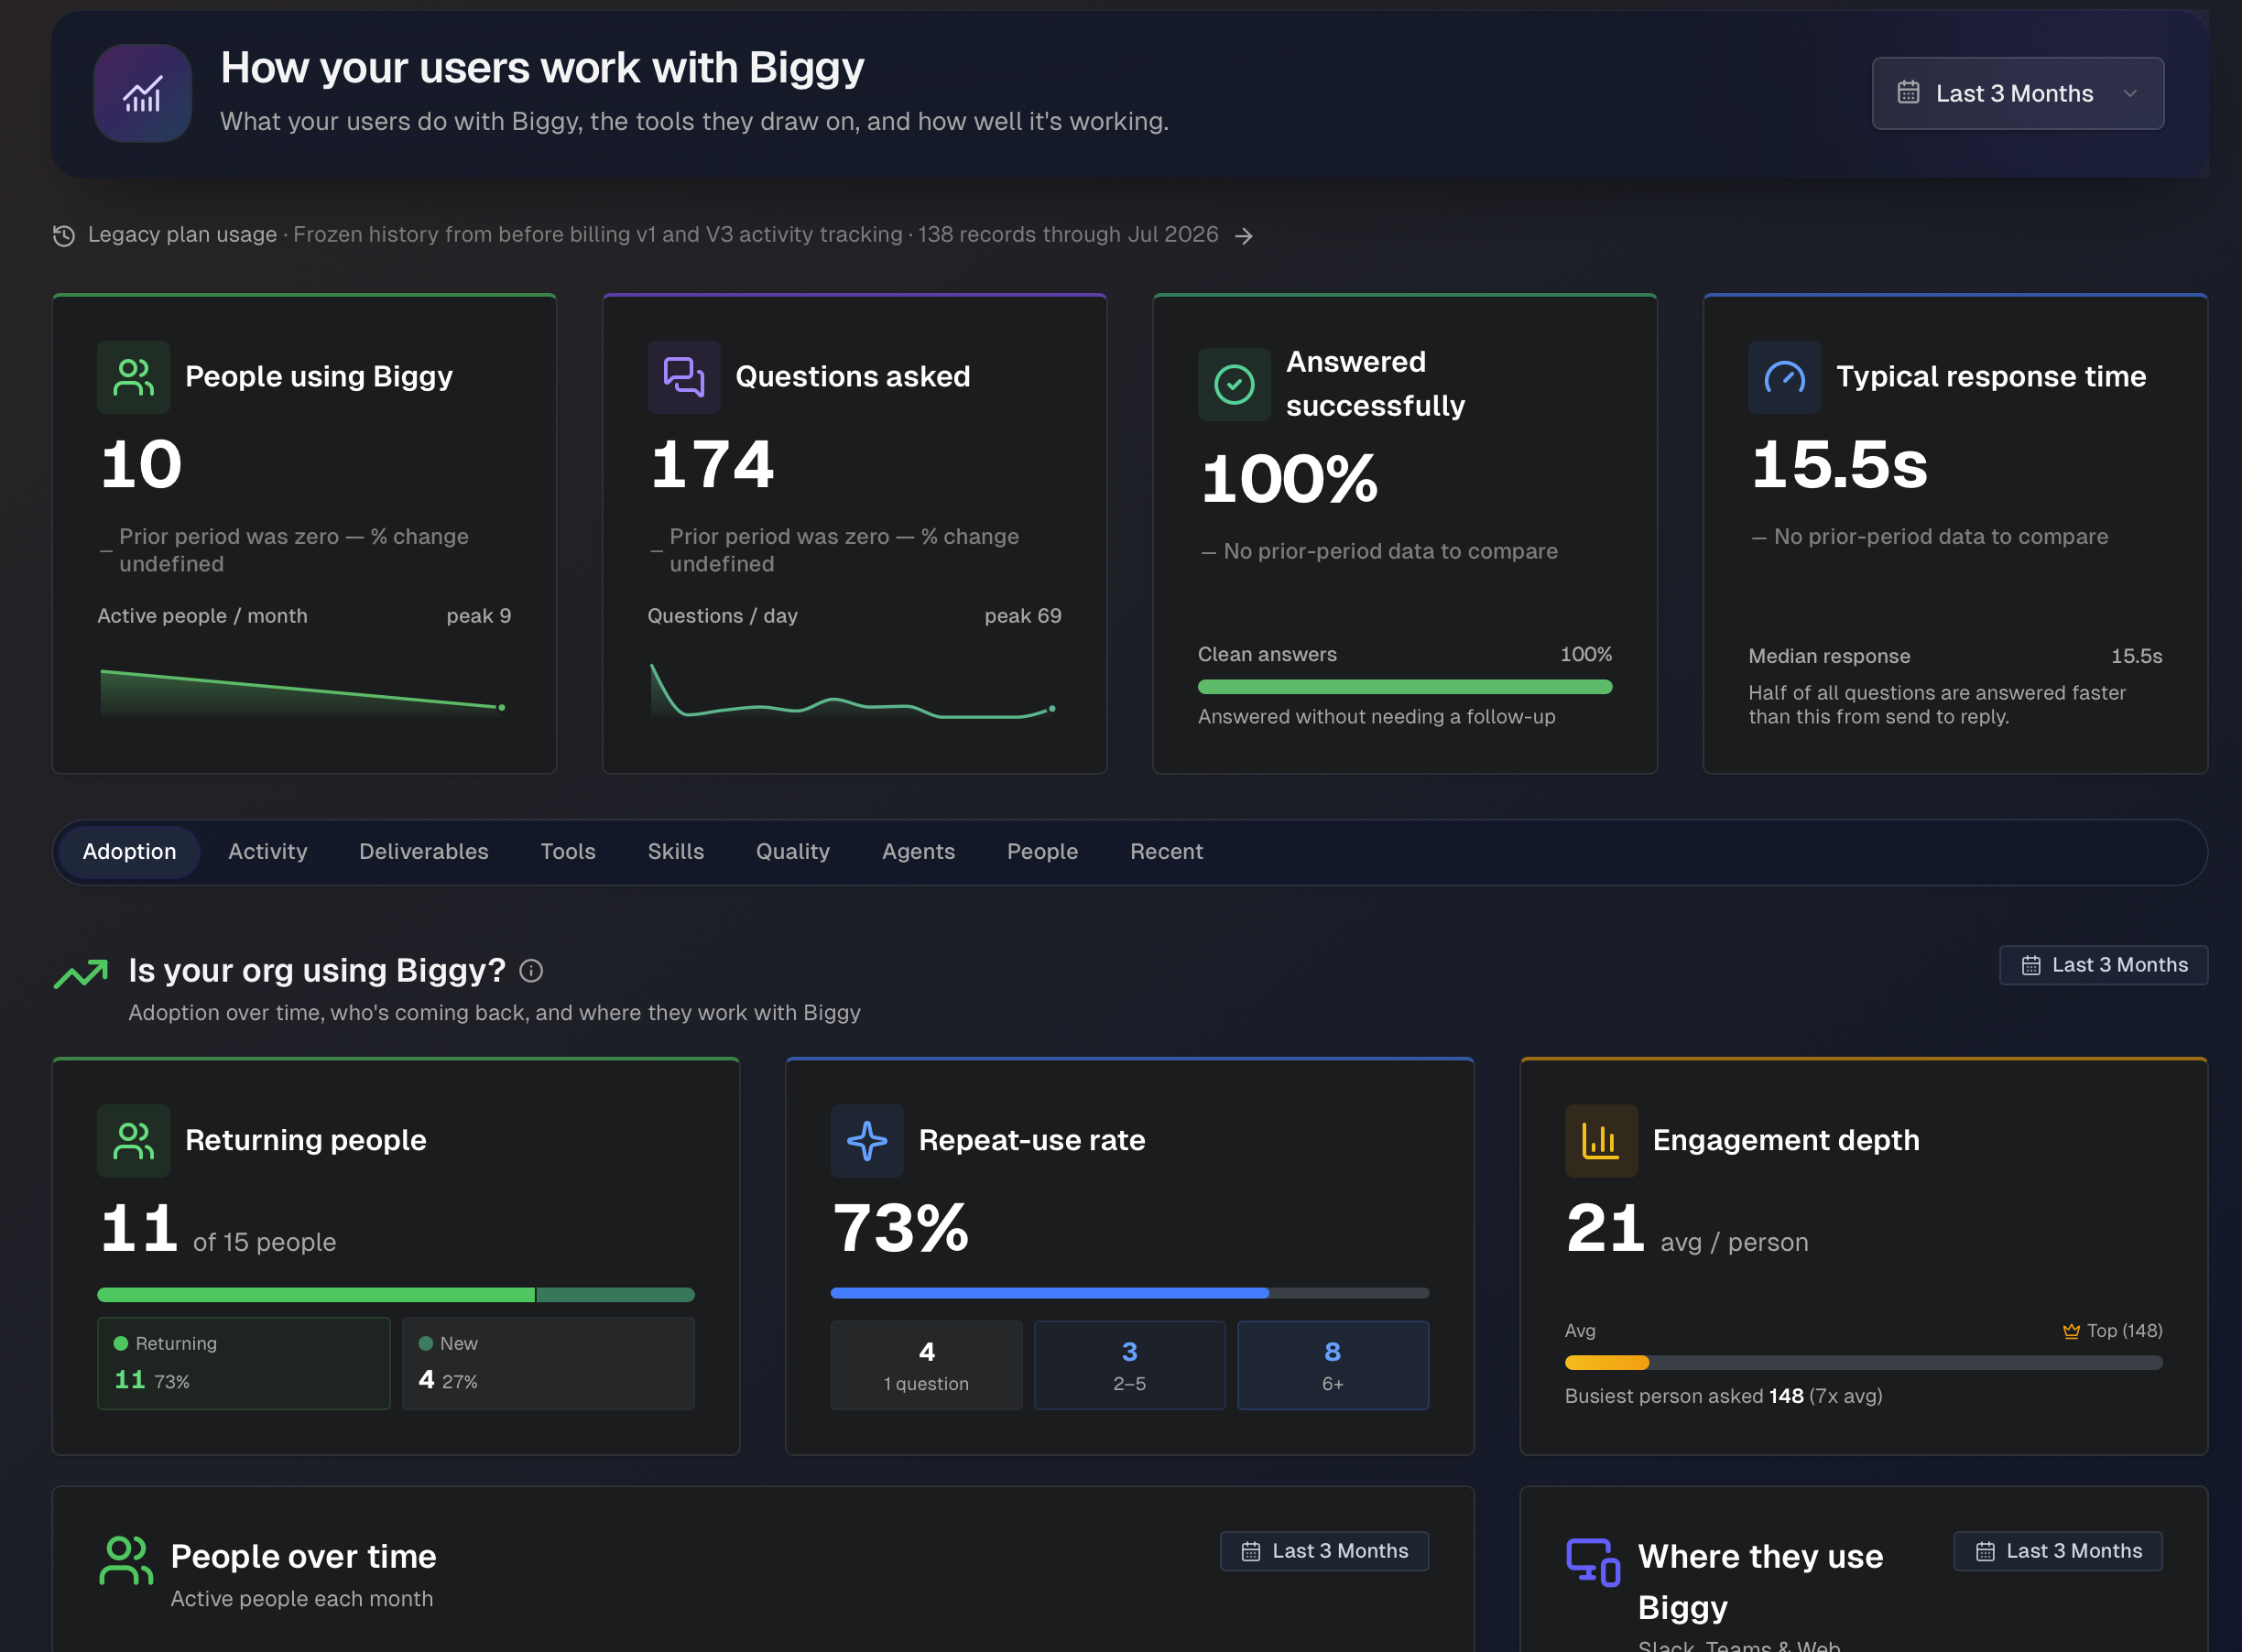
The Usage page shows how your organization uses Biggy, including who uses it, what activities they use it for, the tools and skills Biggy uses, and how quickly and successfully it responds. Use this page to track adoption, identify active people and teams, and review the deliverables Biggy creates. Click the tabs to navigate between sections of the Usage page.
To open the page, in the web app, go to Operate > Insights > Usage.
Key features
Track adoption over time, including returning people, repeat usage, and the platforms where people use Biggy.
Review how your organization uses Biggy by category and over time.
Review the deliverables Biggy created, such as incident reports, root cause analyses, and executive summaries.
See which connected tools and skills Biggy draws on to answer questions.
Review response success and speed, and identify the most active people and teams.
Browse and export a detailed log of every interaction.
Change the time period
For each section of the Usage page, use the time-period selector in the upper-right corner to change the date range. For example, select Last 3 Months to view activity from that period.
Summary Metrics
The page header summarizes your organization's worked Biggy usage during the selected period. The following metrics are displayed:
Metric | Description |
|---|---|
People using Biggy | The number of unique people who used Biggy and the highest monthly number of active people during the selected period. |
Questions asked | Total number of questions sent to Biggy, with a daily trend line and the peak number of questions on a single day. |
Answered successfully | The percentage of questions that Biggy completed without requiring a retry, clarification, or follow-up. |
Typical response time | The median time between a submitted question and Biggy’s response. Half of the responses were faster, and half were slower. |
Legacy plan usage
The Legacy plan usage page shows frozen historical usage recorded before the current V3 activity tracking.
At the top of the Summary Metrics section, click the Legacy plan usage link to open the page. A badge in the top-right of the page shows the number of records and the date range they cover. Click Back to usage to return to the Usage page.
The following widgets are available:
Widget | Description |
|---|---|
Legacy plan mix | A donut chart showing the share of questions by legacy plan. The center displays the total number of questions in the period. Hover over a segment to view the question count for that plan. |
Legacy plans by volume | A table of legacy plans ranked by question volume. For each plan, it shows the plan name, the number of questions, and the date the plan was last seen. |
Legacy plan usage over time | A stacked area chart of weekly request volume, with one colored band per legacy plan. The horizontal axis shows the week and the vertical axis shows the number of requests. Hover over the chart to view the dates for a point on the horizontal axis. Use the legend below the chart to identify each plan, and select Show more or Show less to expand or collapse the full list of plans. |
Frozen historical data
The Legacy plan usage page is a read-only snapshot. These records do not update and are kept for historical reference only.
Adoption
The Adoption tab opens the Is your org using Biggy? section.
This section shows usage over time, returning and new people, and the platforms where people use Biggy. The following widgets are available:
Widget | Description |
|---|---|
Returning people | Number of people active during the period, split into returning and new, with counts and percentages for each. |
Repeat-use rate | The percentage of people who used Biggy more than once, with usage grouped into the number of questions asked. (1 question, 2-5 questions, and 6 or more questions.) |
Engagement depth | The average number of questions per person, with the most active person compared with the organization average. |
People over time | Active people each month, shown as a chart. The summary below the chart shows the total and daily average for the selected period, the peak day, and the most recent day. |
Where they use Biggy | Distribution of questions across Slack, Microsoft Teams, and the web app, shown as a donut chart. |
Questions over time | A chart showing daily question volume during the selected period. Summary metrics show the total and daily average, the peak day, and the previous day's question count. |
Web chat | A chart showing web chat sessions and messages during the selected period. Summary metrics show the total number of sessions and messages and the average number of messages per session. |
Activity
The Activity tab opens the What your organization uses Biggy for section. The following widgets are available:
Widget | Description |
|---|---|
Category breakdown | A donut chart and ranked list of work categories, such as General chat, Ticketing, Incident response, Observability, On-call, Root cause analysis, and Reports. Each category shows its question count and percentage of the total. |
Over time | An area chart showing how the mix of work changes from week to week. Select Mix to view the categories as a stacked area chart, or select Compare to view each category as a separate trend line. Select a category in the legend to highlight it. |
Deliverables
The Deliverables tab opens the What Biggy Created section. This section shows the reports, summaries, tickets, and other content Biggy created. It groups deliverables into counts, large-context analyses, and transcribed calls.
Deliverable counts
Each card shows the number of deliverables Biggy created during the selected period:
Incident reports
Root cause analyses
Executive summaries
Postmortems
Status updates
Drafted tickets
Large-context analyses
The Large-context analyses widget shows the number of multi-source analyses Biggy created, grouped by type. Types include Problem Discovery, Incident Analysis, Dataset Insights, and Multi-Context, each with its share of the total.
Calls transcribed
The Calls transcribed section summarizes the meeting and incident calls Biggy transcribed:
Widget | Description |
|---|---|
Calls Transcribed | Total number of calls transcribed, the monthly average, and the trend compared to prior months. |
Transcription Value | Total hours transcribed, average length per call, the percentage indexed for search, and how many transcripts came from an incident or major incident. |
Peak Hours | The hour of day with the most call activity, with a breakdown of scheduled versus ad-hoc calls. |
Tools
The Tools tab opens the Your connected tools at work section. This section shows which connected tools Biggy used, grouped by function. A summary at the top shows the number of investigations that used multiple tools.
Tool usage is grouped into categories such as monitoring and observability, ticketing, on-call and communications, knowledge sources, and other tools. Each group lists the individual tools and actions Biggy used, along with how many times it used each.
Your groups depend on your connectors
The tools shown in each group reflect the integrations your organization has set up. See the Integrate With AI Incident Assistant documentation for more information about connecting tools.
Skills
The Skills tab opens the How your users leverage skills section. This section shows which skills Biggy uses, how their usage changes over time, and who uses them. The following widgets are available:
Widget | Description |
|---|---|
Skill usage | A donut chart showing total skill uses and a ranked list of individual skills, each with its use count and percentage of the total. |
Over time | A chart showing how skill usage changes from week to week. Switch between the Mix and Compare views, and select a skill in the legend to highlight it. |
Which users use which skills | A matrix showing how often each person used each skill. |
Quality
The Quality tab opens the How well Biggy is working section. This section shows response success, response time, and the balance between quick and in-depth responses. The following widgets are available:
Widget | Description |
|---|---|
Answered successfully | Percentage of questions answered without needing a follow-up, out of the total questions asked. |
Response time | The typical (median) and the slowest response time in the period. |
Quick vs in-depth | Split between quick answers and in-depth answers, with a count for each. |
Agents
The Agents tab opens the Your custom agents section. This section shows the custom agents your team uses. Each custom agent your organization has configured appears here, along with how much it is used.
People
The People tab opens the People & teams section. This section shows who uses Biggy most and how usage varies across your organization. A banner shows the percentage of questions driven by your top people.
Widget | Description |
|---|---|
Top people | A leaderboard of the top 10 people by question volume. |
Engagement patterns | A chart that groups people into four personas based on activity. The horizontal axis shows total queries and the vertical axis shows active days. Each circle represents a person. Larger circles represent more queries per active day, and color indicates the engagement category. Hover over a person to view their total queries, active days, intensity, and when they were last active. The four personas are:
|
Team Usage Analytics
The Team Usage Analytics table breaks usage down by team. For each team, it shows the number of users, Biggy queries, reports generated, total activity, and average total per user. Click any column header to sort by that value, or use the download icon to export the table.
Create teams to group usage
If you have not created any teams, all activity appears under a single unassigned row. To group usage by team, create teams in General Settings. See the Teams Management documentation for more information.
Recent
The Recent tab opens the All Usage table, a detailed, filterable log of interactions across all of your users. The following columns are displayed:
User: The person who asked the question.
User Query: The full text of the question.
Activity: The activity type and the tools Biggy used to answer.
Effort / Timing: How long the response took, the number of steps, and the investigation depth, such as a focused investigation.
Date: The date and time of the question.
Response: Biggy's response to the question.
Use the filters above the table to narrow the results by User, Activity, Tool, Depth, Platform, and Team. Use the pagination controls at the bottom of the table to move between pages and set the number of rows per page.
Export the log
Click Export to CSV to download the current view for reporting or offline analysis.