On-Call Analytics
Track performance for your on-call program on the On-Call Analytics page. Visualize data on paging volume, response and resolution times, escalation containment, team and responder load, and notification delivery health.
Review on-call analytics to spot where pages pile up, where acknowledgments are slow, where delivery is failing, and drill into the exact incidents behind the numbers. You can also schedule recurring reports and generate recommendations for tuning your escalation paths.
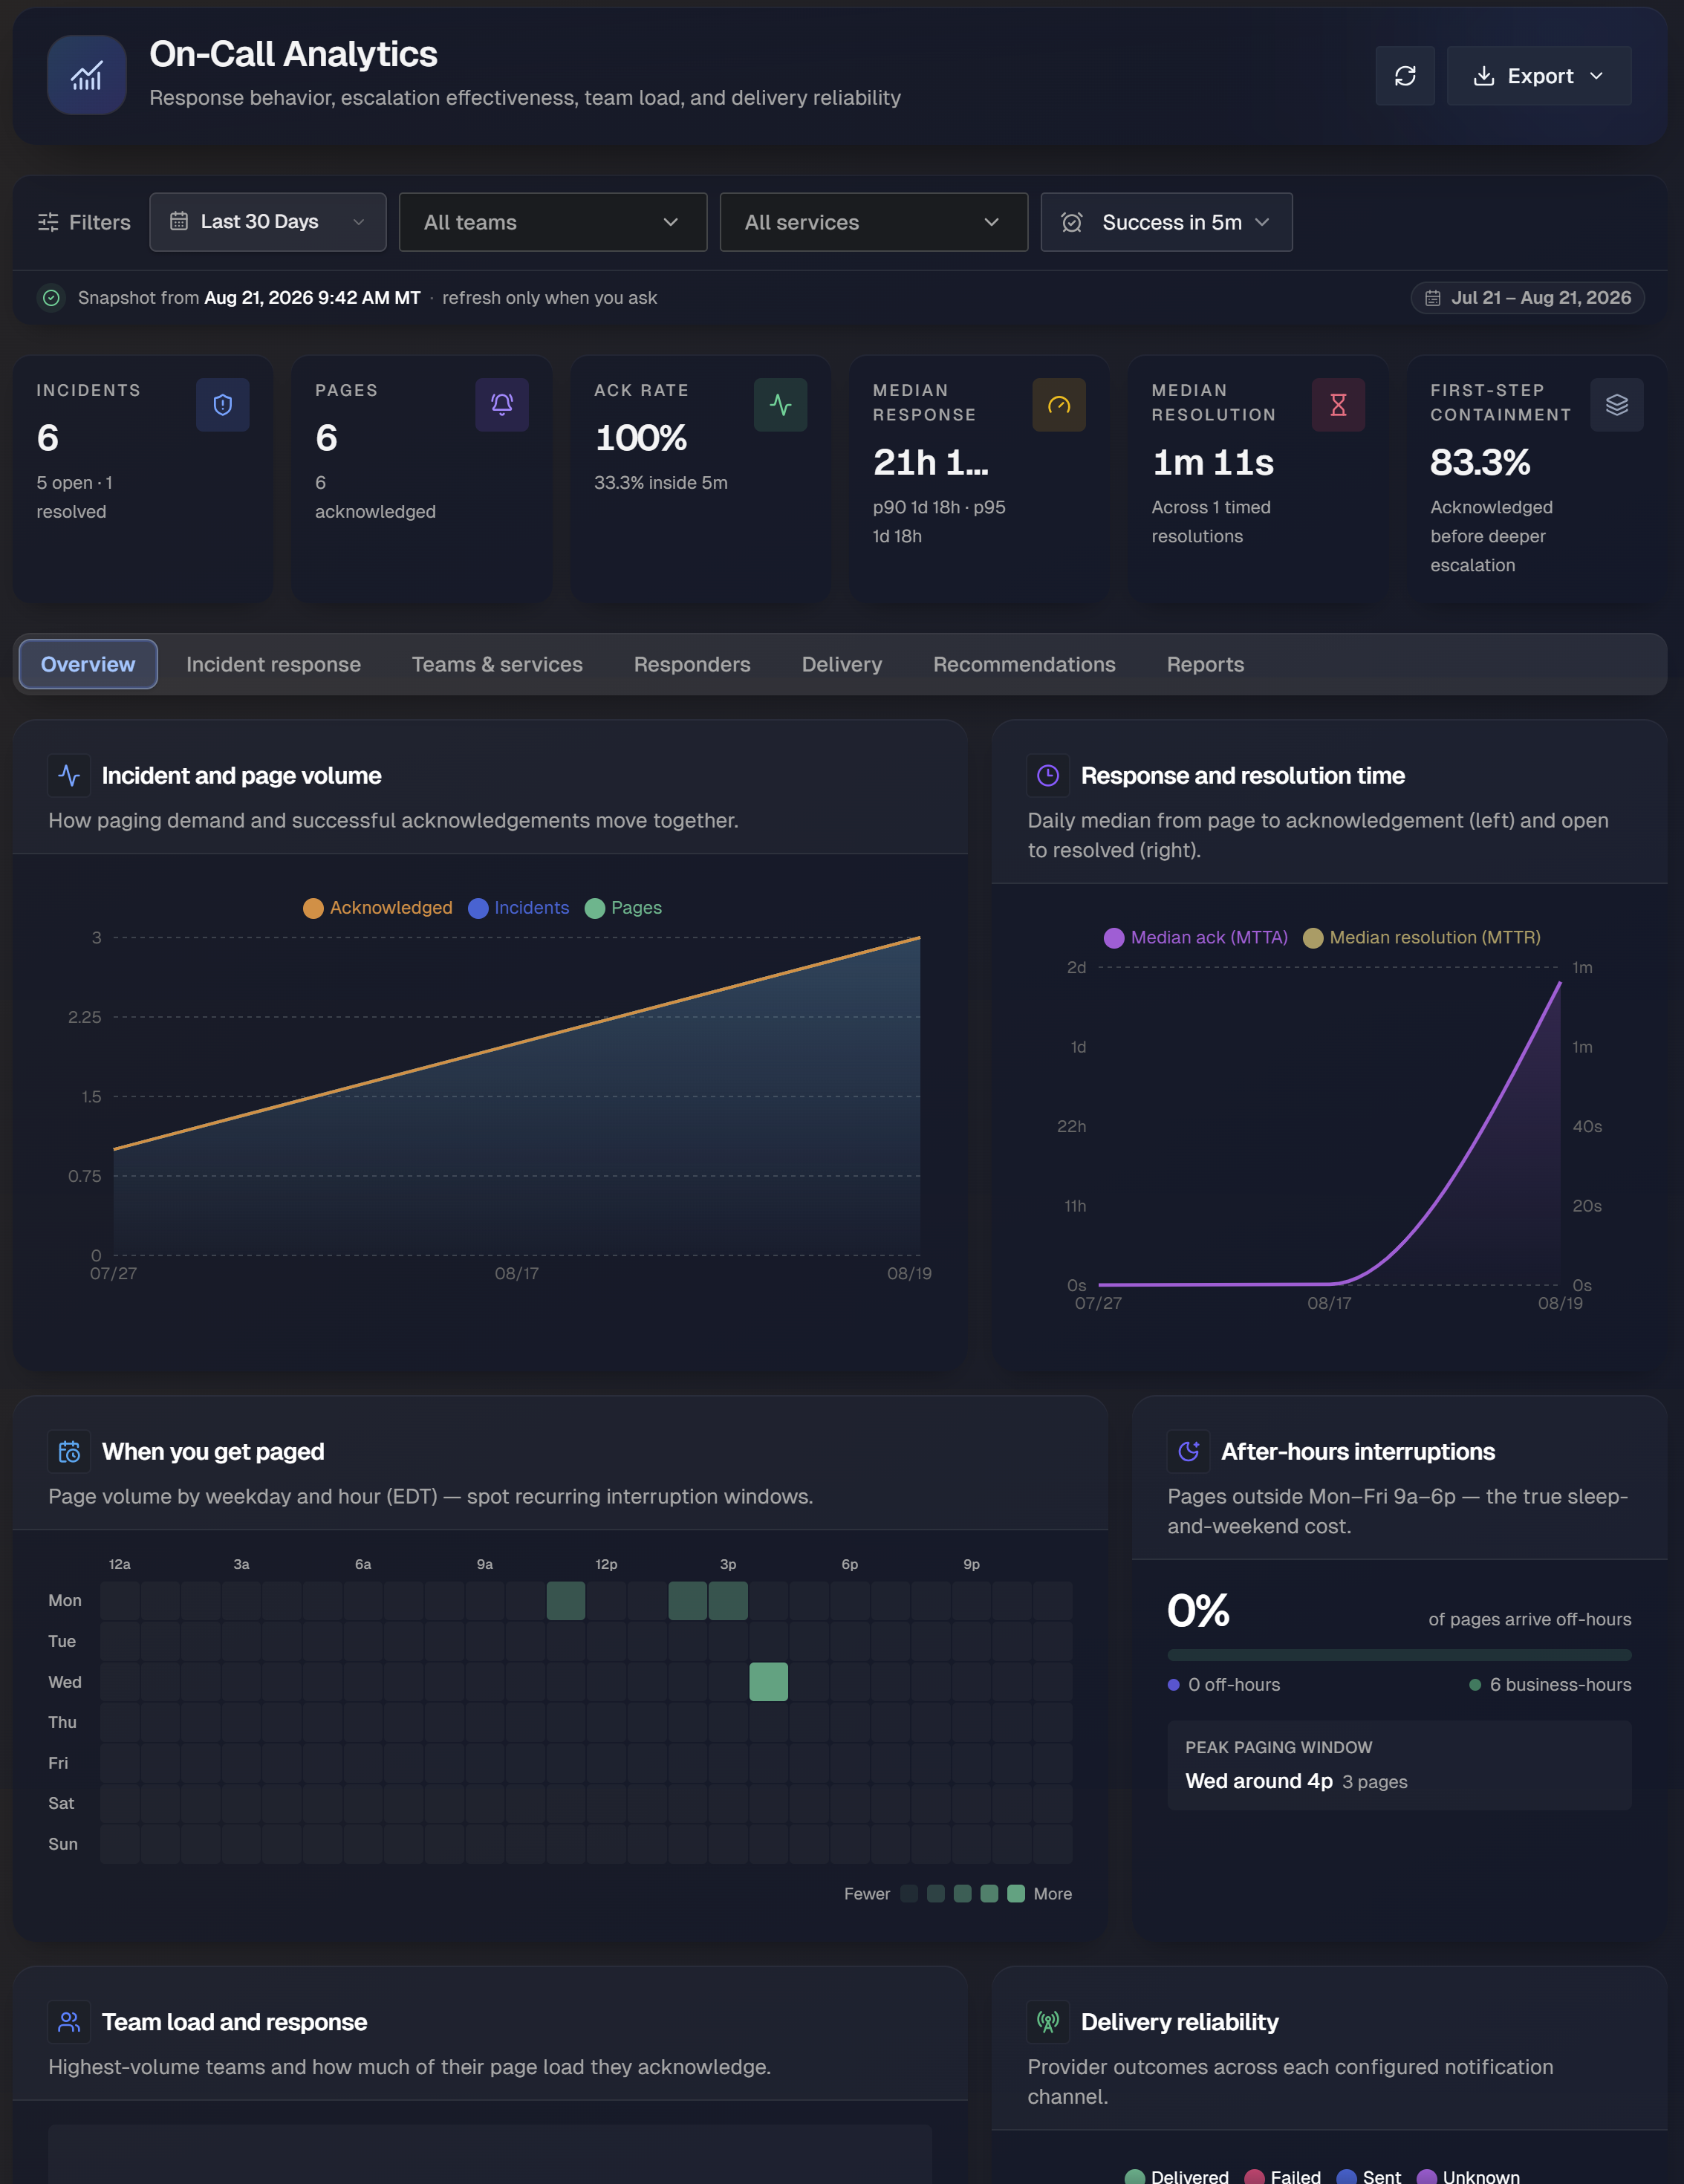
Access on call analytics in the web app at Operate > On-Call > Analytics.
Key Features
View metrics for incidents, pages, acknowledgment rate, response time, resolution time, and first-step containment.
Analyze response behavior across seven tabs: Overview, Incident response, Teams & services, Responders, Delivery, Recommendations, and Reports.
Drill from organization-wide trends into individual incidents, pages, and delivery history.
Generate escalation-path recommendations grounded in observed response outcomes.
View the dashboard
In the sidebar, under On-Call, select Analytics. The page header shows the dashboard title, a Refresh button, and an Export menu.
The dashboard loads as a snapshot rather than a live stream. The header shows the snapshot time. To pull the latest data, click the Refresh button.
To download the current view, open the Export menu and choose a format. Exports are available as CSV, Excel, and PDF.
Filters and scope
The filter applies to every chart and table on the page. Set the following filters:
Date range: The reporting window, for example
Last 30 Days.Teams: Limit results to one or more teams, or leave set to
All teams.Services: Limit results to one or more services, or leave set to
All services.Success target: The fast acknowledgment time, shown here as
Success in 5m. This target drives the inside-target figure for the acknowledgment rate metric and the highlighted band in the acknowledgment time distribution.
Summary metrics
A row of metric cards sits above the tabs and reflects the current filters. Each card summarizes one dimension of on-call performance.
Metric | What it shows |
|---|---|
Incidents | Total incidents opened in the range, split into open and resolved. |
Pages | Total pages sent in the range, with the number of pages acknowledged. |
Ack rate | The percentage of pages that were acknowledged, with the share acknowledged inside the success target. |
Median response | The median time from page to acknowledgment, also called median time to acknowledge (MTTA), with p90 and p95 percentiles. |
Median resolution | The median time from incident open to resolved, also called median time to resolution (MTTR), across incidents with a recorded resolve time. |
First-step containment | The percentage of pages acknowledged at the first policy step, before escalating to a deeper step. |
Dashboard tabs
The dashboard is organized into seven tabs:
Select a tab to manage the widgets shown below the metric cards.
Overview
The Overview tab summarizes paging demand, response speed, timing patterns, team load, and delivery health.
Widget | What it shows |
|---|---|
Incident and page volume | How paging demand and successful acknowledgments move together over the range, plotting acknowledged pages, incidents, and pages. |
Response and resolution time | The daily median from page to acknowledgement and from incident open to resolved, plotting median ack (MTTA) and median resolution (MTTR). |
When you get paged | A weekday-by-hour heatmap of page volume that helps you spot recurring interruption windows. The hour axis follows the displayed timezone. |
After-hours interruptions | The share of pages that arrive outside standard business hours (Monday to Friday, 9 a.m. to 6 p.m.), with a business-hours versus off-hours split and the peak paging window. |
Team load and response | The highest-volume teams and how much of their page load they acknowledge. This widget fills in as soon as at least one team receives a page. |
Delivery reliability | Provider outcomes across each configured notification channel, with delivered, failed, sent, and unknown results. |
Incident explorer | A drill-down table from organization trends into the exact teams, pages, and delivery history. The Incident Explorer table also appears in the Incident Response tab. |
Incident response
The Incident response tab focuses on response effort concentrates and how pages move through your escalation policies.
Widget | What it shows |
|---|---|
Incidents by priority | Where response effort concentrates, with median ack and resolution per priority tier. |
Where incidents come from | The mix of incident sources, such as BigPanda-correlated, major-incident, and manually raised incidents. |
Acknowledgment time distribution | How quickly pages are picked up, bucketed by time to acknowledge and measured against the success target. |
Escalation funnel | How many pages reach each policy step and how many stop there acknowledged, comparing pages reaching a step with pages acknowledged at that step. |
Teams & services
The Teams & services tab compares assignment-group and service behavior, and shows data coverage for the underlying data.
Widget | What it shows |
|---|---|
Team response | Assignment-group page load, acknowledgment, and escalation behavior. |
Slowest to acknowledge | Teams with the highest median time from page to ack. |
Service noise | Services creating the highest response burden and deepest escalations. |
Noisiest services | Services with the highest number of pages per incident, which can help identify candidates for tuning. |
Escalation pressure | Teams whose pages most often travel past the first responder. |
Paging load balance | How evenly page volume is spread across teams. |
Coverage and data trust | How complete the underlying data is, since low coverage means metrics undercount. It reports the share of pages linked to incidents and the share of resolved incidents that have a recorded resolve time. |
Responders
The Responders tab shows each paged responder's response metrics, designed to attribute outcomes fairly rather than label individuals.
Widget | What it shows |
|---|---|
Responder reliability | Every paged responder's response mix, ranked worst-first by reliability score, including pages, acked, declined, no response, delayed acks, and median response. Open pages stay pending and never count against anyone. |
Responder load and response | Who acknowledges the most pages and how their volume compares, plotting acknowledged pages against total pages. |
Responder contribution | Acknowledgment ownership and response speed for engaged responders, including incidents, pages, ack rate, median response, and escalated pages. |
Delivery
The Delivery tab reports how reliably notifications reach responders across each channel.
Widget | What it shows |
|---|---|
Delivery health over time | Daily notification volume with the share that reached responders, plotting delivery attempts against success rate. |
Delivery reliability | Provider outcomes across each configured notification channel, with delivered, failed, sent, and unknown results. |
Channel scorecard | Exact provider outcomes for every configured notification channel, with queued, sent, delivered, unknown, and failed counts plus a success rate per channel. |
Recommendations
The Recommendations tab provides suggestions to improve coverage and responsiveness. The proposals are grounded in observed engagement outcomes. When a ServiceNow connection is configured, recommendations also take your ServiceNow routing into account.
Nothing is applied automatically. Review each proposal and make any changes yourself in the policy editor.
To produce recommendations for the currently selected window, click Generate recommendations. To refresh them after changing filters, click Regenerate.
Each recommendation includes a title, a confidence score, a plain-language summary, a proposed change, supporting evidence, and tags that categorize the finding. A footer records when the recommendation was generated, the window analyzed, and how many pages informed it.
Reports
The Reports tab is where you build a report from a template, set its scope, and configure sending settings.
Build a report
In the Report builder, select a template. Each template scopes the report to a different area:
Executive response summary: Volume, response targets, escalation containment, and service risk.
Message receipt and confirmation: Who received, confirmed, missed, or failed delivery, by channel.
Escalation policy effectiveness: Step depth, repeats, first-level containment, and policy comparisons.
Assignment group performance: Page load, response percentiles, primary versus secondary, and after-hours work.
Incident engagement detail: Multi-team page waves, delivery attempts, acknowledgements, and resolution.
Responder load and fairness: Interruptions, acknowledgement share, escalation-away rate, and workload balance.
In the Report name field, enter a name, for example
Monthly On-Call Review. Saved reports are shared with everyone in your organization, and anyone who can create reports can edit them.Set the Scope for teams and services. Each scheduled run covers the most recent 30 days.
Under Delivery formats, select any combination of PDF, Excel, and CSV. If you select none, all formats are sent.
Select how you'd like to send the report. The following options are available:
Email once now: enter one or more recipient addresses, then click Email report now. This sends the selected template with the scope and date range configured above.
Recurring schedule: set the cadence, day, time, and timezone, for example weekly on Monday at 9:00 a.m. Eastern Time. Enter the recipient addresses, then click Save & schedule. A confirmation line summarizes the schedule and formats, for example delivered weekly on Monday at 9:00 a.m. ET as PDF, XLSX, and CSV.
Manage scheduled reports
The Scheduled reports section lists every report and delivery schedule in your organization. Anyone who can create reports can edit, schedule, and delete any of them.
To review a report's configuration, select it to open its detail view, which shows the template, date window, response target, scope, creator, and any scheduled deliveries.
To change a report's name, description, or delivery schedule, open the Edit report page. The template, scope, and date window come from the report builder above.
To stop delivery without losing the report, pause it from the list. Deleting the report removes its schedule too.