Incident Correlation
Use BigPanda to automatically cluster related incidents based on shared attributes, infrastructure dependencies, and behaviors. You can run cluster analysis for specific time periods or view live correlation analysis for active incidents. This accelerates root cause identification and provides a clearer look at what’s happening in your environments.
This feature leverages the IT Knowledge Graph and AI to detect patterns across high-volume alert streams—identifying when multiple seemingly separate alerts are actually part of the same larger incident.
Assistance required
Enabling Incident Correlation requires close coordination with the BigPanda team. Contact your BigPanda account manager if you’d like to enable this feature.
Key features
AI-powered analysis: BigPanda uses generative AI to analyze data from multiple data sources and infrastructure points to provide you with a comprehensive look at your incident history.
Accelerated root cause identification: Incident clusters make it easier to identify root cause and recurring issues.
Visualize downstream effects: Get a clearer picture of incident impact using interactive topology maps.
How to use incident correlation
Incident correlation generates incident clusters based on AI analysis of both live and historical incidents. These clusters show the relationships between similar incidents, suggest root causes, and categorize incidents based on their type. They can be generated for both live and past incidents.
To generate a cluster for a live incident, use the Cluster tab in the incident details pane. This cluster will only cover incidents that are correlated to that specific incident at the time that you open the tab. This cluster will be cached for several hours, so if you want to update the cluster, you will need to click Rerun analysis. This will generate a new analysis of the incident and may return different results based on new data.
Processing time for live incidents
Depending on how many incidents need to be correlated, it may take several minutes to finish generating an incident cluster. Partial results will be available within a few seconds, and results will be auto-updated until the analysis is successfully completed.
To run correlation analysis for all incidents in a specified time period, use the Incident Correlation tab in the incident console and create a new report. This will correlate all incidents during that time period into clusters that can then be analyzed individually.
Incident relationships
There are six different relationships that may occur between incidents:
Source Caused Target: The source incident is assessed as upstream cause of the target.
Target Caused Source: The target incident is assessed as upstream cause of the source.
Bidirectional Cause: Mutual causality/feedback loop, represented with links in both directions.
Common External Cause: Incidents share the same upstream external factor (non-directional).
Recurrence: The same or highly similar incident repeating at a different time; for recurrence-only clusters, the oldest occurrence is chosen as the primary by default.
General: Strongly related incidents (semantic/topological similarity) without asserted causality or recurrence.
Analyze correlated incident clusters
When you click on the Cluster tab inside a specific incident or open a cluster from a historical incident correlation report, you will see a graph that maps the relationships between correlated incidents, as well as a side panel that provides additional details.
Primary incident
The cluster centers on a primary incident, which is usually the suspected root cause. If a cluster has no causality relationships, however, the primary incident will be the oldest incident in the cluster.
If you want to set a different incident as the primary, you can do so by clicking on the incident within the graph and choosing Set as Primary from the right-hand panel.
Cluster analysis
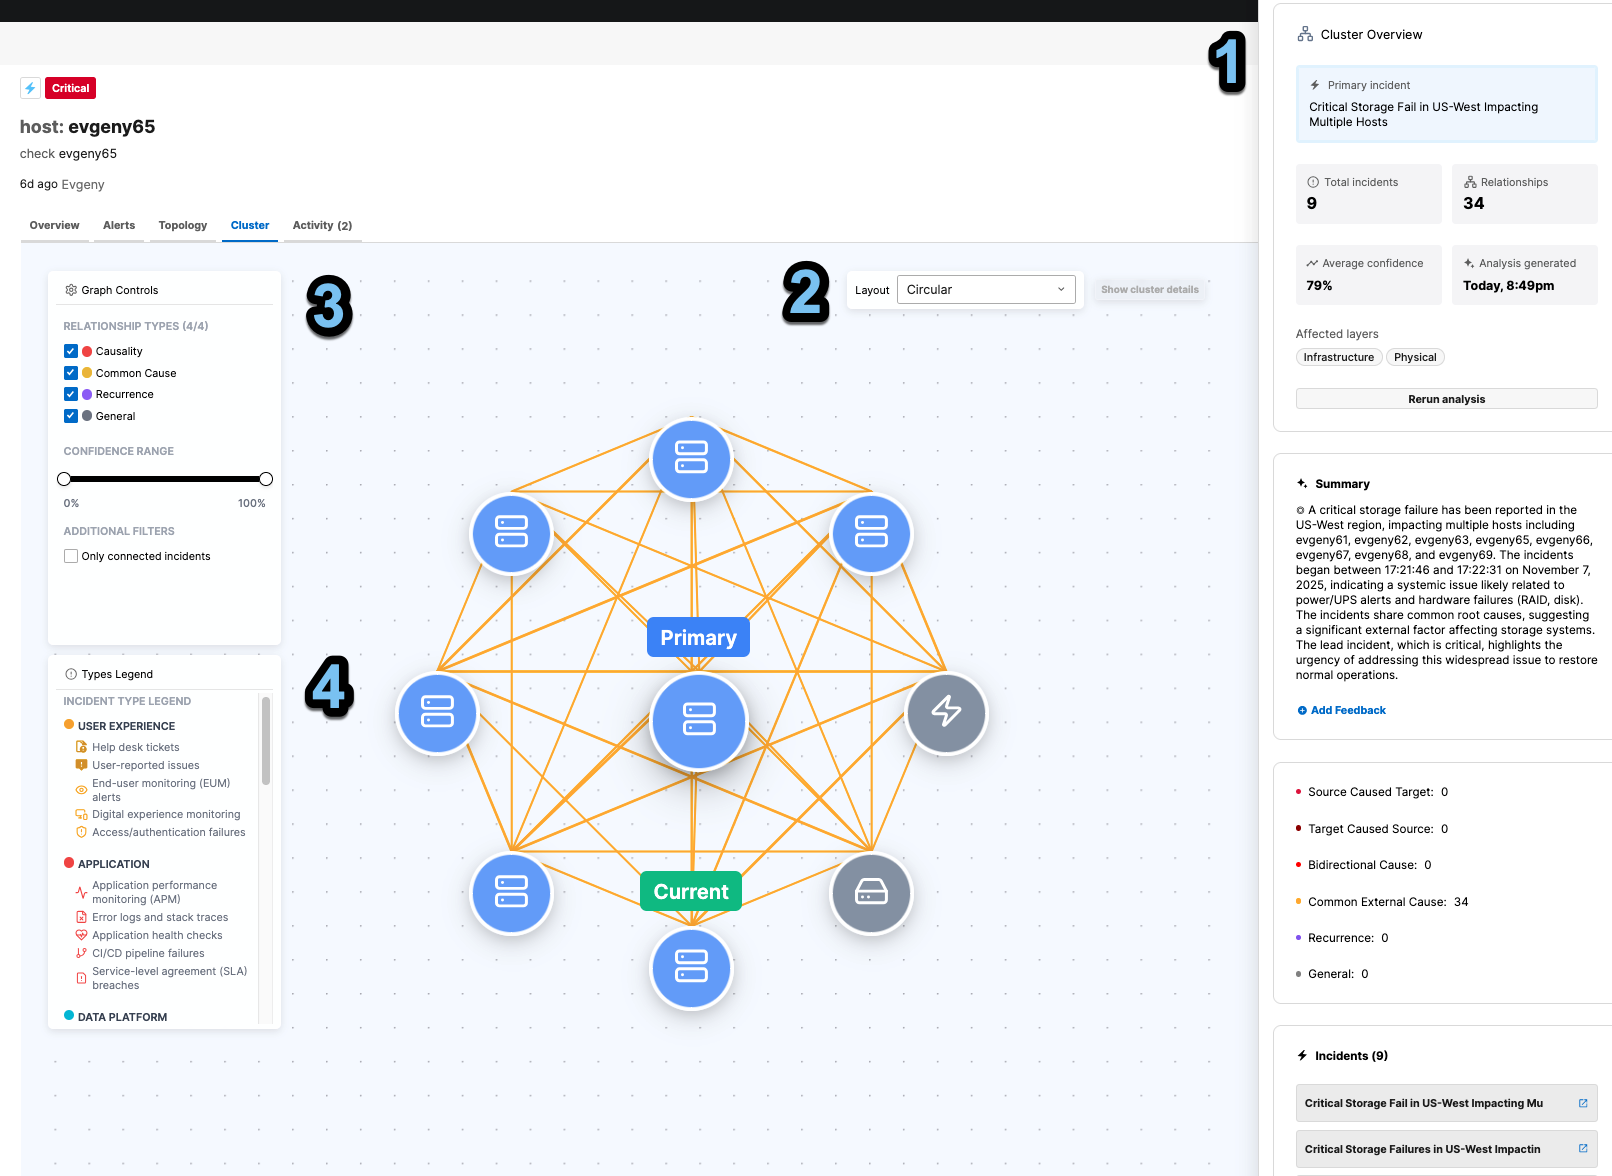
Field | Description |
|---|---|
1 - Cluster Overview | At-a-glance view of the key information for this cluster. Includes four sections:
|
2 - Layout | Change the data visualization style. Circular - View incidents on a radial graph centered around the primary incident. Hierarchical - View incidents based on the degree of connection to the primary incident. Layered - View incidents based on their incident type. In all layouts, you can click an incident and drag it to reposition it on the graph. |
3 - Graph Controls | Filter incidents based on relationship type and AI confidence score. Note that changing relationship and confidence filters will only hide the connection lines between incidents, not the incidents themselves. If you wish to remove incidents from the view, select Only connected incidents. |
4 - Types Legend | A legend explaining the types and subtypes of incidents and the associated icons. |
Incident details
Click on any incident in the graph to see more details about that particular incident and the incidents connected to it.

Field | Description |
|---|---|
1 - Incident overview | An overview of the incident, including a link to the incident page. Click Add feedback to send your BigPanda team feedback about the accuracy and usefulness of the incident summary. If the incident you select is not the primary incident, you will have the option to Set as primary. |
2 - Connected incidents | Overview of all the incidents directly connected to this incident, including a link to the incident page. |
3 - Relationships | A breakdown of the different relationships between this incident and those it’s connected to. |