The Incidents Tab

The Incidents tab provides a centralized place to manage your BigPanda incidents.

Incident information in BigPanda can be managed from a centralized location in the Incidents tab within the UI. You can organize, assign, investigate, and escalate incidents as necessary to facilitate a quick resolution.

The Environments pane organizes your incidents by environment, group, and status. Within the Incident Feed, you can easily see all of the incidents within a chosen environment, or search for incidents. The Incident Details pane provides information about a specific incident from the Incident Feed.

For more information about Incidents, see the Incidents in BigPanda documentation.

The Incidents Tab

The Incidents Tab

FieldDescriptionRelated Links
1 - Environments PaneLists the Environments and folders that you can use to filter the incident feed.Manage Environments
2 - Incident FeedProvides a consolidated view of related incidents. You can filter the incident feed by searching or by selecting an Environment and a folder.Incident Feed
3 - Incident DetailsShows detailed information about the incident selected in the incident feed. You can view details of the related alerts, view the incident life cycle on a timeline, and more.Incident Details

Environments Pane

Environments filter incidents on properties such as source and priority and group them together for easy visibility and action. Environments make it easy for your team to focus on the incidents relevant to their role and responsibilities. Environments can be used to filter the incident feed, or to create dashboards, set up sharing rules, and simplify incident search.

The Environments Pane

The Environments Pane

FieldDescriptionRelated Links
1 - Environment FilterAllows you to filter the Environments pane by folder or group.Environments
2 - Starred EnvironmentsEnvironments that were starred appear at the top of the pane.Environments
3 - Environment GroupsEnvironment Groups organize your environments by common functions or properties, for example, business services, teams, and infrastructure areas.Manage Environment Groups
4 - Environment FolderEach environment is pre-sorted into status folders: Active, Unhandled, Shared, Snoozed, and Resolved. Incidents that fit the environment rules will be automatically placed in their respective status folder(s).Environments
5 - Create a New EnvironmentClick the + New Environment button to add a new Environment.Create New Environments

Incident Feed

The incident feed provides a consolidated view of all active incidents from any integrated monitoring systems. After you’ve configured your integrations, you can use the incident feed to manage your incidents.

The Incident Feed

The Incident Feed

FieldDescriptionRelated Links
1 - Incident SearchUsed to search for incidents.Search Incidents

BigPanda Query Language
2 - Status IndicatorDisplays a colored ribbon on the left to indicate the incident status, which is determined by the most severe status of the related alerts.Incidents in BigPanda
3 - Number of Active AlertsCounts the number of related alerts that are in the Critical or Warning state.Incidents in BigPanda
4 - PriorityAssigned level of importance (most important on top). Incidents that do not have a priority assigned will be listed at the bottom by Last Changed.Triage Incidents
5 - Primary propertyShows why the alerts are correlated into an incident. By default, the primary property is defined as one of the following: host, service, application, or device.Primary_Property
6 - Secondary propertySummarizes the subjects (such as hosts or applications) that are part of the incident. By default, the secondary property is defined as one of the following: check or sensor.Secondary_Property
7 - Last change, Created, or DurationShows information relevant to the current sort order. You can point to it to see more specific information. See Sorting Incidents.Incidents in BigPanda
8 - Incident ActionsThe action icons allow you to resolve, snooze, comment on, or share an incident.Triage Incidents

Remediate Incidents

Incident Details Pane

👍

Incident Details Pane Improvements - Limited Availability

The Incident Details Pane has a new design. This includes improvements to the timeline, activity log, incident title, incident tags, and more.

This feature is available in a limited release. If you are interested in enabling this functionality, contact your BigPanda account team.

The Incident Details pane provides a comprehensive view of all information related to an incident. Use the Incident Details pane to view incident history and take action on incidents.

The Incident Details Pane

The Incident Details Pane

FieldDescriptionRelated Links
1 - Assign IncidentAllows you to assign or update the owner of the incident.Assign an Incident
2 - Incident ActionsProvides access to the available actions for an incident, such as Resolve, Snooze, Comment, and Share.Triage Incidents

Remediate Incidents
3 - Status IndicatorDisplays a colored ribbon on the left to indicate the incident status, which is determined by the most severe status of the related alerts.Alert/Incident Status

Incident Feed

Incident Life Cycle Logic
4 - PriorityAllows you to view or change the priority of the incident.Prioritizing Incidents
5 - Primary propertyShows why the alerts are correlated into an incident. By default, the primary property is defined as one of the following: host, service, application, or device.Primary_Property
6 - Secondary propertySummarizes the subjects (such as hosts or applications) that are part of the incident. By default, the secondary property is defined as one of the following: check or sensor.Secondary_Property

Incident Feed
7 - TimelineAllows you to visualize the life cycle of an incident on a timeline, which helps you understand how the incident has unfolded.Incidents in BigPanda

Incident Life Cycle Logic
8 - ExpandAllows you to expand the incident details pane to single pane view.Incidents in BigPanda
9 - TabsThe Overview tab, Alerts tab, Topology tab, Changes tab, and Activity tab are accessible from the center of the Incident Details screen.Incidents in BigPanda

Timeline

The Timeline

The Timeline

The timeline view is accessed within the Incident Details pane. On the right side of the pane, click the blue Timeline button. The timeline visually displays incident information and changes over time. It also shows the time when the first alert was received (incident start time) and the time when the incident was resolved (incident end time), or the current time if the incident is still active.

To see the complete details for an alert at any point in its life cycle, click a dot on the timeline. Then, click the arrows to step through the details of every status change for the alert.

ItemDescriptionRelated Links
Incident StatusDisplays a colored ribbon on the left to indicate the incident status, which is determined by the most severe status of the related alerts.Alert/Incident Status

Incident Feed

Incident Life Cycle Logic
No. of AlertsCounts the total number of alerts that the incident contains, regardless of the current status of the alerts.Incident Life Cycle Logic

Manage Alert Correlation
SystemShows the type of monitoring tool (such as Nagios or Zabbix) and the integration name (such as Production) that the events came from.Incident Feed

Integrate with BigPanda
Primary PropertyShows why the alerts are correlated into an incident. By default, the primary property is defined as one of the following: host, service, application, or device.Timeline

Manage Alert Correlation

Incident Titles
Secondary PropertySummarizes the subjects (such as hosts or applications) that are part of the incident. By default, the secondary property is defined as check or sensor.Timeline

Manage Alert Correlation

Incident Titles
Last ChangeCalculates the amount of time since the last change to the incident. This calculation includes status changes on related alerts and the addition of new alerts to the incident.Incident Feed
TimelineShows the history of status changes for every alert that the incident contains. Each row represents the history for an individual alert.Timeline

Manage Alert Correlation
Status ChangeDisplays a colored dot that represents a status change for the related alert. Click a dot to view the alert details at the time of the status change. Then, click the arrows to step through the details of every status change for the alert.Timeline

Incident Life Cycle Logic
Alert ListLists basic information about each alert that the incident contains, including a colored dot on the left to indicate the current status of the alert.Timeline

Manage Alert Correlation
Current StatusesCounts the number of related alerts that are in each of the current states: Critical, Warning, Ok (resolved), and Ack (acknowledged or maintenance).Incident Life Cycle Logic

Alert/Incident Status
Incident Start TimeShows the time when the earliest alert was received.Timeline

Incident Life Cycle Logic
Incident End or Current TimeShows the time when the incident was resolved (incident end time) or the current time if the incident is still active.Timeline

Incident Life Cycle Logic

Alerts Tab

The Alerts Tab

The Alerts Tab

The Alerts tab within the Incident Details pane displays information about alerts associated with an Incident. Within this tab, you can view changes and alert links, and split incidents.

Click any alert within the table to view additional details.. Which details appear can be configured by your BigPanda administrator. See Manage Alert Views for information on tailoring the alert view.

ItemDescriptionRelated Links
No. Of Active AlertsCounts the number of related alerts that are in the Critical or Warning state. Click the checkbox to view only Active alerts.Incident Details
No. of Maintenance AlertsCounts the number of related alerts that are associated with a Maintenance Plan. Click the checkbox to view only Maintenance alerts.Manage Planned Maintenance
No. of Resolved AlertsCounts the number of related alerts that have been Resolved. Click the checkbox to view only Resolved alerts.Remediate Incidents
SplitMultiple incident alerts can be split off and handled as a new incident.Split Incidents
Status IndicatorDisplays a colored dot on the left to indicate the current status of a related alert.Incident Details
LinkDisplays a clickable link icon if the alert contains any links to more information, such as runbooks or time-series metrics.Incident Details
SystemShows the type of monitoring tool (such as Nagios or Zabbix) and the integration name (such as Production) that the events came from.Incident Details

Integrate with BigPanda
Alert DataDisplays the data for each related alert in a table. The column headers show the tag names and the rows show the tag values. You can drag the center divider to resize the incident feed, and columns are added, removed, or resized dynamically as space allows.Incident Details
DurationShows the amount of time since the first event for each alert.Incident Details
Last ChangeShows the time of the last status change for each alert.Incident Details

Topology Tab

The Topology Tab

The Topology Tab

The Topology tab within the Incident Details pane provides access to the Topology graph for the incident. The Topology graph is a customizable visual display of the links between the incident's alert tags, or Nodes.

The Topology Graph

Each node on the topology graph represents an alert’s tag value. The tags present in the incident are labeled by type and displayed as icons in the Topology graph.

The numbers in the corners of the nodes indicate the frequency with which each unique tag and value appears in the incident. The more times a tag appears, the higher the likelihood that it’s a contributor to the Root Cause of the incident.

The lines connecting the nodes in the graph indicate that the linked nodes appear in the incident’s alerts together. Examining nodes with the most links can provide valuable insight into the possible Root Cause of the incident.

The Topology Graph

The Topology Graph

By default, BigPanda connects all the correlation tags into a circle. All the primary tags (ie: host) are connected to their associated correlation tags and the secondary tags (ie: check) are connected to their primary tags.

🚧

Customizing the graph using the Topology UI API will override BigPanda's default configuration.

Topology Graph Icons

The default icons that comprise the Topology graph are permanent and pre-defined by BigPanda. Additional configurable fallback icons are provided to allow users to define their own custom nodes.

The following are the nine permanent icons provided by BigPanda to represent the Topology node tag types:

IconTypeAssociated Tags
server'server', 'servers', 'host', 'hosts', 'hostname', 'hostnames', 'host_name', 'host_names', 'device', 'devices', 'instance', 'instances', 'object', 'objects', 'node', 'nodes'
location'location', 'locations', 'datacenter', 'datacenters', 'dc', 'store', 'stores', 'site', 'site_code', 'store_id', 'region', 'regions', 'city', 'country', 'geo'
check'check', 'checks', 'trigger', 'triggers', 'alert_type', 'alert_name', 'health_rule', 'summary', 'monitor', 'health_rules', 'title', 'titles'
environment'environment', 'environments', 'env', 'envs', 'tier', 'tiers', 'stage'
application'application', 'applications', 'app', 'apps', 'service', 'services', 'business_service'
IP'ip_address', 'ipaddress', 'ipaddresses', 'ip_class_b', 'ip_class_c', 'ip'
router'router', 'routers', 'switch', 'switches', 'hub', 'repeater', 'bridge', 'gateway'
cluster'rack', 'cluster', 'clusters', 'tower', 'towers'
team'owner', 'owners', 'team', 'teams', 'group', 'groups', 'assignment_group', 'responsible_group'

Filter

Topology Filters

Topology Filters

The node filtering options at the top of the Topology tab can be used to show/hide the nodes in the graph according to their corresponding tag type. The numbers beside the nodes in the filter represent the frequency with which the node appears in the topology graph.

Changes Tab

The Changes Tab

The Changes Tab

Change data related to an incident is displayed in the Changes tab within the Incident Details pane. BigPanda uses algorithms to correlate and suggest changes that may have caused an incident. If BigPanda has found a change to be highly correlated with an incident, it will appear at the top of the change table and in the Overview tab as a Potential Root Cause Change.

The Changes tab lists the details of changes that occurred shortly before or during the incident. BigPanda digests change records from change management integrations and correlates them by start time with incoming incidents in real time. By default, the change table chronologically displays the changes made in the 4 hours before the incident.

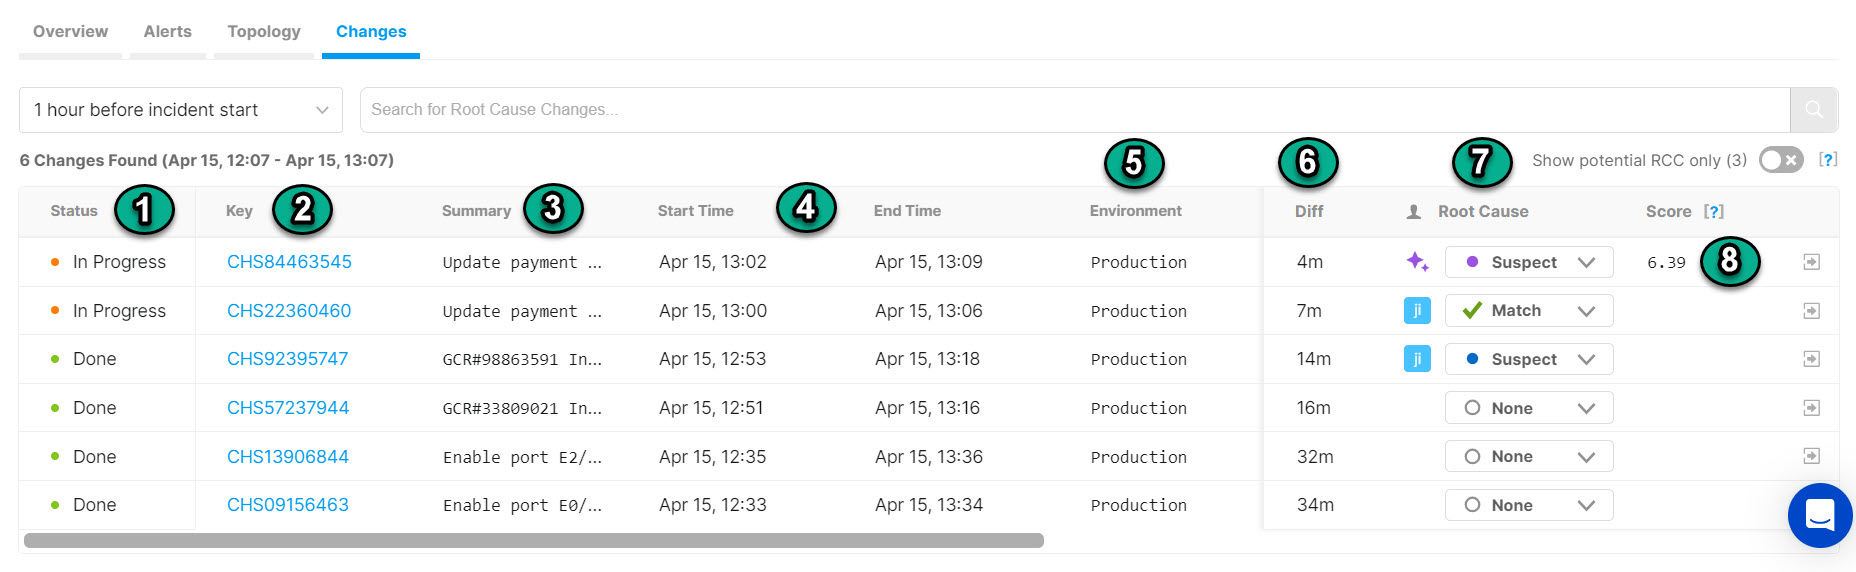
The change table contains columns that provide background information on the change.

ColumnDescription
StatusThe status of the change can be Planned, In Progress, Done. Canceled changes persist in BigPanda but are not displayed in the change table.
KeyThe key is the original ID from the integrated change. Click the hyperlinked change ID in the Key column of the table to view changes in the external change feed.
SummaryA short description of the change.
Start Time/End TimeThe timestamps marking the duration of the change.
Root CauseChanges that may be a suspected or matched root cause of the incident can be marked manually.

You are able to change the size and order of the columns within the change table. Hover over the space between column names to bring up the dividing line or the 6 dots.

  • To resize a column, click and drag the dividing line to the desired column width
  • To move a column, click and drag the 6 dots icon to the desired column placement

👍

Use the Show potential RCC only toggle to limit the change table to only show changes BigPanda has found highly correlated with the incident

Click on any one of the changes in the table to see a pop-up with the full list of tags and other data associated with the change.
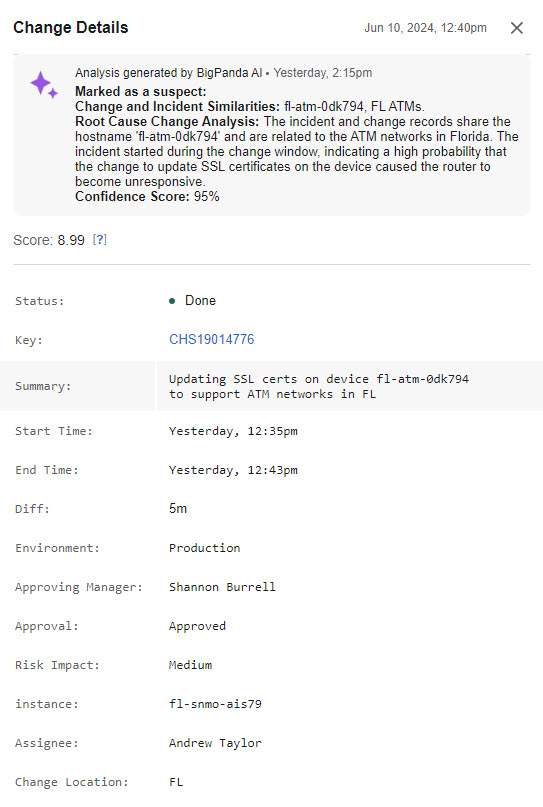
Change Info - BigPanda Suggestion

Change Info - BigPanda Suggestion

If the BigPanda change correlation algorithm marked the change as a suspected match, it will include a note about why the algorithm suspects the change. Hover over the information icon beside the note to get more details about why BigPanda suspects that change.

🚧

BigPanda will only mark changes as Suspect (and not Match) to give users the final say on whether or not the change is the root cause of the incident.

Activity Tab

The Activity Tab

The Activity Tab

The Activity tab within the Incident Details pane provides information about activities that occurred within an incident. Within this tab, you can view and add comments, see previous incident actions, and view status changes.

📘

Only the 1000 most recent activities appear in the BigPanda UI. If an incident has more than 1000 activities, all of them can be retrieved using the Get Activities API.

ItemDescriptionRelated Links
Hide Status ActivitiesAllows you to hide Resolved, Reopened, and Flapping activities.Incidents in BigPanda
Comment FieldAllows you to comment on the incident. Comments are added as events in the activity feed.Comment on Incidents
Event IndicatorDisplays an icon beside each item in the event list to indicate the type of event. See Event Indicators below for a description of each icon.Incidents in BigPanda
UsernameShows the user who made the update, if applicable.Viewing Incident and Alert Details
Event TimeShows the exact time the event occurred.Incidents in BigPanda
Event TypeShows the type of event that occurred.Incidents in BigPanda
Event DetailsShows more information about the event, depending on the event type. For example: For sharing events, shows the channel, recipients, and annotation, if applicable. If the recipient is an external ticketing system, provides a link directly to the ticket (for example, a JIRA ticket). For snoozed events, shows the ending time of the snooze period. For comment events, shows the comment text.Share Incidents

Manage AutoShare
Day SeparatorIndicates the day the preceding events occurred, if the list of events spans more than one calendar day. Because the event list is sorted with the most recent event on top, the day separator appears below the events that occurred on a given day.Incidents in BigPanda

Event Indicators

Incident Actions

Incident Actions Icons

Incident Actions Icons

Incident ActionIcon
Manually ResolvedGreen checkmark
SharedBlue arrow
AutoSharedBlue double arrows
CommentedYellow dialog box
SnoozedYellow bell
AssignedGrey bust with plus
MergedBlue many to one arrow
SplitBlue one to many arrows

Status Changes

Status Change Icons

Status Change Icons

Incident ActionIcon
CreatedOrange dot
ResolvedGreen dot
ReopenedOrange dot
FlappingOrange and green dots

RCC

RCC Activity Icons

RCC Activity Icons

Incident ActionIcon
Marked ChangePurple dot

Incident Tags

Incident Tags Activity Icons

Incident Tags Activity Icons

Incident ActionIcon
Updated a Multi-select FieldGrey bullet point lines
Updated a Single String FieldGrey paragraph lines

Next Steps

Learn more about Incidents in BigPanda

Learn about navigating the Unified Search Tab

Dig into how Incidents are created with BigPanda AIOps